| Param | Original file | Final file |
|---|---|---|
| Filename | modeM0/AS1A05_084T04_9000002694_18139cztM0_level2.evt | modeM0/AS1A05_084T04_9000002694_18139cztM0_level2_quad_clean.evt |
| Size (bytes) | 176,405,760 | 41,886,720 |
| Size | 168.2 MB | 39.9 MB |
| Events in quadrant A | 985,130 | 289,478 |
| Events in quadrant B | 1,098,777 | 284,224 |
| Events in quadrant C | 976,564 | 273,527 |
| Events in quadrant D | 2,132,838 | 264,287 |
| Mode SS | |||
|---|---|---|---|
| Quadrant | BADHDUFLAG | Total packets | Discarded packets |
| A | 0 | 42 | 0 |
| B | 0 | 42 | 0 |
| C | 0 | 42 | 0 |
| D | 0 | 42 | 0 |
| Mode M0 | |||
|---|---|---|---|
| Quadrant | BADHDUFLAG | Total packets | Discarded packets |
| A | 0 | 4370 | 0 |
| B | 0 | 4690 | 0 |
| C | 0 | 4357 | 0 |
| D | 0 | 7817 | 0 |
| Quadrant | Total seconds | Saturated seconds | Saturation percentage |
|---|---|---|---|
| A | 2168 | 2 | 0.092251% |
| B | 2168 | 17 | 0.784133% |
| C | 2169 | 3 | 0.138313% |
| D | 2169 | 106 | 4.887045% |
Noise dominated data is calculated using 1-second bins in cleaned event files. If a bin has >2000 counts, and if more than 50% of those come from <1% of pixels, then it is considered to be noise-dominated and hence unusable.
| Quadrant | # 1 sec bins | Bins with >0 counts | Bins with >2000 counts | High rate bins dominated by noise | Noise dominated (total time) | Noise dominated (detector-on time) | Marked lightcurve |
|---|---|---|---|---|---|---|---|
| A | 2168 | 2168 | 0 | 0 | 0.00% | 0.00% | 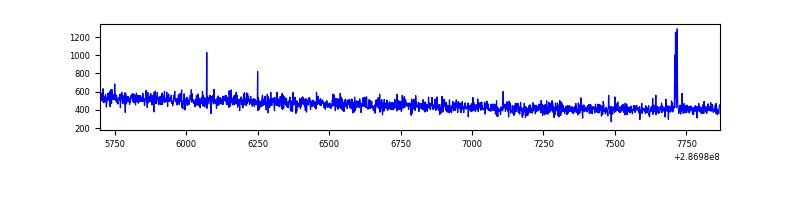 |
| B | 2168 | 2168 | 10 | 10 | 0.46% | 0.46% | 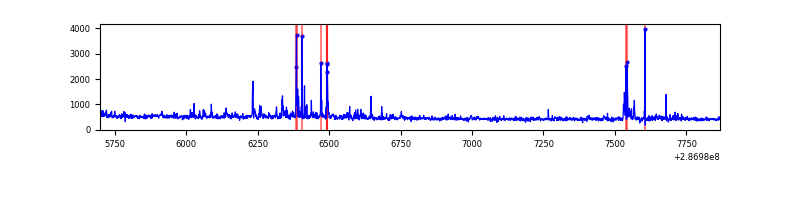 |
| C | 2169 | 2169 | 0 | 0 | 0.00% | 0.00% | 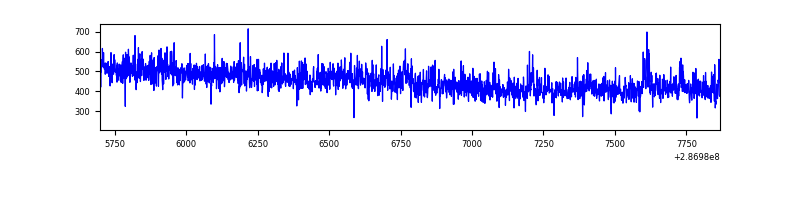 |
| D | 2169 | 2169 | 123 | 123 | 5.67% | 5.67% | 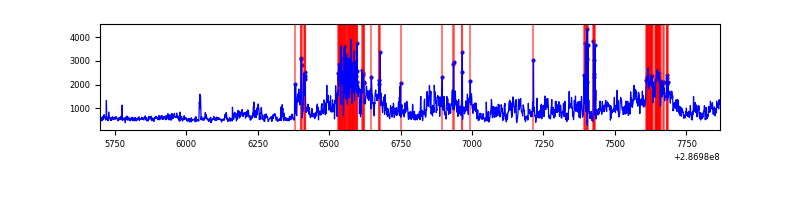 |
Top three noisy pixels from each quadrant. If the there are fewer than three noisy pixels in the level2.evt file, extra rows are filled as -1
| Pixel properties | Quadrant properties | ||||||
|---|---|---|---|---|---|---|---|
| Quadrant | DetID | PixID | Counts | Sigma | Mean | Median | Sigma |
| A | 15 | 174 | 6333 | 114.08 | 254 | 249 | 53.3 |
| A | 0 | 226 | 2322 | 38.87 | 254 | 249 | 53.3 |
| A | 12 | 194 | 1951 | 31.91 | 254 | 249 | 53.3 |
| B | 7 | 220 | 70599 | 1439.4 | 249 | 244 | 48.9 |
| B | 0 | 197 | 21230 | 429.35 | 249 | 244 | 48.9 |
| B | 0 | 189 | 12328 | 247.23 | 249 | 244 | 48.9 |
| C | 14 | 238 | 36740 | 643.46 | 235 | 236 | 56.7 |
| C | 3 | 233 | 16096 | 279.56 | 235 | 236 | 56.7 |
| C | 5 | 218 | 4754 | 79.63 | 235 | 236 | 56.7 |
| D | 7 | 238 | 734518 | 12290.51 | 238 | 231 | 59.7 |
| D | 12 | 110 | 182975 | 3058.77 | 238 | 231 | 59.7 |
| D | 11 | 176 | 125215 | 2091.99 | 238 | 231 | 59.7 |
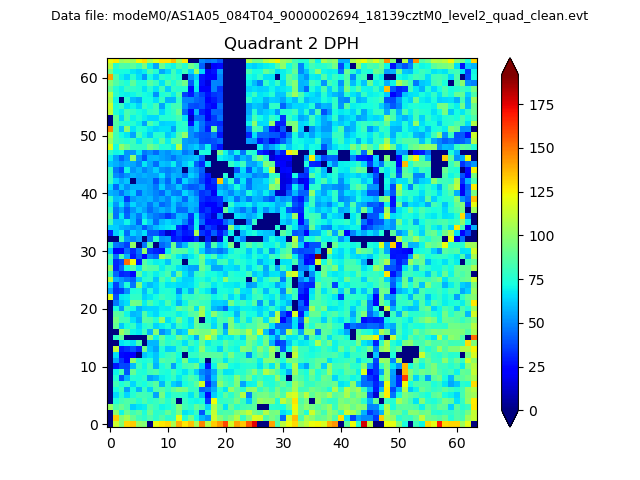
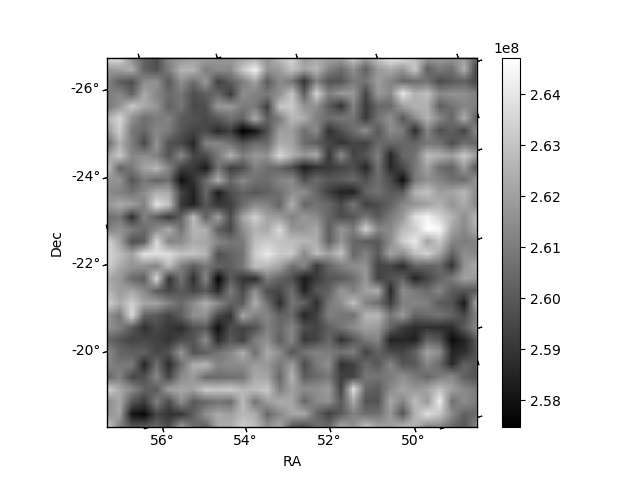
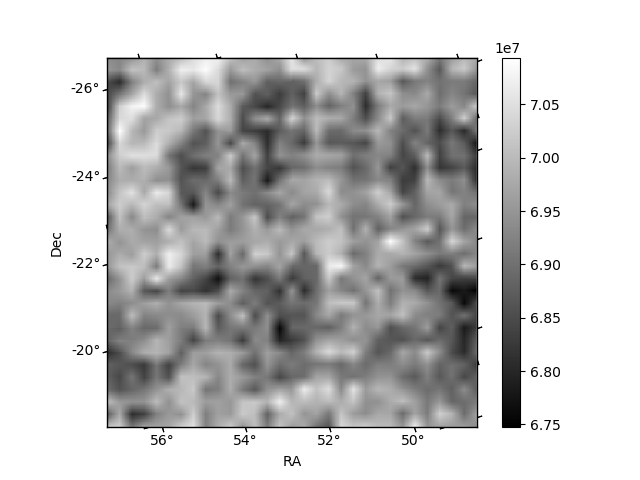
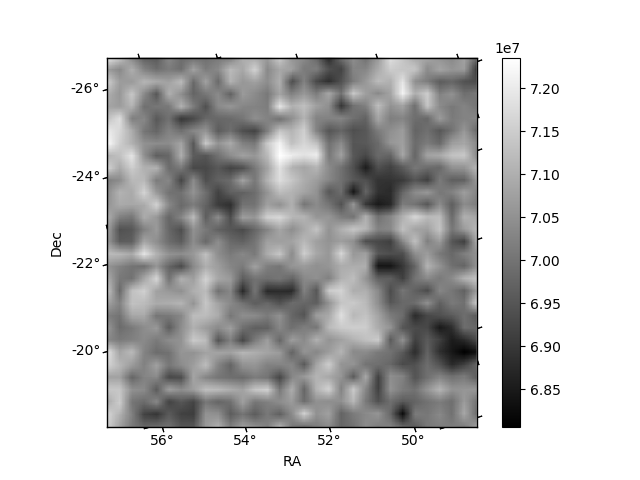
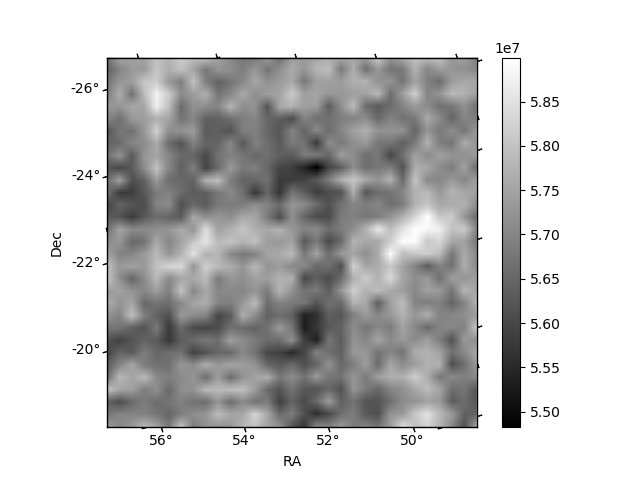
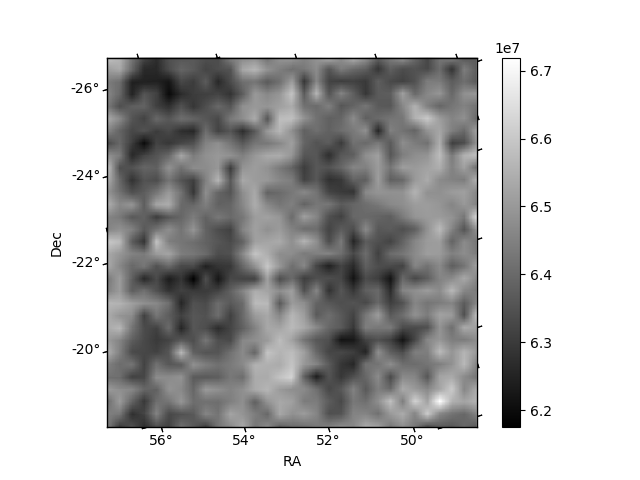
Histogram calculated using DETX and DETY for each event in the final _common_clean file
| Quadrant A | 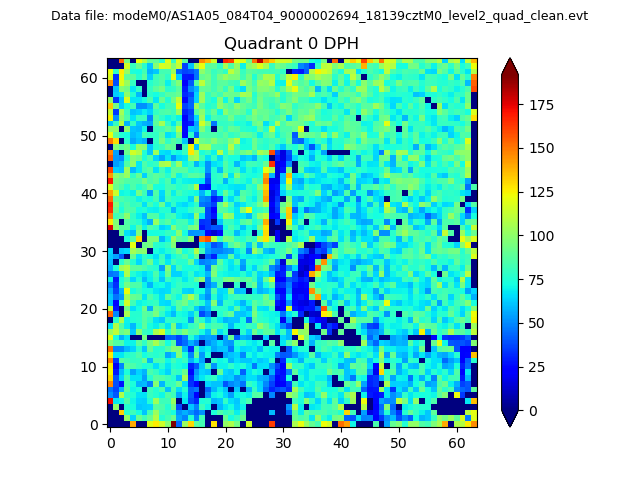 |
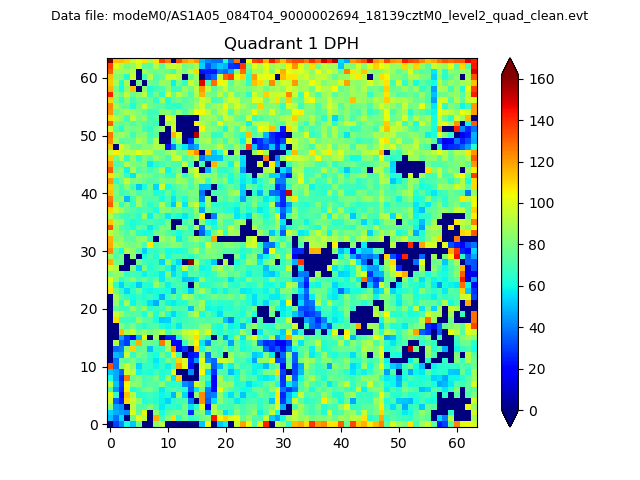 |
Quadrant B |
|---|---|---|---|
| Quadrant D | 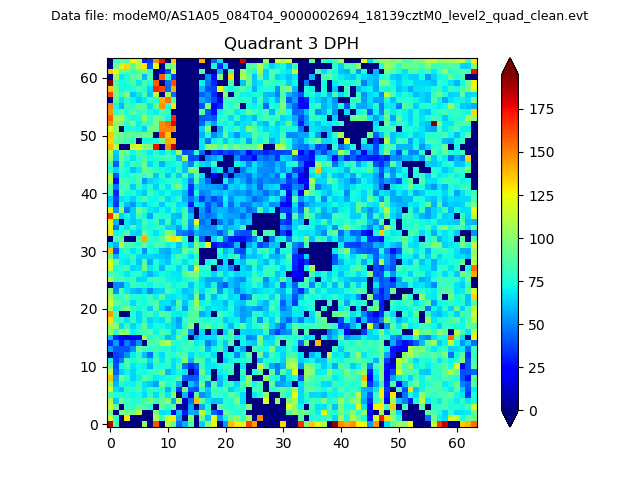 |
 |
Quadrant C |
| Plot type | Count rate plots | Images |
|---|---|---|
| Comparison with Poisson distribution Blue bars denote a histogram of data divided into 1 sec bins. Red curve is a Poisson curve with rate = median count rate of data. |
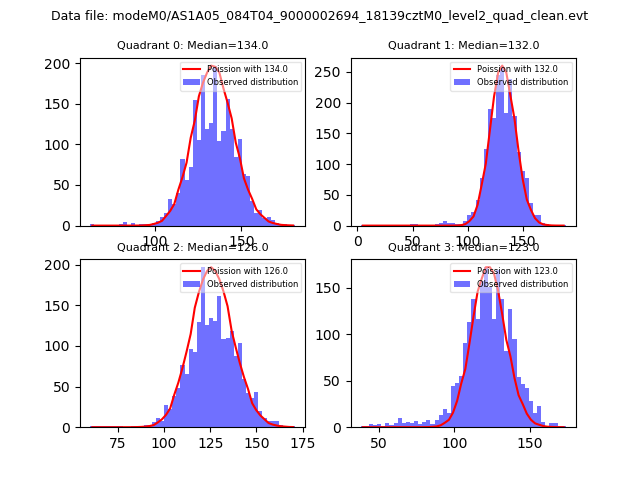 |
 |
| Quadrant-wise count rates Data is divided into 100 sec bins |
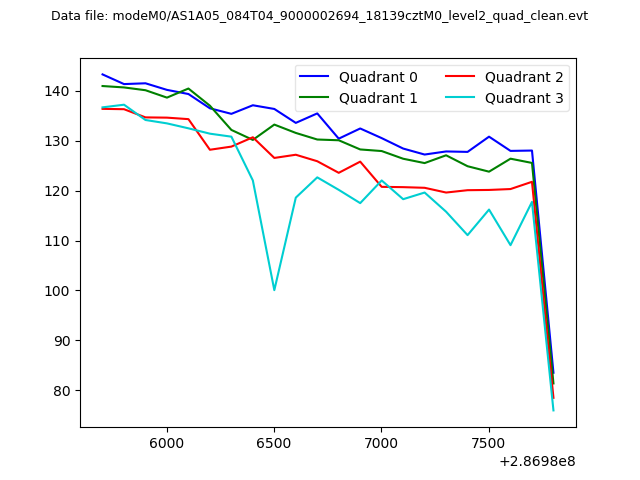 |
|
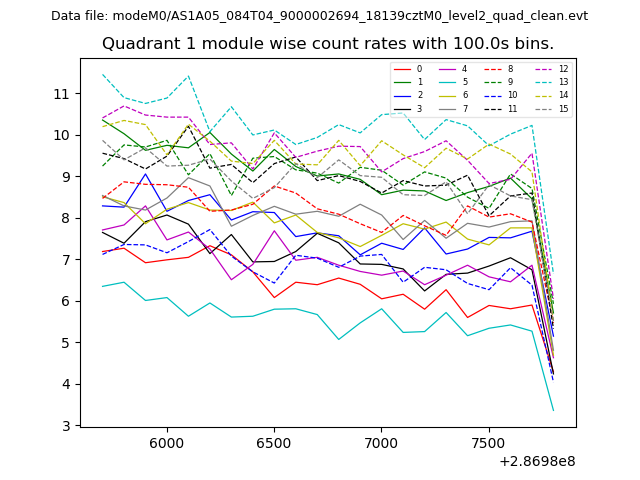
| Module-wise count rates for Quadrant A Data is divided into 100 sec bins |
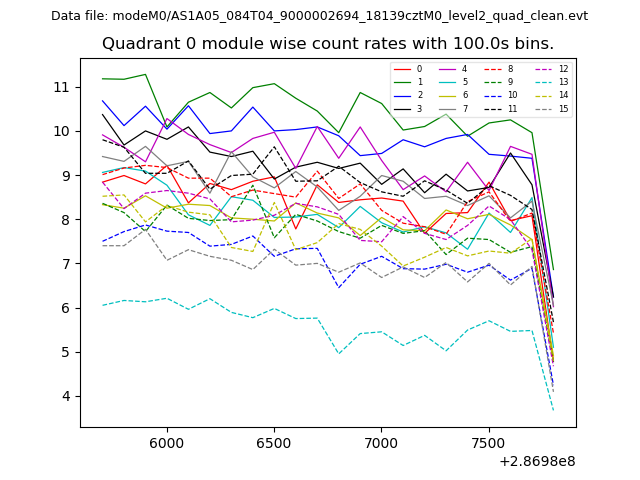 |
 |
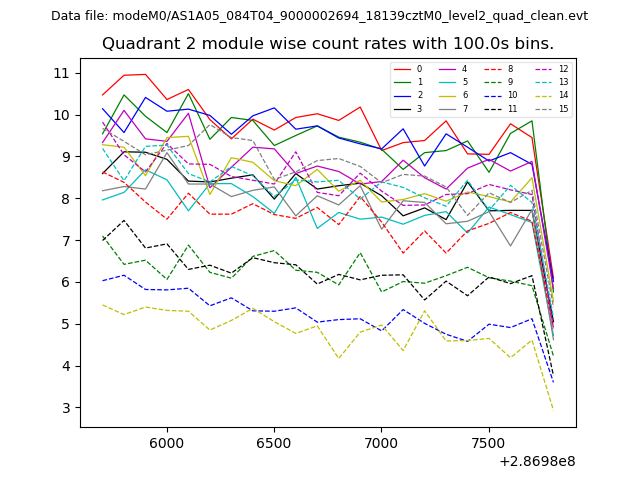
| Module-wise count rates for Quadrant B Data is divided into 100 sec bins |
 |
 |
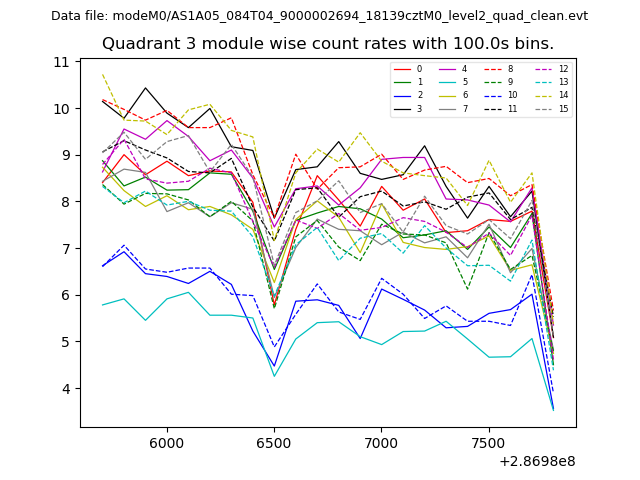
| Module-wise count rates for Quadrant C Data is divided into 100 sec bins |
 |
 |
| Module-wise count rates for Quadrant D Data is divided into 100 sec bins |
 |
 |
| Parameter | Plot |
|---|---|
| CZT HV Monitor | 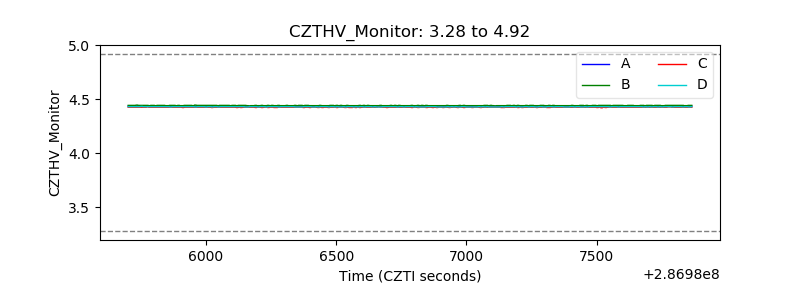 |
| D_VDD | 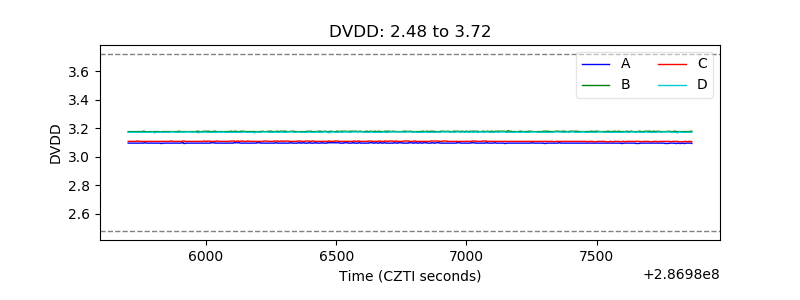 |
| Temperature 1 |  |
| Veto HV Monitor | 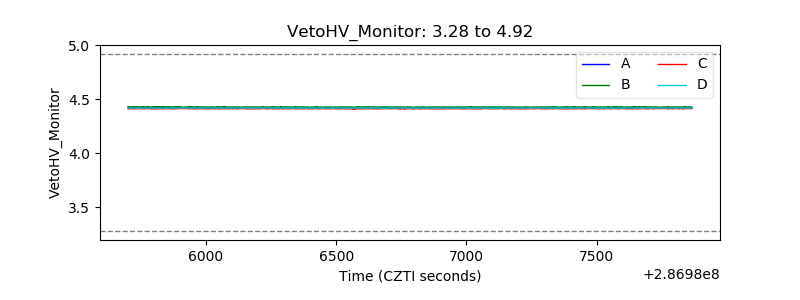 |
| Veto LLD | 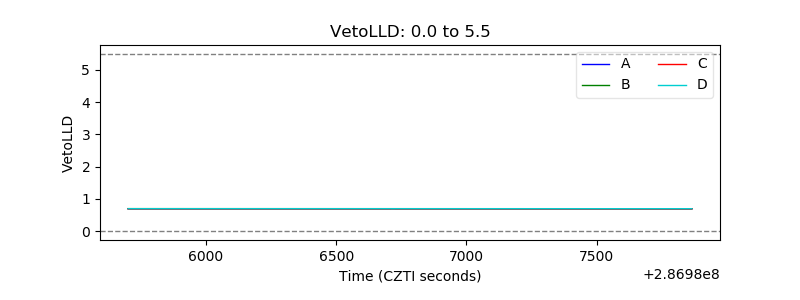 |
| Alpha Counter | 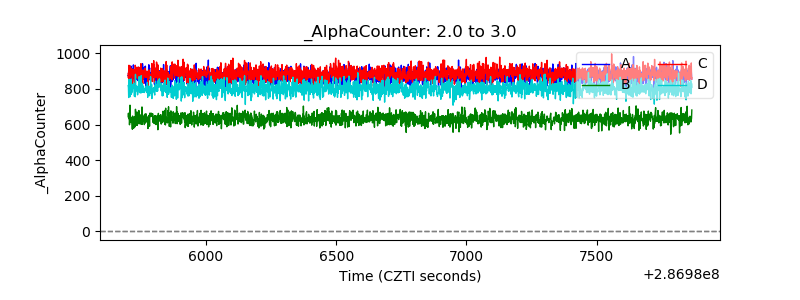 |
| _CPM_Rate | 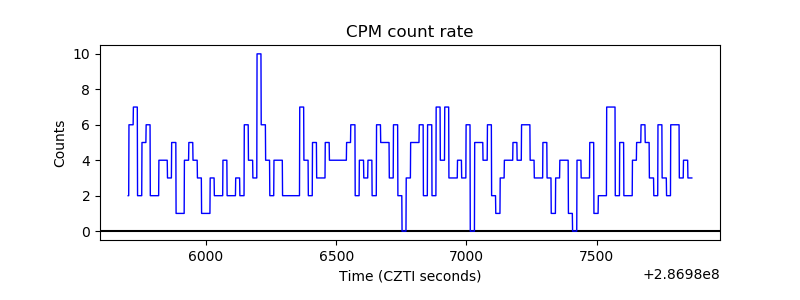 |
| CZT Counter | 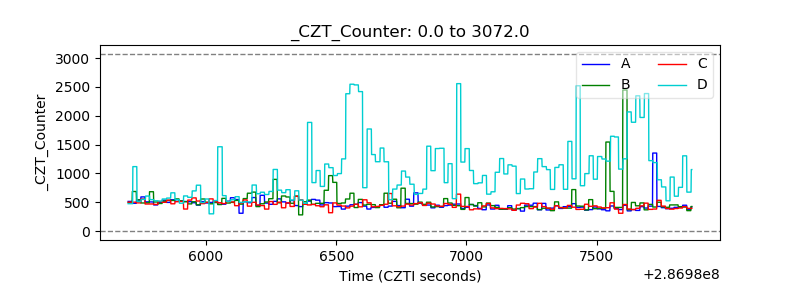 |
| +2.5 Volts monitor |  |
| +5 Volts monitor |  |
| _ROLL_ROT | 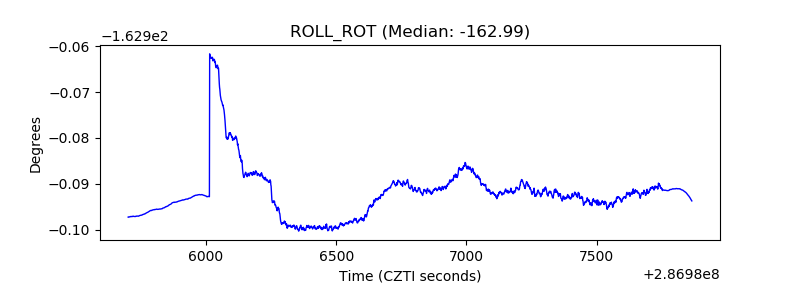 |
| _Roll_DEC | 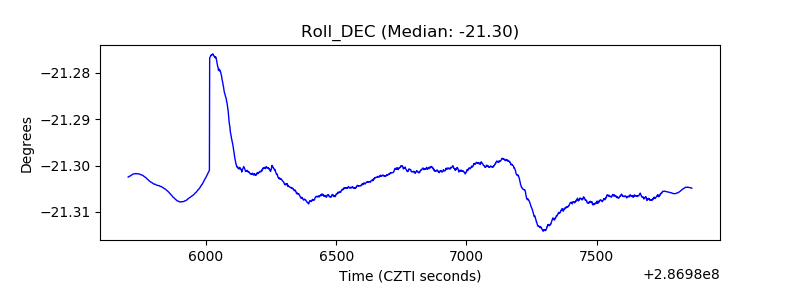 |
| _Roll_RA | 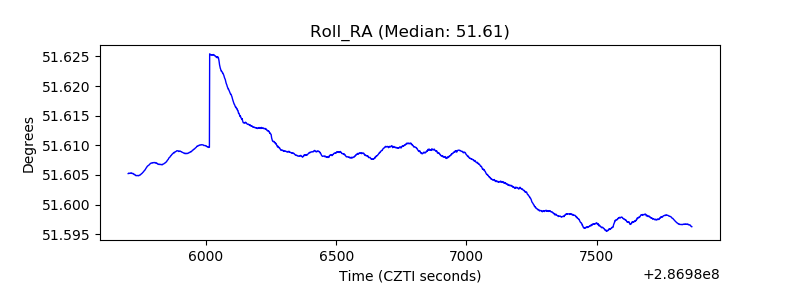 |
| Veto Counter | 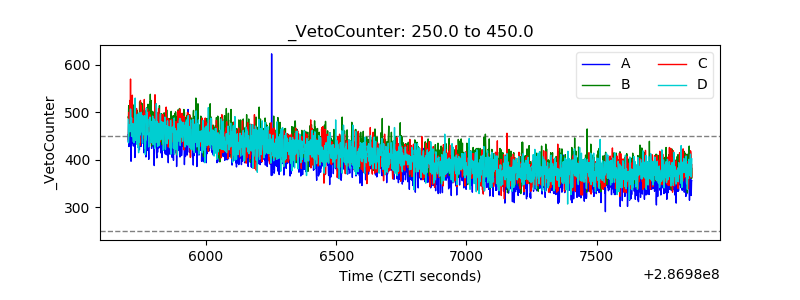 |