| Param | Original file | Final file |
|---|---|---|
| Filename | modeM0/AS1T03_035T01_9000002696_18139cztM0_level2.evt | modeM0/AS1T03_035T01_9000002696_18139cztM0_level2_quad_clean.evt |
| Size (bytes) | 213,503,040 | 29,724,480 |
| Size | 203.6 MB | 28.3 MB |
| Events in quadrant A | 1,402,929 | 177,695 |
| Events in quadrant B | 1,446,674 | 183,277 |
| Events in quadrant C | 1,413,048 | 175,735 |
| Events in quadrant D | 2,019,356 | 170,955 |
| Mode M9 | |||
|---|---|---|---|
| Quadrant | BADHDUFLAG | Total packets | Discarded packets |
| A | 0 | 8 | 0 |
| B | 0 | 8 | 0 |
| C | 0 | 8 | 0 |
| D | 0 | 8 | 0 |
| Mode M0 | |||
|---|---|---|---|
| Quadrant | BADHDUFLAG | Total packets | Discarded packets |
| A | 0 | 5700 | 1 |
| B | 0 | 5807 | 1 |
| C | 0 | 5711 | 1 |
| D | 0 | 7837 | 1 |
| Mode SS | |||
|---|---|---|---|
| Quadrant | BADHDUFLAG | Total packets | Discarded packets |
| A | 0 | 56 | 0 |
| B | 0 | 56 | 0 |
| C | 0 | 56 | 0 |
| D | 0 | 56 | 0 |
| Quadrant | Total seconds | Saturated seconds | Saturation percentage |
|---|---|---|---|
| A | 2676 | 47 | 1.756353% |
| B | 2676 | 63 | 2.354260% |
| C | 2676 | 74 | 2.765321% |
| D | 2676 | 111 | 4.147982% |
Noise dominated data is calculated using 1-second bins in cleaned event files. If a bin has >2000 counts, and if more than 50% of those come from <1% of pixels, then it is considered to be noise-dominated and hence unusable.
| Quadrant | # 1 sec bins | Bins with >0 counts | Bins with >2000 counts | High rate bins dominated by noise | Noise dominated (total time) | Noise dominated (detector-on time) | Marked lightcurve |
|---|---|---|---|---|---|---|---|
| A | 3511 | 2677 | 0 | 0 | 0.00% | 0.00% | 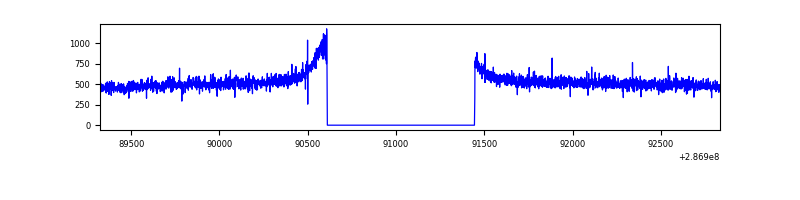 |
| B | 3511 | 2677 | 1 | 1 | 0.03% | 0.04% | 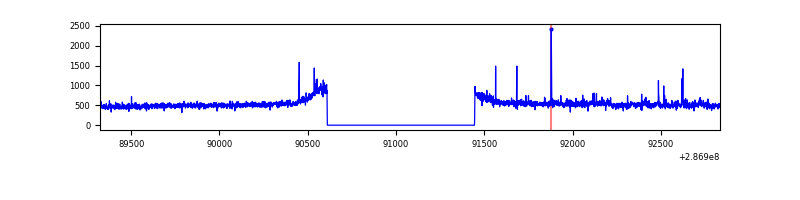 |
| C | 3511 | 2677 | 0 | 0 | 0.00% | 0.00% | 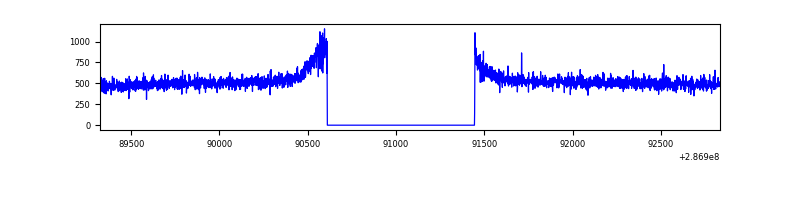 |
| D | 3511 | 2677 | 45 | 45 | 1.28% | 1.68% | 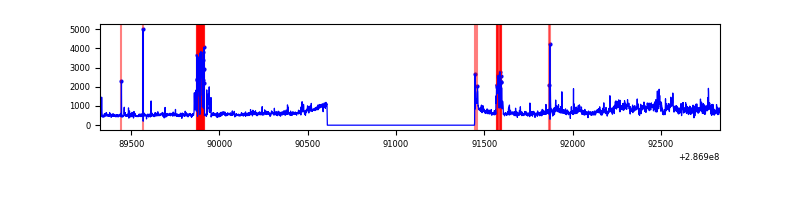 |
Top three noisy pixels from each quadrant. If the there are fewer than three noisy pixels in the level2.evt file, extra rows are filled as -1
| Pixel properties | Quadrant properties | ||||||
|---|---|---|---|---|---|---|---|
| Quadrant | DetID | PixID | Counts | Sigma | Mean | Median | Sigma |
| A | 0 | 226 | 3257 | 38.4 | 364 | 355 | 75.6 |
| A | 12 | 194 | 2736 | 31.51 | 364 | 355 | 75.6 |
| A | 3 | 137 | 2697 | 30.99 | 364 | 355 | 75.6 |
| B | 7 | 220 | 13562 | 185.54 | 360 | 351 | 71.2 |
| B | 0 | 189 | 9671 | 130.89 | 360 | 351 | 71.2 |
| B | 12 | 111 | 8052 | 108.15 | 360 | 351 | 71.2 |
| C | 14 | 238 | 51827 | 617.95 | 345 | 347 | 83.3 |
| C | 5 | 218 | 5814 | 65.62 | 345 | 347 | 83.3 |
| C | 3 | 233 | 4804 | 53.5 | 345 | 347 | 83.3 |
| D | 7 | 238 | 408915 | 4608.89 | 351 | 341 | 88.6 |
| D | 11 | 176 | 188288 | 2120.12 | 351 | 341 | 88.6 |
| D | 13 | 104 | 20727 | 229.96 | 351 | 341 | 88.6 |
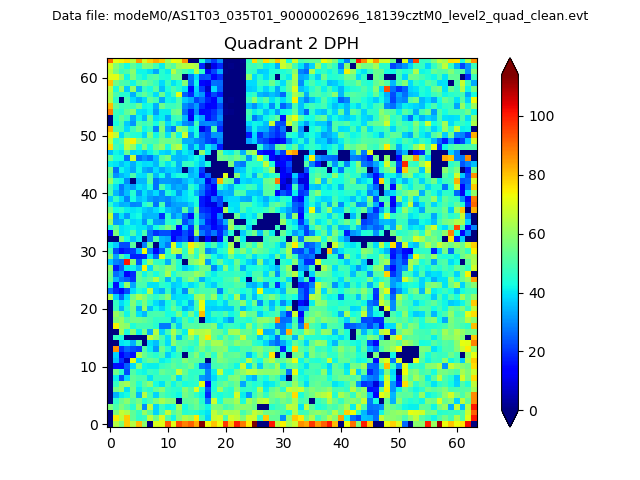
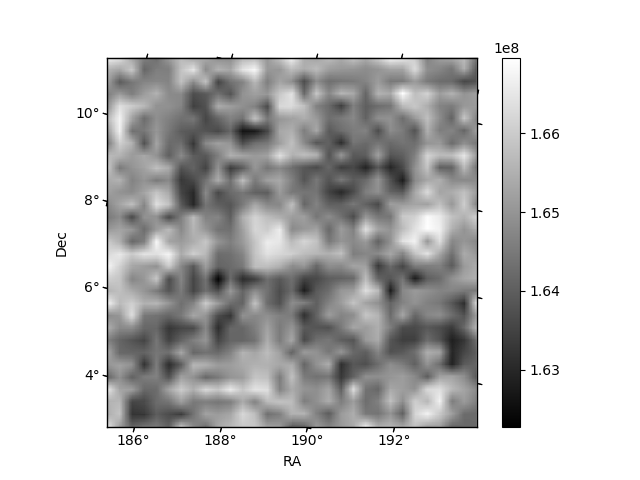
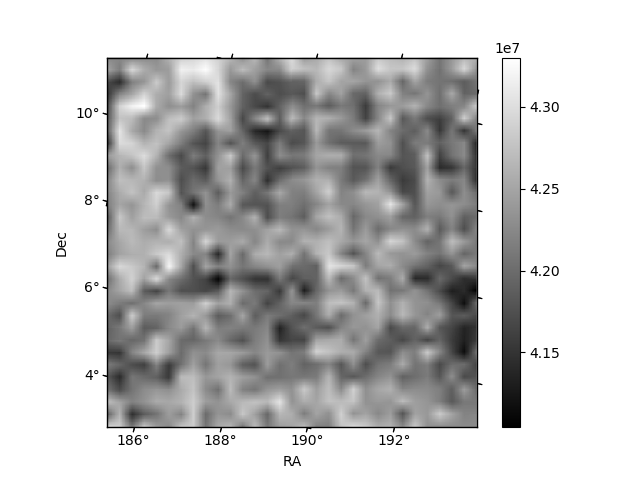
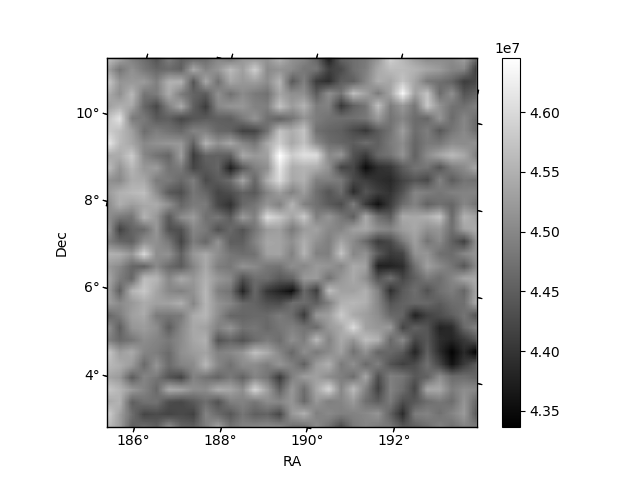
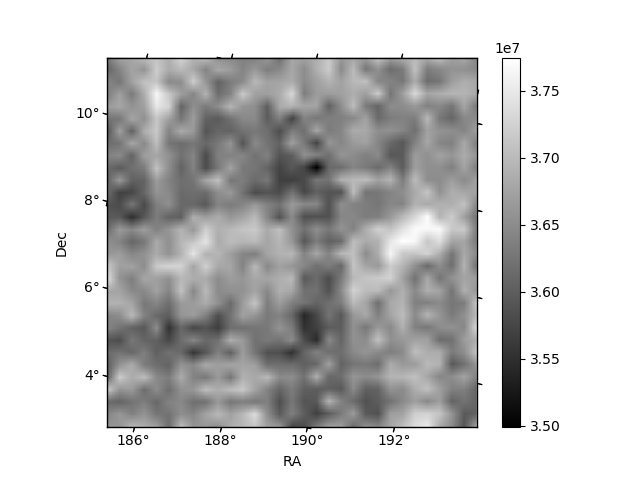
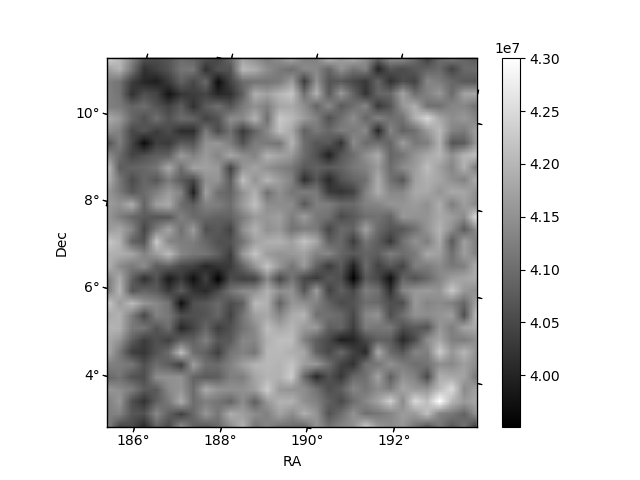
Histogram calculated using DETX and DETY for each event in the final _common_clean file
| Quadrant A | 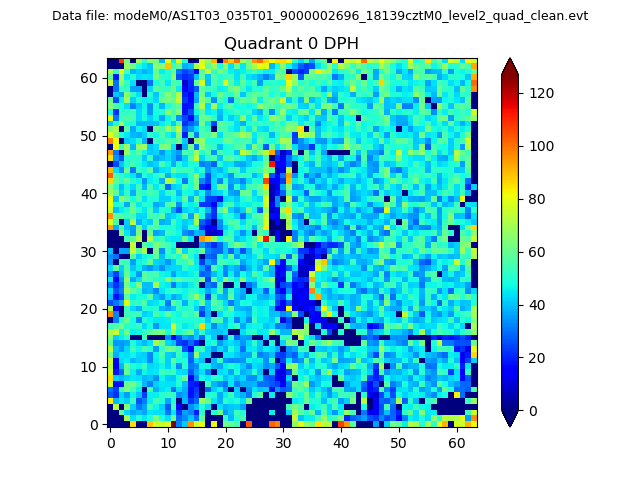 |
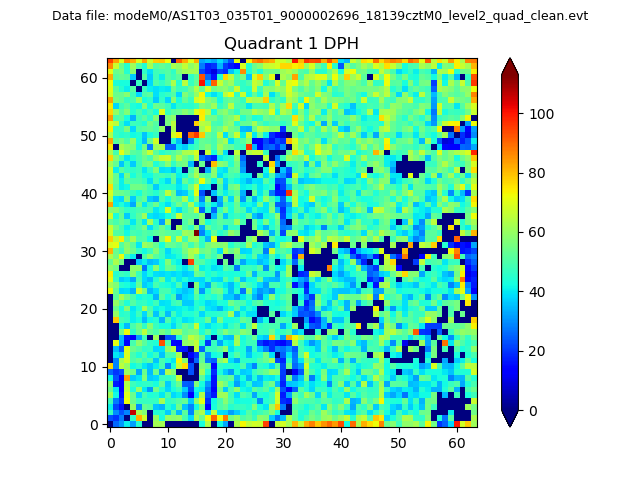 |
Quadrant B |
|---|---|---|---|
| Quadrant D | 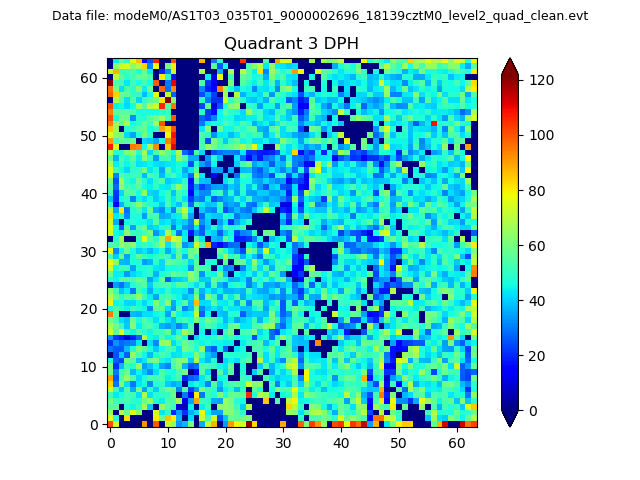 |
 |
Quadrant C |
| Plot type | Count rate plots | Images |
|---|---|---|
| Comparison with Poisson distribution Blue bars denote a histogram of data divided into 1 sec bins. Red curve is a Poisson curve with rate = median count rate of data. |
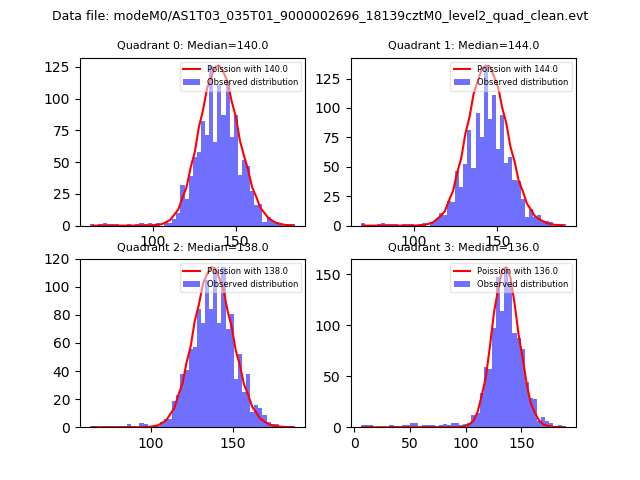 |
 |
| Quadrant-wise count rates Data is divided into 100 sec bins |
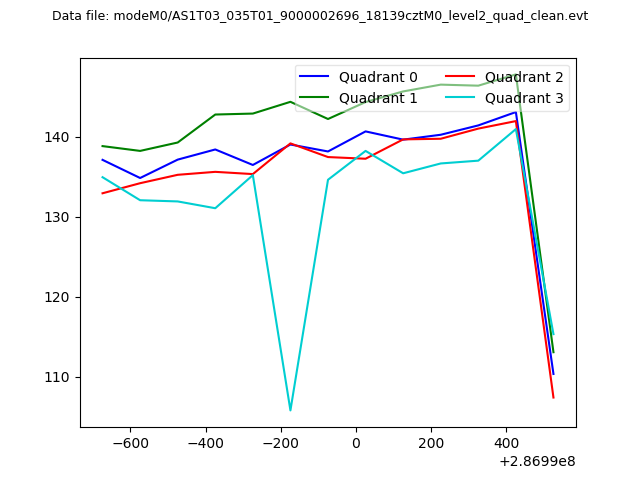 |
|
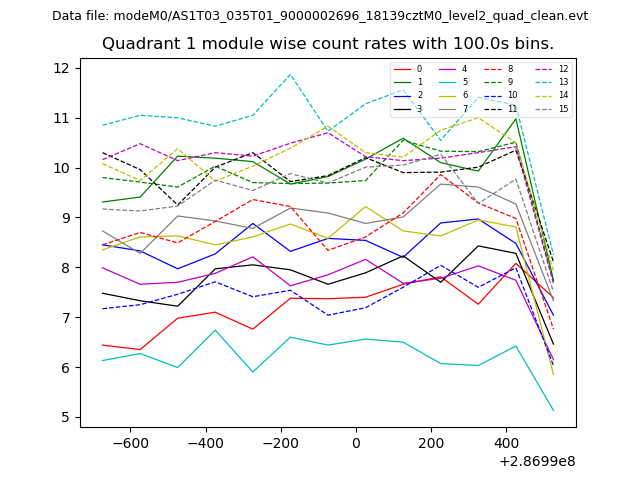
| Module-wise count rates for Quadrant A Data is divided into 100 sec bins |
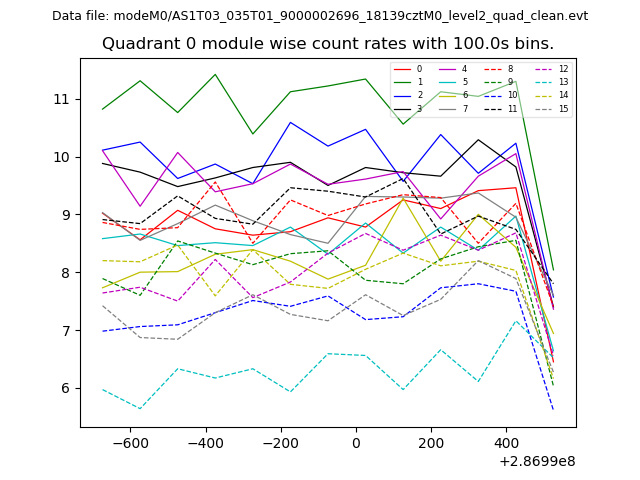 |
 |
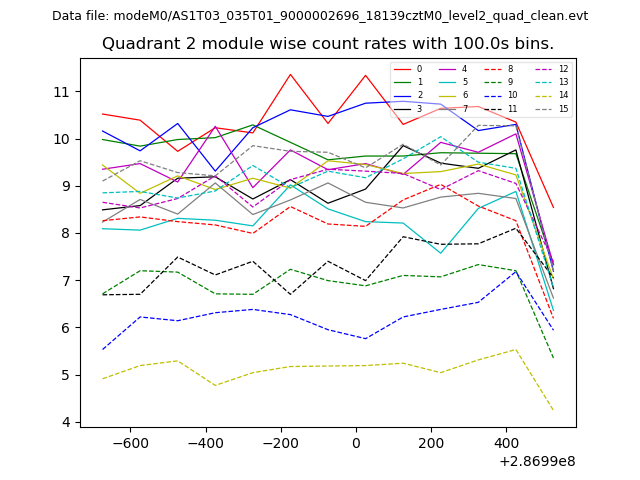
| Module-wise count rates for Quadrant B Data is divided into 100 sec bins |
 |
 |
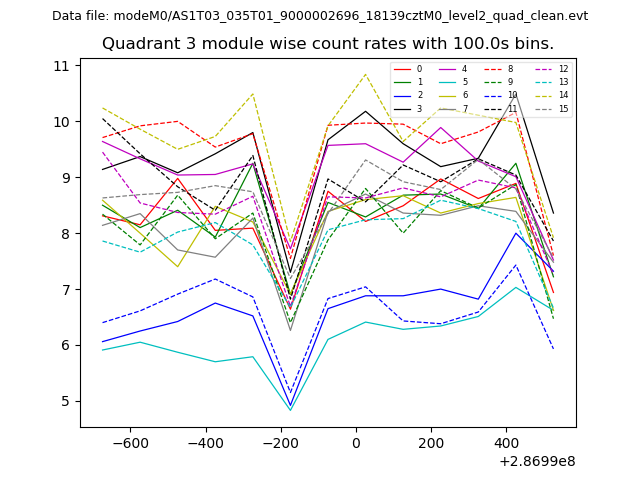
| Module-wise count rates for Quadrant C Data is divided into 100 sec bins |
 |
 |
| Module-wise count rates for Quadrant D Data is divided into 100 sec bins |
 |
 |
| Parameter | Plot |
|---|---|
| CZT HV Monitor | 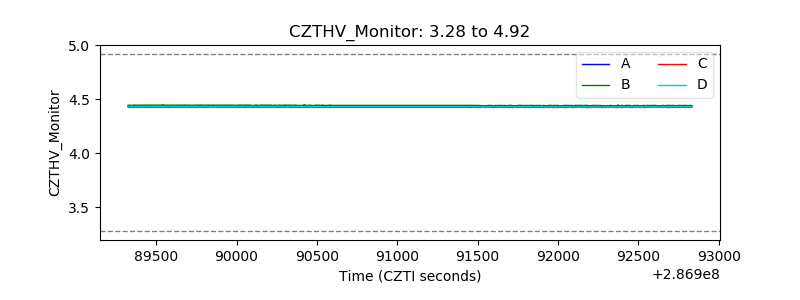 |
| D_VDD | 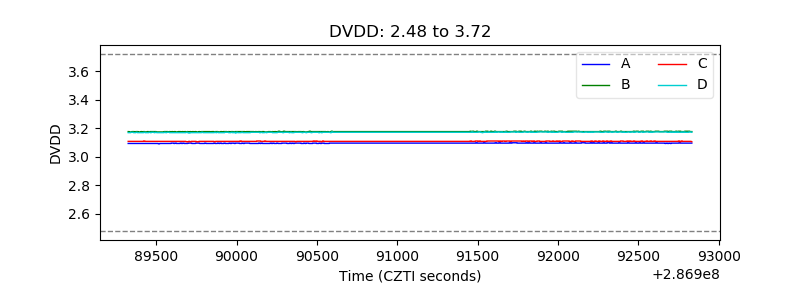 |
| Temperature 1 | 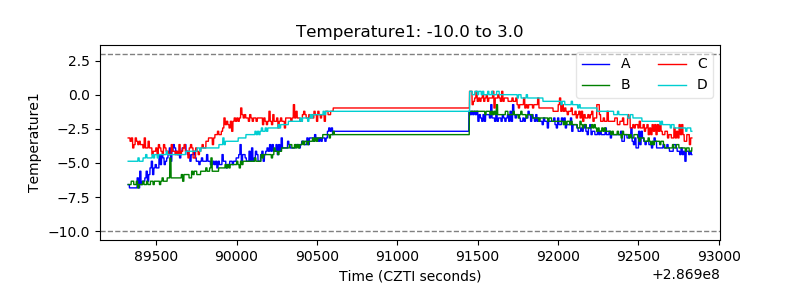 |
| Veto HV Monitor | 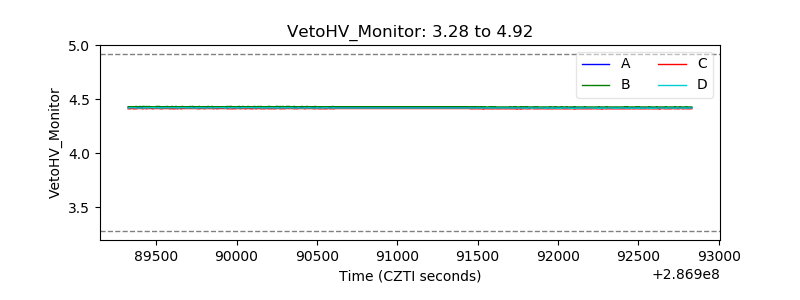 |
| Veto LLD | 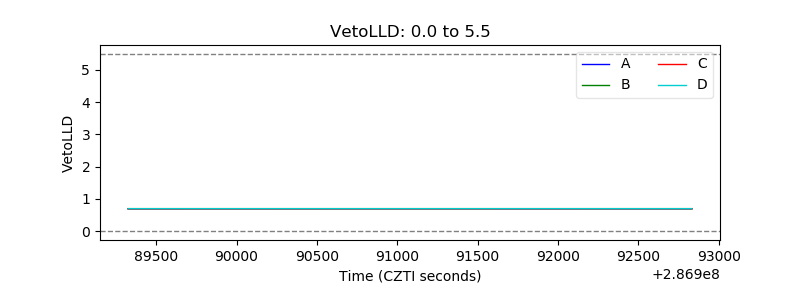 |
| Alpha Counter |  |
| _CPM_Rate |  |
| CZT Counter | 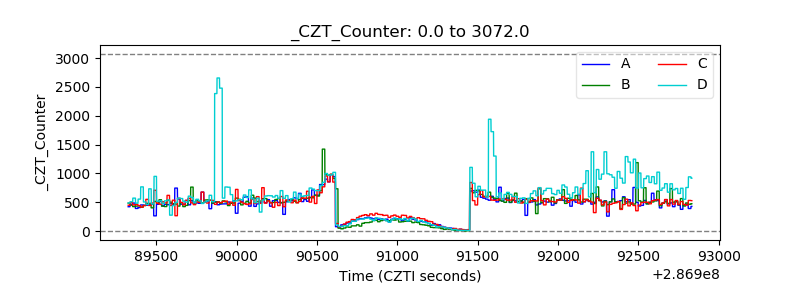 |
| +2.5 Volts monitor |  |
| +5 Volts monitor |  |
| _ROLL_ROT | 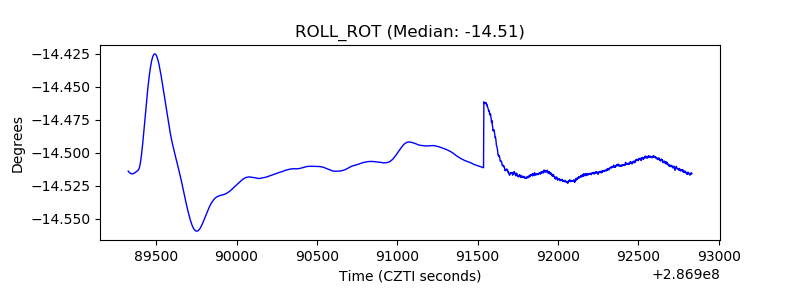 |
| _Roll_DEC | 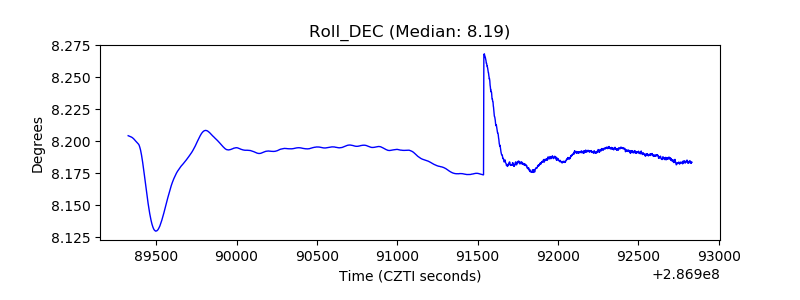 |
| _Roll_RA | 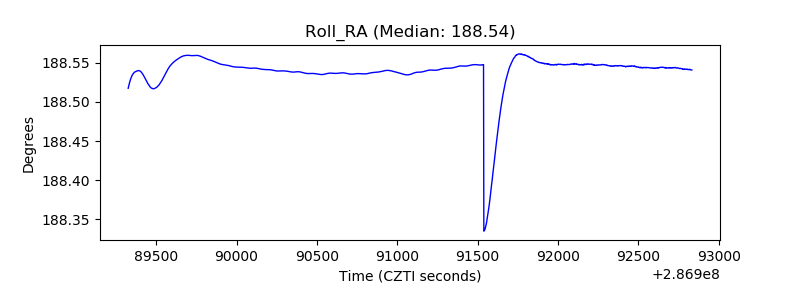 |
| Veto Counter | 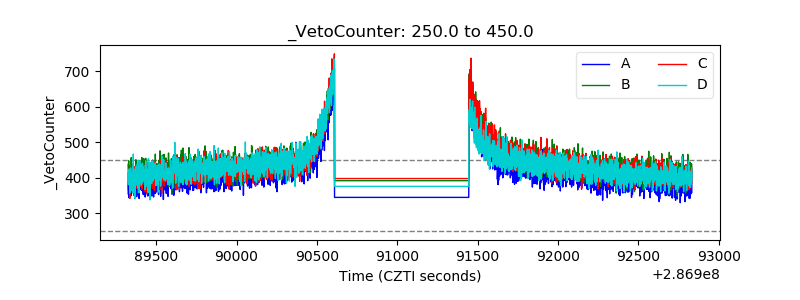 |