| Param | Original file | Final file |
|---|---|---|
| Filename | modeM0/AS1T03_035T01_9000002696_18141cztM0_level2.evt | modeM0/AS1T03_035T01_9000002696_18141cztM0_level2_quad_clean.evt |
| Size (bytes) | 623,580,480 | 87,935,040 |
| Size | 594.7 MB | 83.9 MB |
| Events in quadrant A | 4,227,888 | 528,079 |
| Events in quadrant B | 4,251,057 | 537,776 |
| Events in quadrant C | 4,073,633 | 521,436 |
| Events in quadrant D | 5,776,423 | 505,490 |
| Mode M9 | |||
|---|---|---|---|
| Quadrant | BADHDUFLAG | Total packets | Discarded packets |
| A | 0 | 6 | 0 |
| B | 0 | 6 | 0 |
| C | 0 | 6 | 0 |
| D | 0 | 6 | 0 |
| Mode M0 | |||
|---|---|---|---|
| Quadrant | BADHDUFLAG | Total packets | Discarded packets |
| A | 0 | 17807 | 2 |
| B | 0 | 17841 | 2 |
| C | 0 | 17256 | 2 |
| D | 0 | 22834 | 2 |
| Mode SS | |||
|---|---|---|---|
| Quadrant | BADHDUFLAG | Total packets | Discarded packets |
| A | 0 | 166 | 0 |
| B | 0 | 166 | 0 |
| C | 0 | 166 | 0 |
| D | 0 | 166 | 0 |
| Quadrant | Total seconds | Saturated seconds | Saturation percentage |
|---|---|---|---|
| A | 8208 | 170 | 2.071150% |
| B | 8209 | 228 | 2.777439% |
| C | 8209 | 217 | 2.643440% |
| D | 8209 | 338 | 4.117432% |
Noise dominated data is calculated using 1-second bins in cleaned event files. If a bin has >2000 counts, and if more than 50% of those come from <1% of pixels, then it is considered to be noise-dominated and hence unusable.
| Quadrant | # 1 sec bins | Bins with >0 counts | Bins with >2000 counts | High rate bins dominated by noise | Noise dominated (total time) | Noise dominated (detector-on time) | Marked lightcurve |
|---|---|---|---|---|---|---|---|
| A | 8703 | 8210 | 39 | 39 | 0.45% | 0.48% | 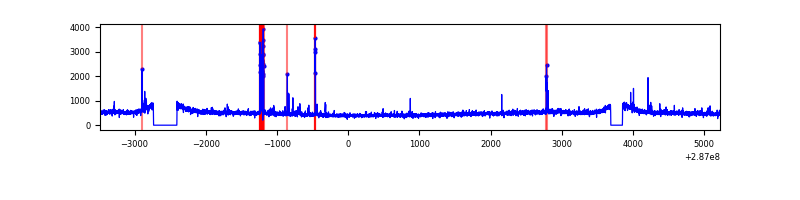 |
| B | 8704 | 8211 | 18 | 18 | 0.21% | 0.22% | 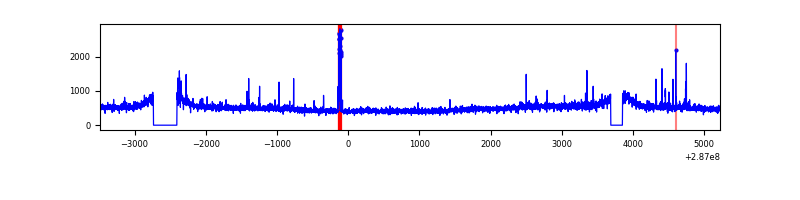 |
| C | 8704 | 8211 | 0 | 0 | 0.00% | 0.00% | 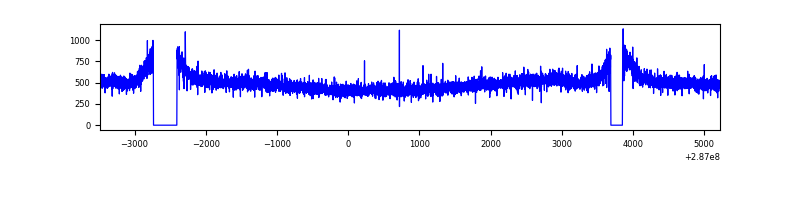 |
| D | 8704 | 8211 | 167 | 167 | 1.92% | 2.03% | 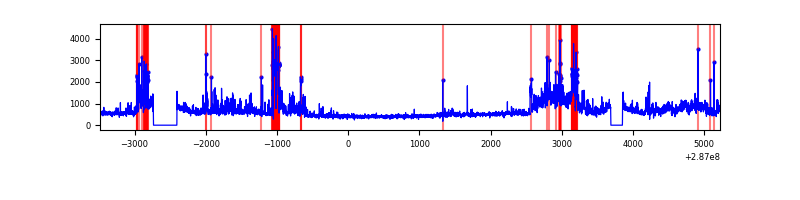 |
Top three noisy pixels from each quadrant. If the there are fewer than three noisy pixels in the level2.evt file, extra rows are filled as -1
| Pixel properties | Quadrant properties | ||||||
|---|---|---|---|---|---|---|---|
| Quadrant | DetID | PixID | Counts | Sigma | Mean | Median | Sigma |
| A | 15 | 174 | 168168 | 784.41 | 1043 | 1018 | 213.1 |
| A | 4 | 2 | 44481 | 203.97 | 1043 | 1018 | 213.1 |
| A | 0 | 226 | 9141 | 38.12 | 1043 | 1018 | 213.1 |
| B | 6 | 36 | 59251 | 290.5 | 1042 | 1018 | 200.5 |
| B | 0 | 189 | 36204 | 175.53 | 1042 | 1018 | 200.5 |
| B | 0 | 197 | 25018 | 119.72 | 1042 | 1018 | 200.5 |
| C | 14 | 238 | 152811 | 646.06 | 998 | 1000 | 235.0 |
| C | 3 | 233 | 21303 | 86.4 | 998 | 1000 | 235.0 |
| C | 5 | 218 | 9961 | 38.14 | 998 | 1000 | 235.0 |
| D | 7 | 238 | 1551326 | 6177.47 | 1007 | 976 | 251.0 |
| D | 12 | 110 | 220809 | 875.94 | 1007 | 976 | 251.0 |
| D | 13 | 104 | 77804 | 306.13 | 1007 | 976 | 251.0 |
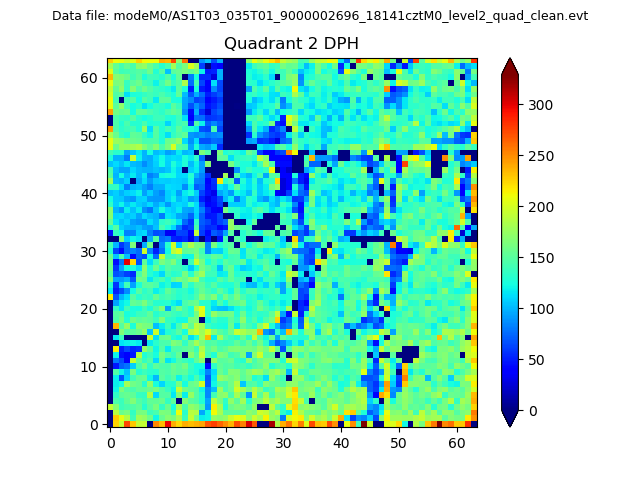
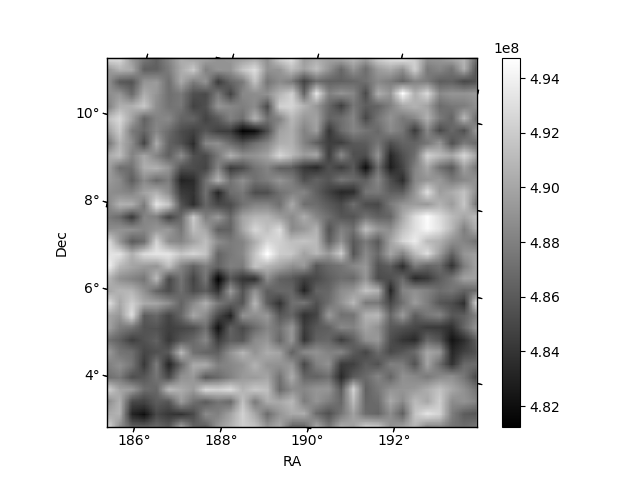
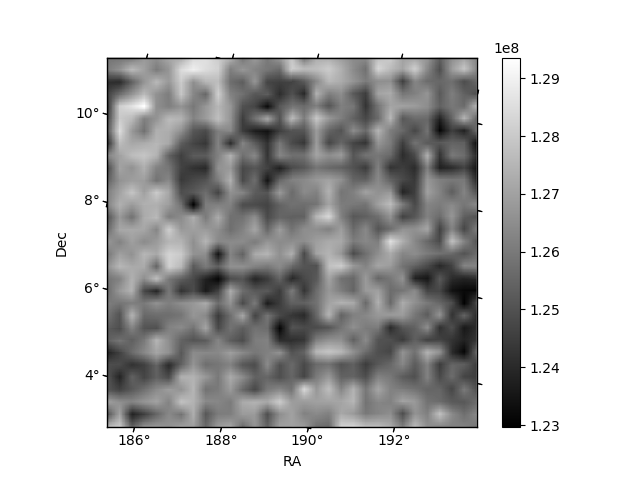
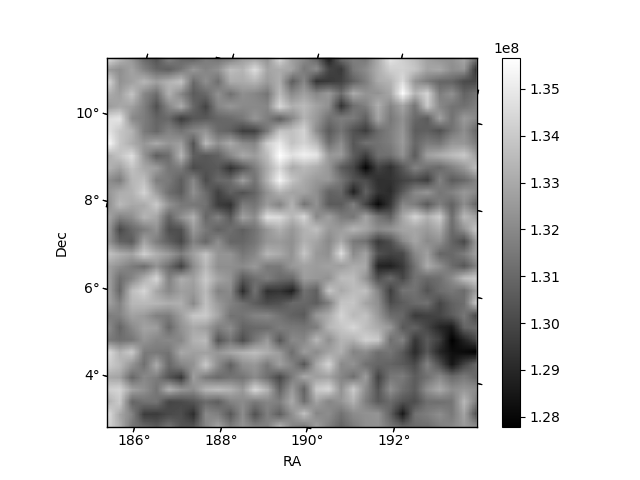
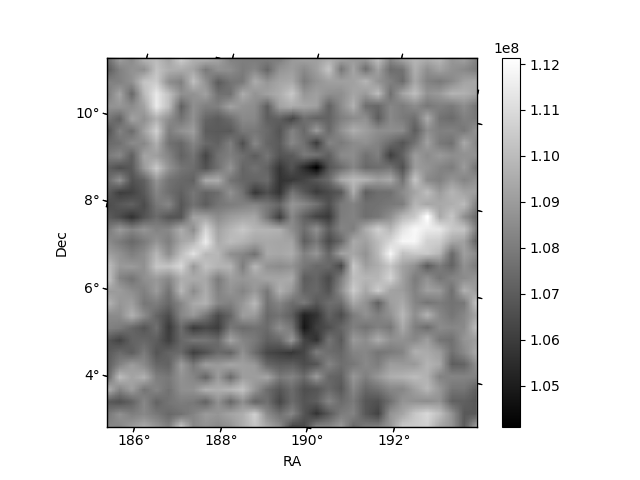
Histogram calculated using DETX and DETY for each event in the final _common_clean file
| Quadrant A | 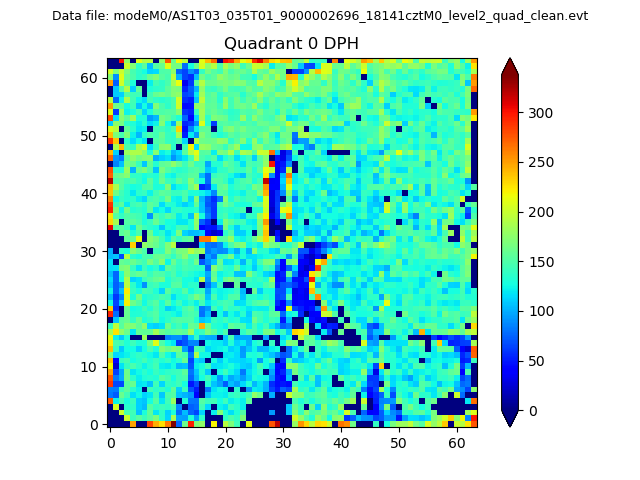 |
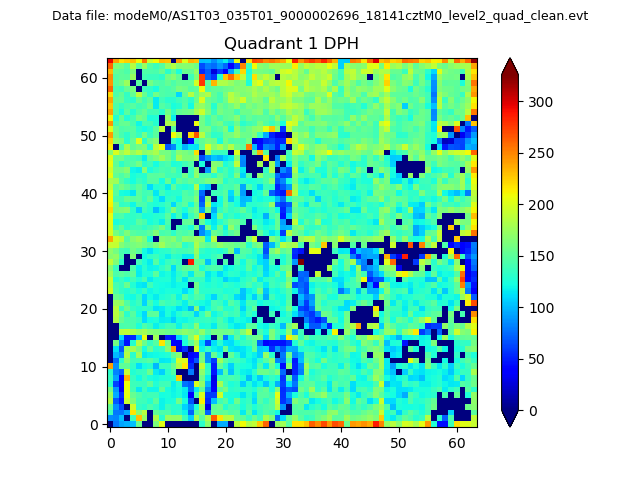 |
Quadrant B |
|---|---|---|---|
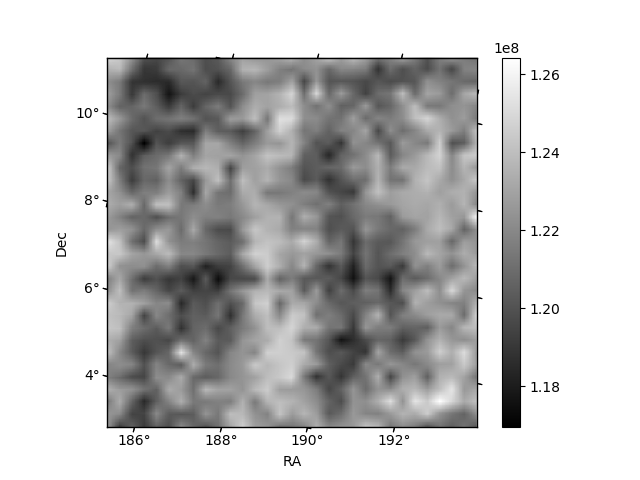
| Quadrant D | 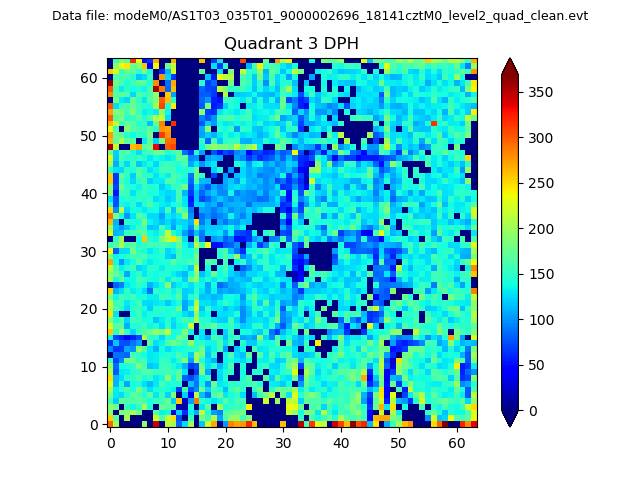 |
 |
Quadrant C |
| Plot type | Count rate plots | Images |
|---|---|---|
| Comparison with Poisson distribution Blue bars denote a histogram of data divided into 1 sec bins. Red curve is a Poisson curve with rate = median count rate of data. |
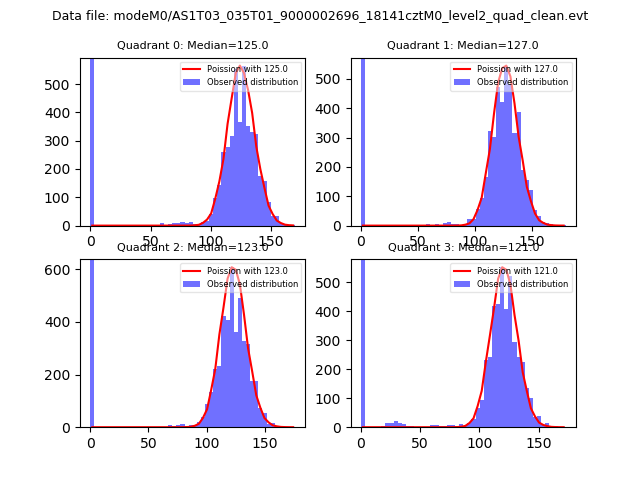 |
 |
| Quadrant-wise count rates Data is divided into 100 sec bins |
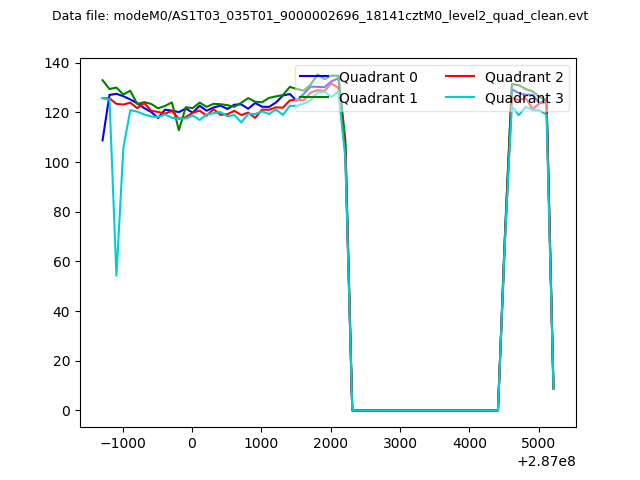 |
|
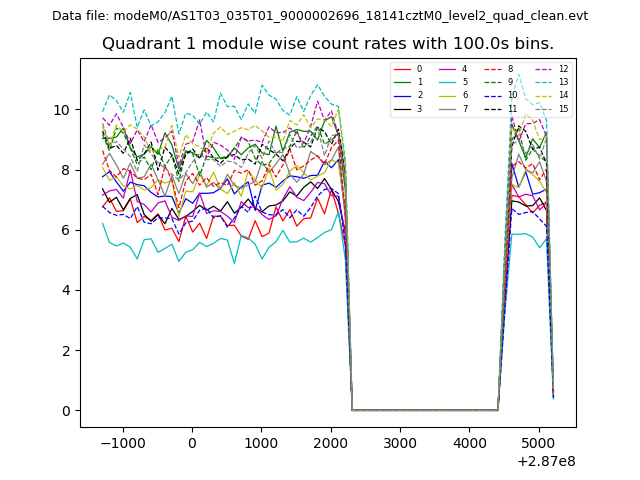
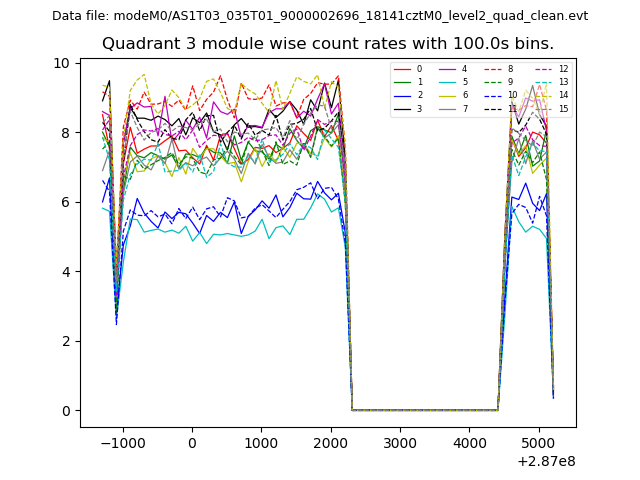
| Module-wise count rates for Quadrant A Data is divided into 100 sec bins |
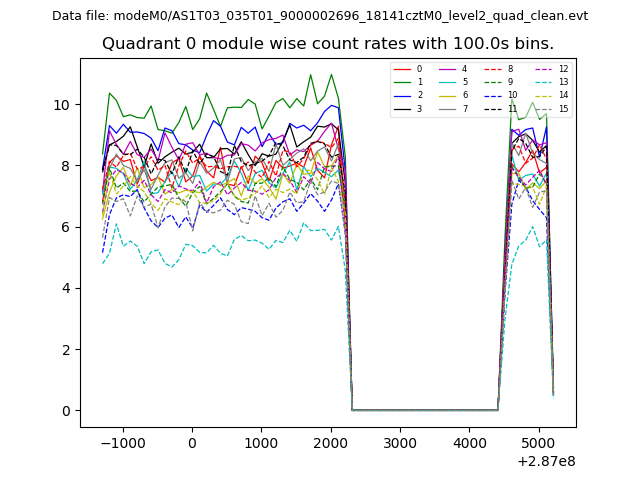 |
 |
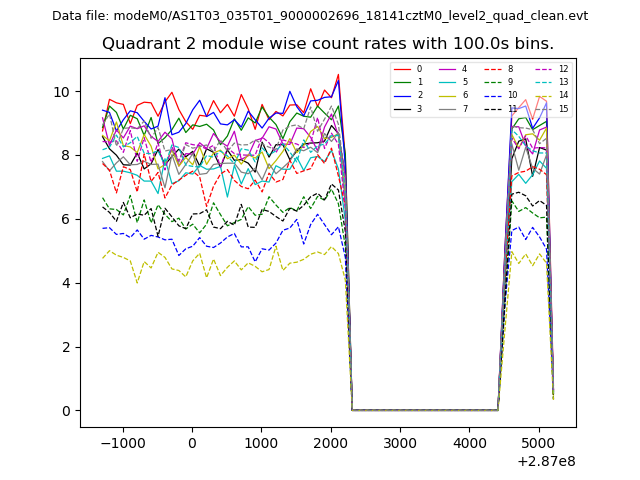
| Module-wise count rates for Quadrant B Data is divided into 100 sec bins |
 |
 |
| Module-wise count rates for Quadrant C Data is divided into 100 sec bins |
 |
 |
| Module-wise count rates for Quadrant D Data is divided into 100 sec bins |
 |
 |
| Parameter | Plot |
|---|---|
| CZT HV Monitor | 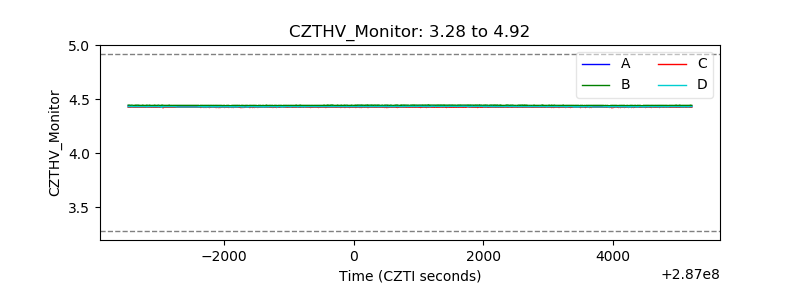 |
| D_VDD | 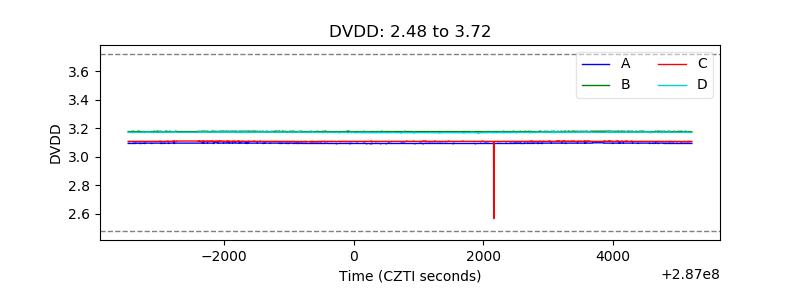 |
| Temperature 1 | 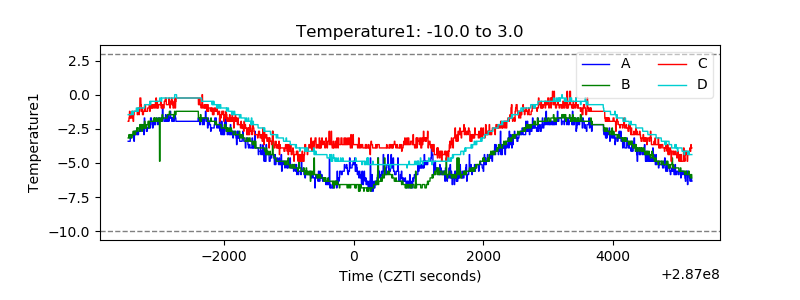 |
| Veto HV Monitor | 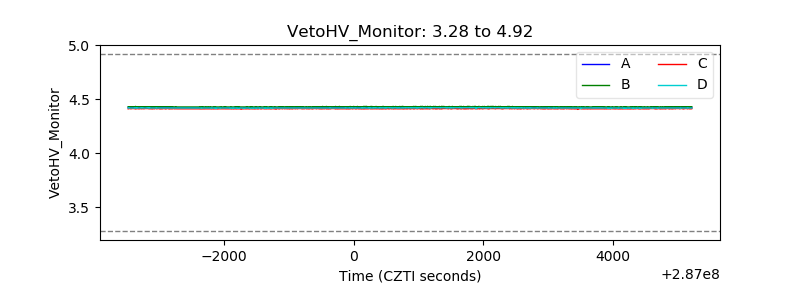 |
| Veto LLD | 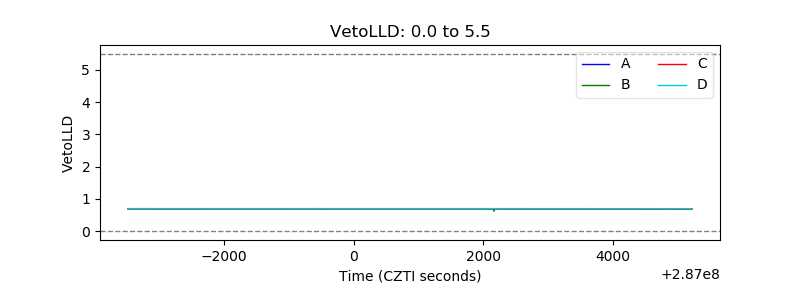 |
| Alpha Counter | 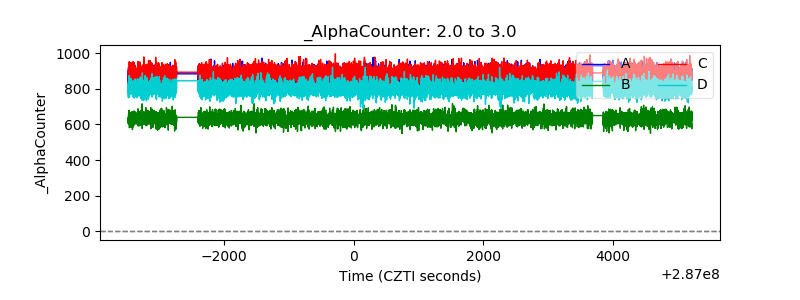 |
| _CPM_Rate | 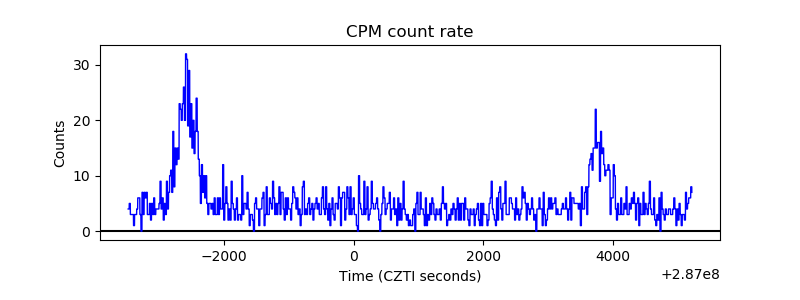 |
| CZT Counter | 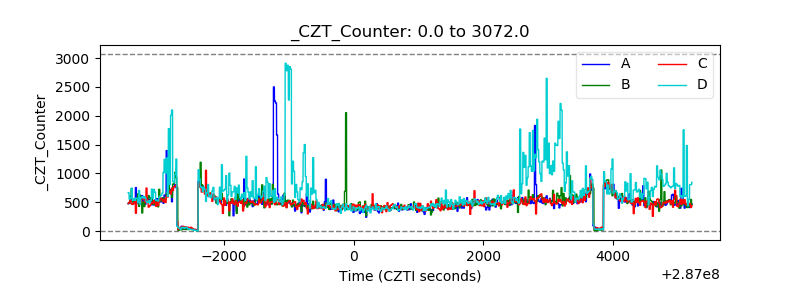 |
| +2.5 Volts monitor | 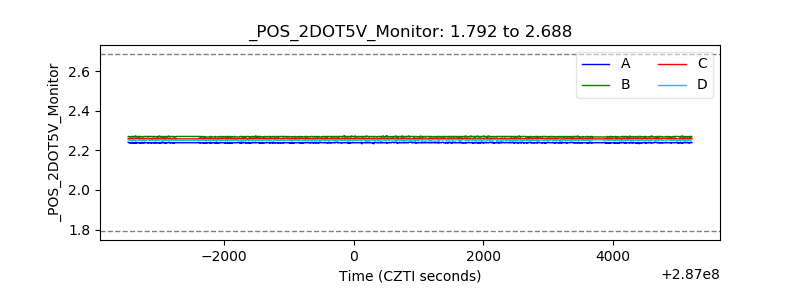 |
| +5 Volts monitor | 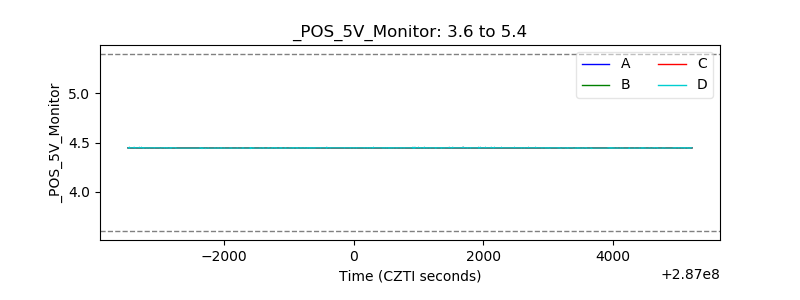 |
| _ROLL_ROT | 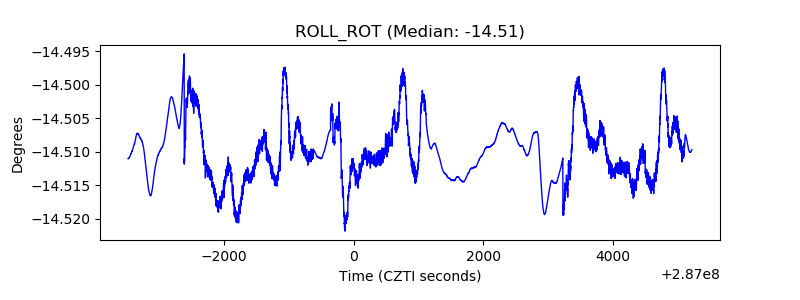 |
| _Roll_DEC | 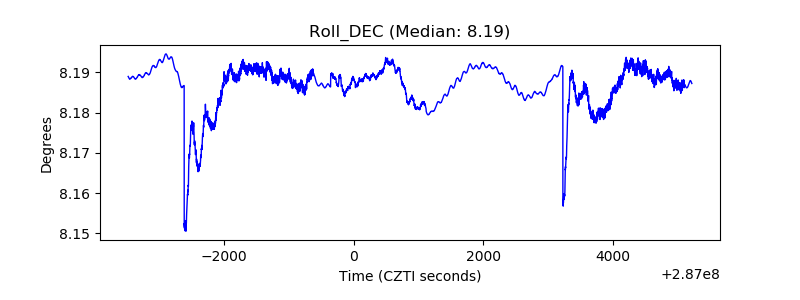 |
| _Roll_RA | 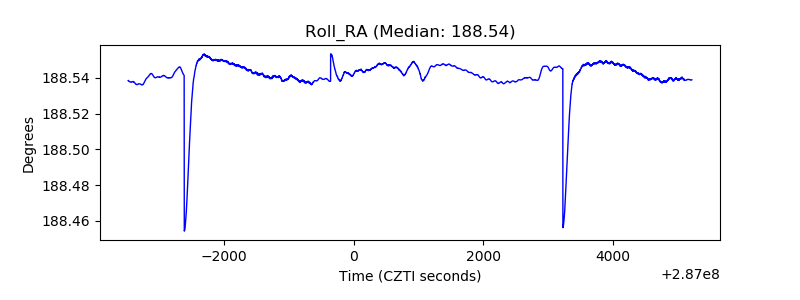 |
| Veto Counter |  |