| Param | Original file | Final file |
|---|---|---|
| Filename | modeM0/AS1T03_035T01_9000002696_18142cztM0_level2.evt | modeM0/AS1T03_035T01_9000002696_18142cztM0_level2_quad_clean.evt |
| Size (bytes) | 165,533,760 | 15,747,840 |
| Size | 157.9 MB | 15.0 MB |
| Events in quadrant A | 1,073,315 | 83,919 |
| Events in quadrant B | 1,132,085 | 85,103 |
| Events in quadrant C | 1,068,077 | 82,289 |
| Events in quadrant D | 1,603,011 | 80,887 |
| Mode M9 | |||
|---|---|---|---|
| Quadrant | BADHDUFLAG | Total packets | Discarded packets |
| A | 0 | 2 | 0 |
| B | 0 | 2 | 0 |
| C | 0 | 2 | 0 |
| D | 0 | 2 | 0 |
| Mode M0 | |||
|---|---|---|---|
| Quadrant | BADHDUFLAG | Total packets | Discarded packets |
| A | 0 | 4368 | 1 |
| B | 0 | 4564 | 1 |
| C | 0 | 4336 | 1 |
| D | 0 | 6161 | 1 |
| Mode SS | |||
|---|---|---|---|
| Quadrant | BADHDUFLAG | Total packets | Discarded packets |
| A | 0 | 42 | 0 |
| B | 0 | 42 | 0 |
| C | 0 | 42 | 0 |
| D | 0 | 42 | 0 |
| Quadrant | Total seconds | Saturated seconds | Saturation percentage |
|---|---|---|---|
| A | 1976 | 53 | 2.682186% |
| B | 1977 | 96 | 4.855842% |
| C | 1977 | 93 | 4.704097% |
| D | 1977 | 83 | 4.198280% |
Noise dominated data is calculated using 1-second bins in cleaned event files. If a bin has >2000 counts, and if more than 50% of those come from <1% of pixels, then it is considered to be noise-dominated and hence unusable.
| Quadrant | # 1 sec bins | Bins with >0 counts | Bins with >2000 counts | High rate bins dominated by noise | Noise dominated (total time) | Noise dominated (detector-on time) | Marked lightcurve |
|---|---|---|---|---|---|---|---|
| A | 2141 | 1977 | 0 | 0 | 0.00% | 0.00% | 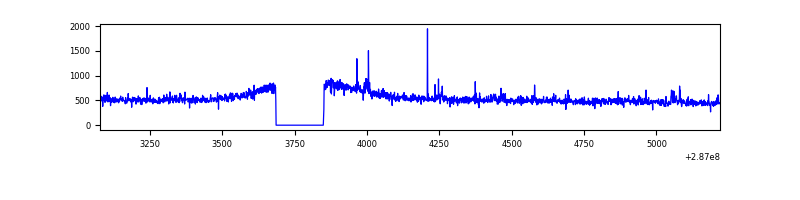 |
| B | 2142 | 1978 | 1 | 1 | 0.05% | 0.05% | 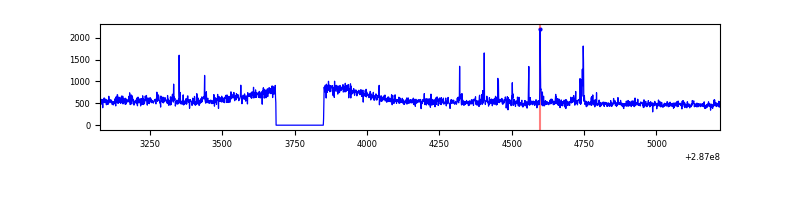 |
| C | 2142 | 1978 | 0 | 0 | 0.00% | 0.00% | 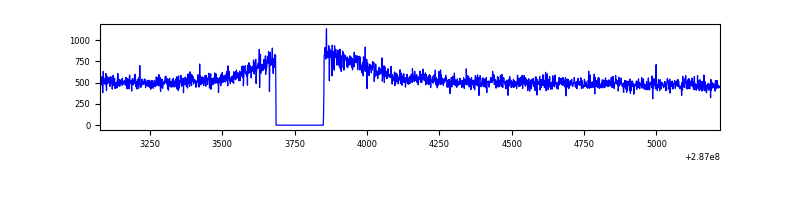 |
| D | 2142 | 1978 | 34 | 34 | 1.59% | 1.72% | 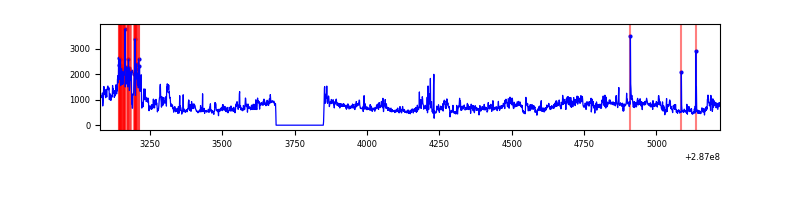 |
Top three noisy pixels from each quadrant. If the there are fewer than three noisy pixels in the level2.evt file, extra rows are filled as -1
| Pixel properties | Quadrant properties | ||||||
|---|---|---|---|---|---|---|---|
| Quadrant | DetID | PixID | Counts | Sigma | Mean | Median | Sigma |
| A | 4 | 2 | 15651 | 263.23 | 273 | 266 | 58.4 |
| A | 15 | 174 | 5376 | 87.43 | 273 | 266 | 58.4 |
| A | 0 | 226 | 2455 | 37.45 | 273 | 266 | 58.4 |
| B | 0 | 189 | 15884 | 282.73 | 274 | 267 | 55.2 |
| B | 0 | 197 | 13506 | 239.68 | 274 | 267 | 55.2 |
| B | 7 | 220 | 10621 | 187.45 | 274 | 267 | 55.2 |
| C | 14 | 238 | 39312 | 616.46 | 260 | 261 | 63.3 |
| C | 3 | 233 | 10615 | 163.45 | 260 | 261 | 63.3 |
| C | 13 | 61 | 1802 | 24.33 | 260 | 261 | 63.3 |
| D | 7 | 238 | 458538 | 6708.89 | 264 | 255 | 68.3 |
| D | 12 | 110 | 80949 | 1181.29 | 264 | 255 | 68.3 |
| D | 13 | 104 | 36818 | 535.25 | 264 | 255 | 68.3 |
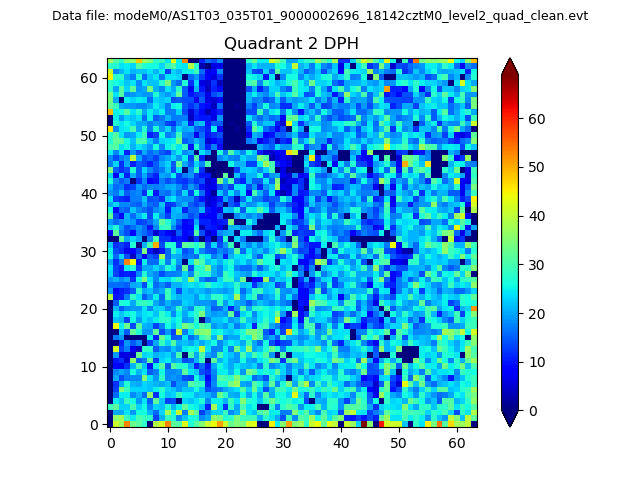
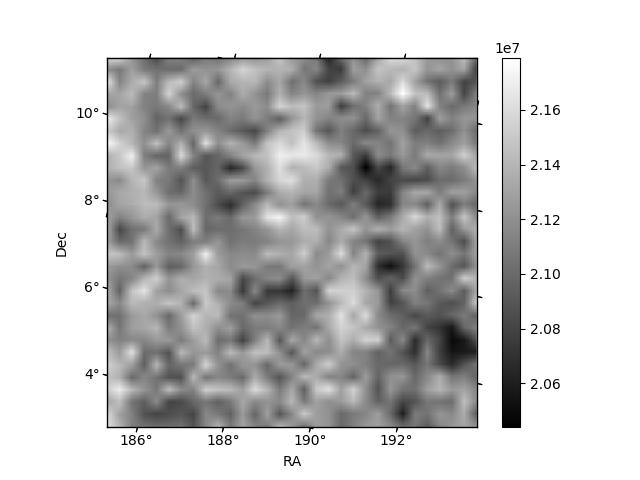
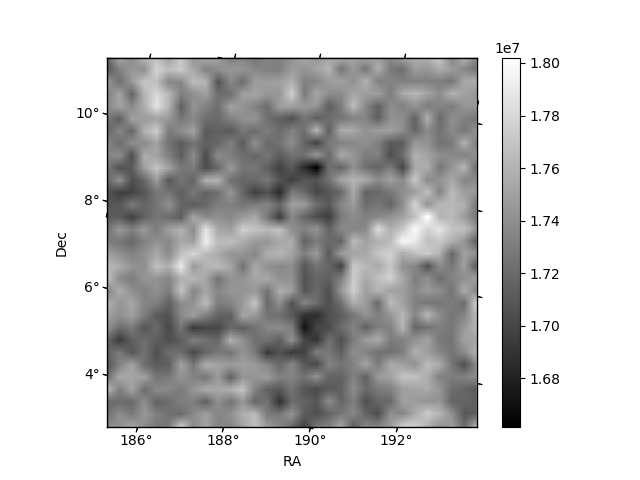
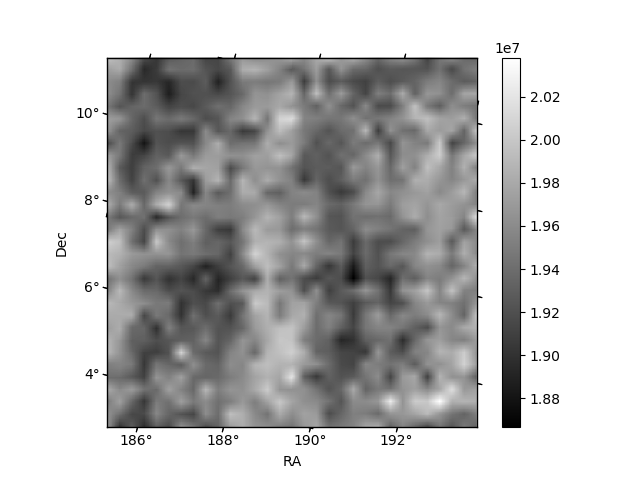
Histogram calculated using DETX and DETY for each event in the final _common_clean file
| Quadrant A | 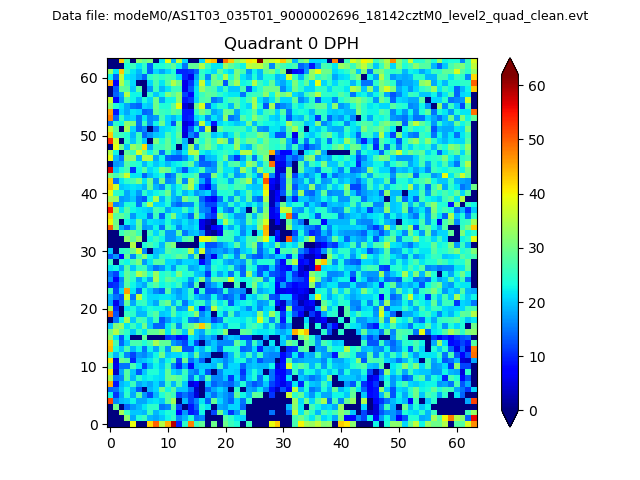 |
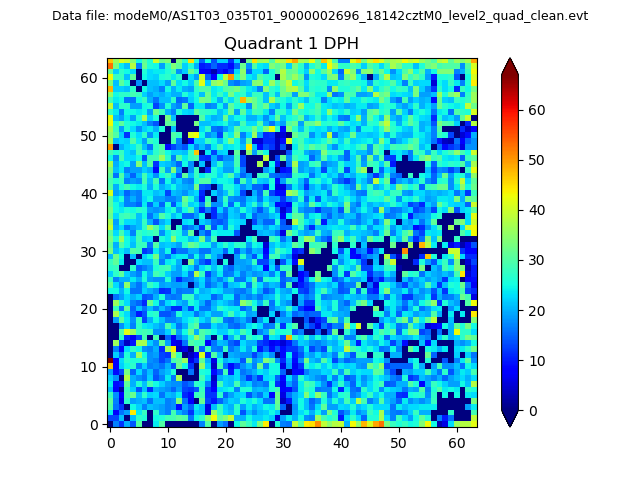 |
Quadrant B |
|---|---|---|---|
| Quadrant D | 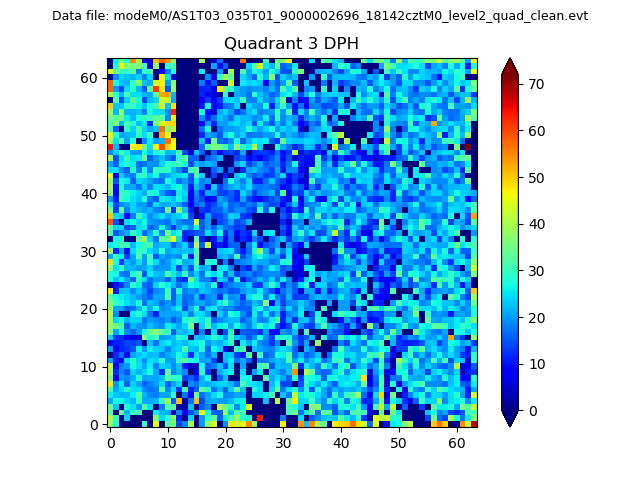 |
 |
Quadrant C |
| Plot type | Count rate plots | Images |
|---|---|---|
| Comparison with Poisson distribution Blue bars denote a histogram of data divided into 1 sec bins. Red curve is a Poisson curve with rate = median count rate of data. |
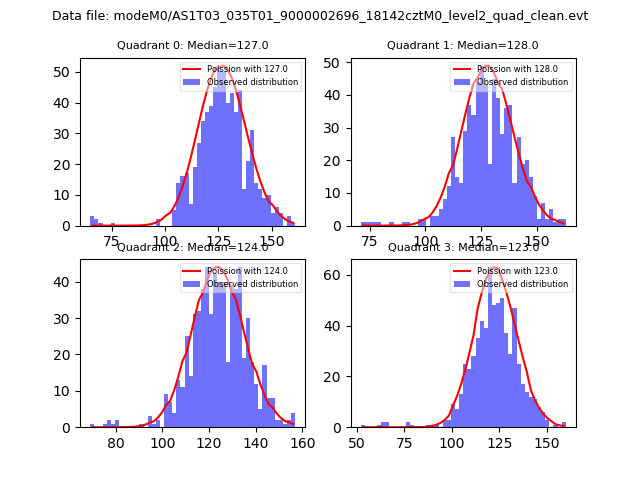 |
 |
| Quadrant-wise count rates Data is divided into 100 sec bins |
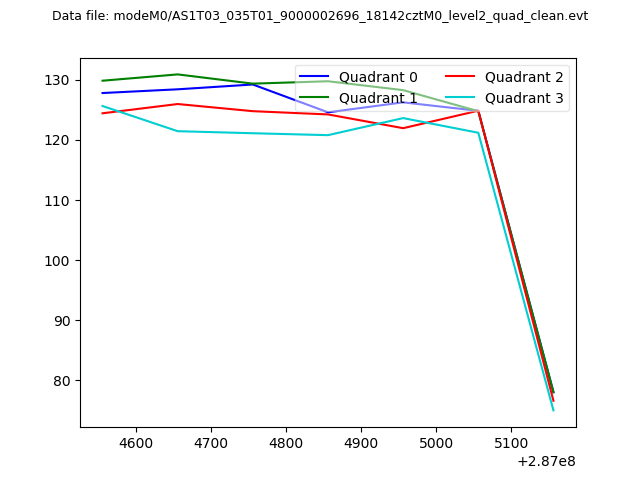 |
|
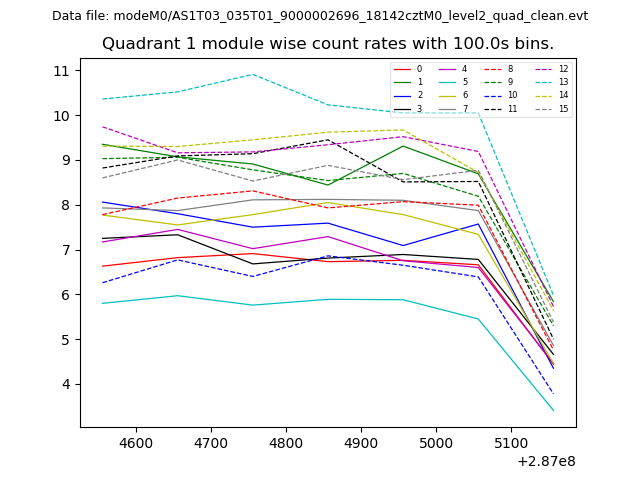
| Module-wise count rates for Quadrant A Data is divided into 100 sec bins |
 |
 |
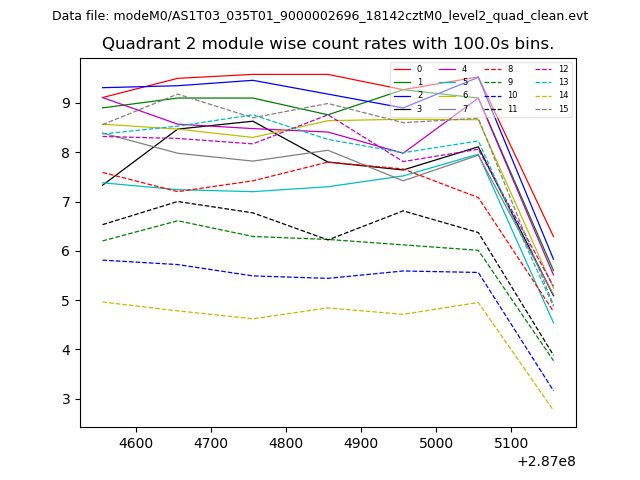
| Module-wise count rates for Quadrant B Data is divided into 100 sec bins |
 |
 |
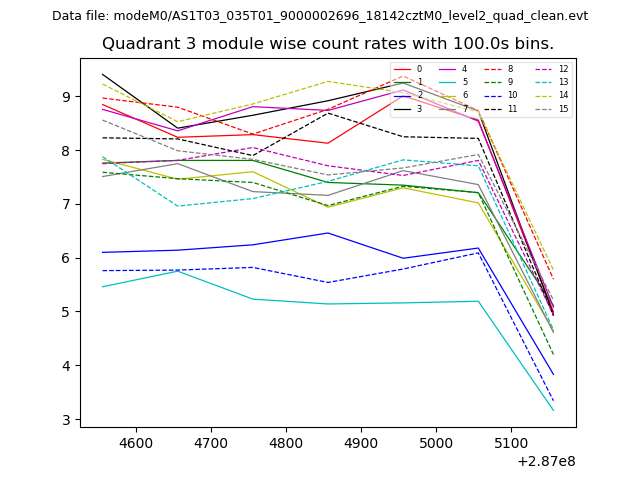
| Module-wise count rates for Quadrant C Data is divided into 100 sec bins |
 |
 |
| Module-wise count rates for Quadrant D Data is divided into 100 sec bins |
 |
 |
| Parameter | Plot |
|---|---|
| CZT HV Monitor | 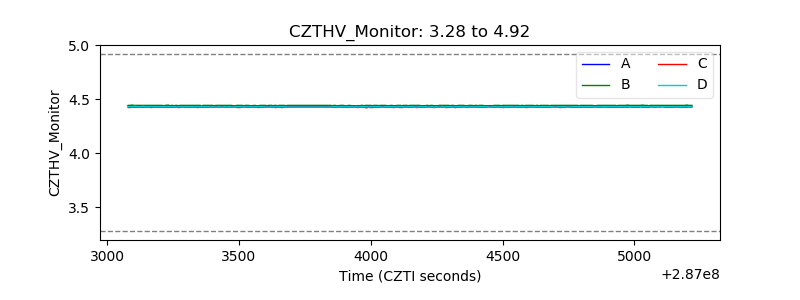 |
| D_VDD | 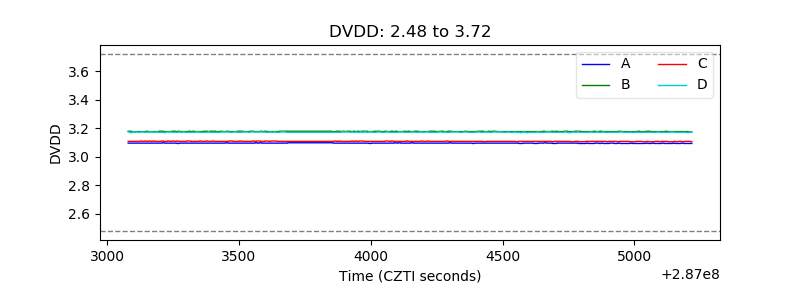 |
| Temperature 1 | 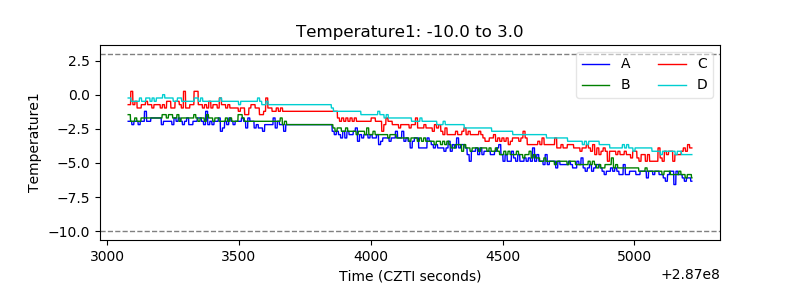 |
| Veto HV Monitor | 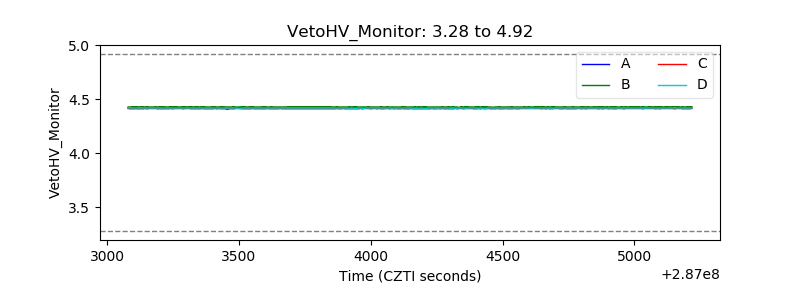 |
| Veto LLD | 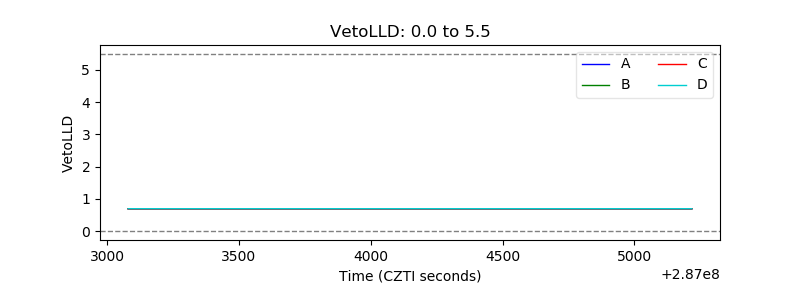 |
| Alpha Counter | 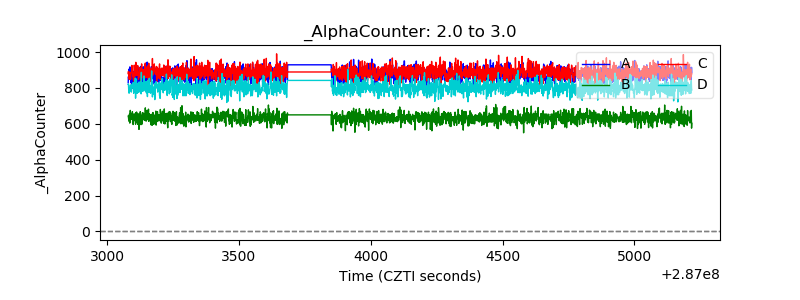 |
| _CPM_Rate | 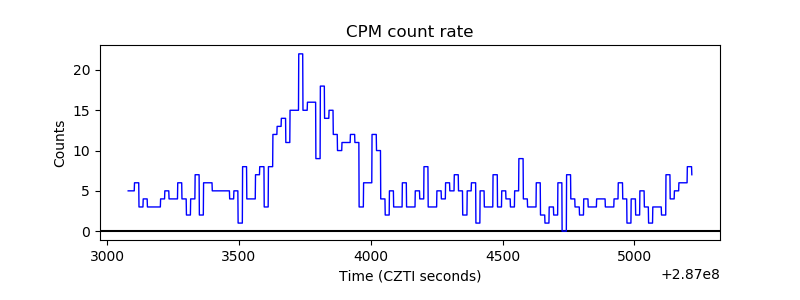 |
| CZT Counter | 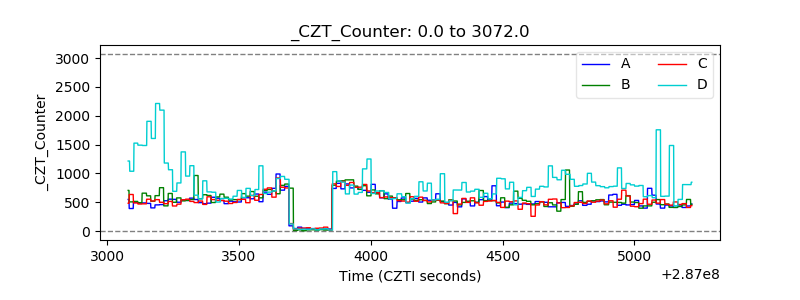 |
| +2.5 Volts monitor |  |
| +5 Volts monitor |  |
| _ROLL_ROT |  |
| _Roll_DEC | 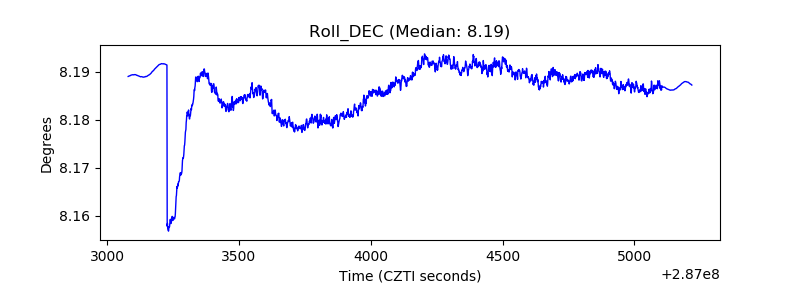 |
| _Roll_RA | 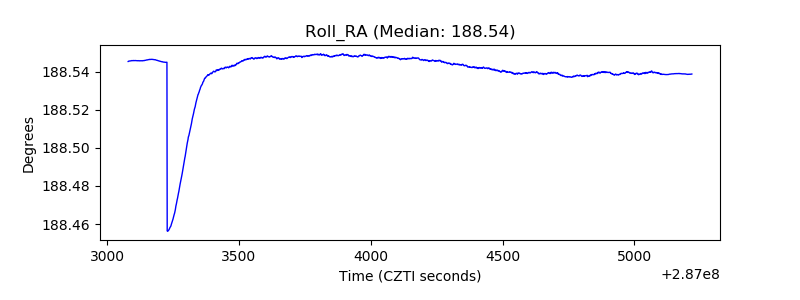 |
| Veto Counter | 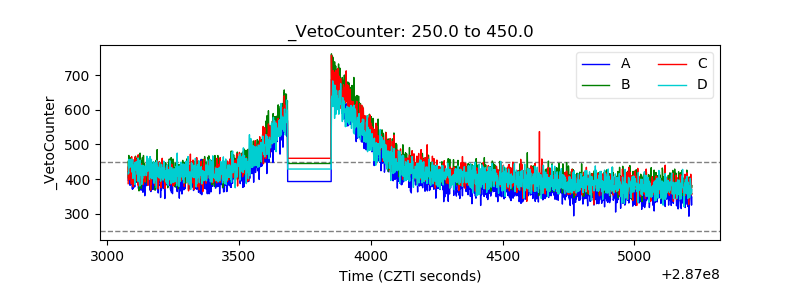 |