| Param | Original file | Final file |
|---|---|---|
| Filename | modeM0/AS1A05_103T01_9000002700cztM0_level2.fits | modeM0/AS1A05_103T01_9000002700cztM0_level2_quad_clean.evt |
| Size (bytes) | 196,329,600 | 144,789,120 |
| Size | 187.2 MB | 138.1 MB |
| Events in quadrant A | 1,247,234 | 813,028 |
| Events in quadrant B | 1,178,586 | 812,901 |
| Events in quadrant C | 1,214,542 | 780,680 |
| Events in quadrant D | 1,048,422 | 720,122 |
| Mode M9 | |||
|---|---|---|---|
| Quadrant | BADHDUFLAG | Total packets | Discarded packets |
| A | 0 | 50 | 0 |
| B | 0 | 50 | 0 |
| C | 0 | 50 | 0 |
| D | 0 | 50 | 0 |
| Mode M0 | |||
|---|---|---|---|
| Quadrant | BADHDUFLAG | Total packets | Discarded packets |
| A | 0 | 40256 | 0 |
| B | 0 | 40183 | 0 |
| C | 0 | 39211 | 0 |
| D | 0 | 54597 | 0 |
| Mode SS | |||
|---|---|---|---|
| Quadrant | BADHDUFLAG | Total packets | Discarded packets |
| A | 0 | 370 | 0 |
| B | 0 | 370 | 0 |
| C | 0 | 370 | 0 |
| D | 0 | 370 | 0 |
| Quadrant | Total seconds | Saturated seconds | Saturation percentage |
|---|---|---|---|
| A | 18249 | 387 | 2.120664% |
| B | 18249 | 357 | 1.956272% |
| C | 18249 | 374 | 2.049427% |
| D | 18249 | 1113 | 6.098964% |
Noise dominated data is calculated using 1-second bins in cleaned event files. If a bin has >2000 counts, and if more than 50% of those come from <1% of pixels, then it is considered to be noise-dominated and hence unusable.
| Quadrant | # 1 sec bins | Bins with >0 counts | Bins with >2000 counts | High rate bins dominated by noise | Noise dominated (total time) | Noise dominated (detector-on time) | Marked lightcurve |
|---|---|---|---|---|---|---|---|
| A | 23174 | 18248 | 0 | 0 | 0.00% | 0.00% |  |
| B | 23174 | 18250 | 0 | 0 | 0.00% | 0.00% | 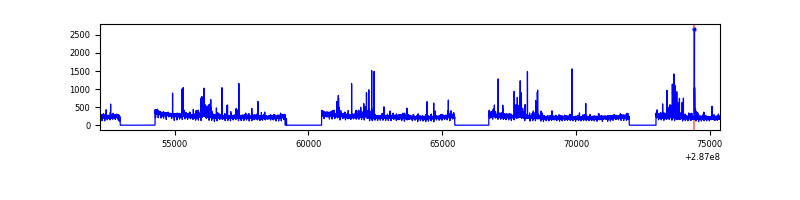 |
| C | 23174 | 18249 | 0 | 0 | 0.00% | 0.00% |  |
| D | 23174 | 18248 | 0 | 0 | 0.00% | 0.00% |  |
Top three noisy pixels from each quadrant. If the there are fewer than three noisy pixels in the level2.evt file, extra rows are filled as -1
| Pixel properties | Quadrant properties | ||||||
|---|---|---|---|---|---|---|---|
| Quadrant | DetID | PixID | Counts | Sigma | Mean | Median | Sigma |
| A | 0 | 29 | 1108 | 9.96 | 324 | 307 | 80.5 |
| A | 7 | 110 | 956 | 8.07 | 324 | 307 | 80.5 |
| A | 9 | 19 | 942 | 7.89 | 324 | 307 | 80.5 |
| B | 2 | 9 | 892 | 9.27 | 312 | 299 | 64.0 |
| B | 5 | 128 | 779 | 7.51 | 312 | 299 | 64.0 |
| B | 5 | 225 | 766 | 7.3 | 312 | 299 | 64.0 |
| C | 1 | 81 | 871 | 6.96 | 320 | 302 | 81.8 |
| C | 1 | 80 | 853 | 6.74 | 320 | 302 | 81.8 |
| C | 12 | 241 | 829 | 6.45 | 320 | 302 | 81.8 |
| D | 10 | 190 | 799 | 6.56 | 299 | 274 | 80.0 |
| D | 6 | 67 | 768 | 6.17 | 299 | 274 | 80.0 |
| D | 6 | 231 | 760 | 6.07 | 299 | 274 | 80.0 |
Histogram calculated using DETX and DETY for each event in the final _common_clean file
| Quadrant A |  |
 |
Quadrant B |
|---|---|---|---|
| Quadrant D |  |
 |
Quadrant C |
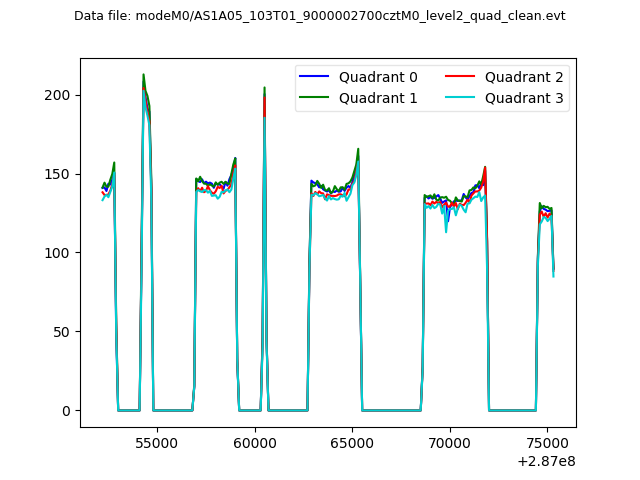
| Plot type | Count rate plots | Images |
|---|---|---|
| Comparison with Poisson distribution Blue bars denote a histogram of data divided into 1 sec bins. Red curve is a Poisson curve with rate = median count rate of data. |
 |
 |
| Quadrant-wise count rates Data is divided into 100 sec bins |
 |
|
| Module-wise count rates for Quadrant A Data is divided into 100 sec bins |
 |
 |
| Module-wise count rates for Quadrant B Data is divided into 100 sec bins |
 |
 |
| Module-wise count rates for Quadrant C Data is divided into 100 sec bins |
 |
 |
| Module-wise count rates for Quadrant D Data is divided into 100 sec bins |
 |
 |
| Parameter | Plot |
|---|---|
| CZT HV Monitor |  |
| D_VDD | 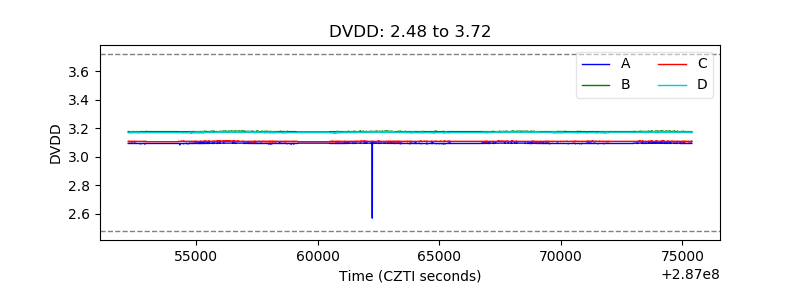 |
| Temperature 1 |  |
| Veto HV Monitor |  |
| Veto LLD |  |
| Alpha Counter |  |
| _CPM_Rate |  |
| CZT Counter |  |
| +2.5 Volts monitor |  |
| +5 Volts monitor | 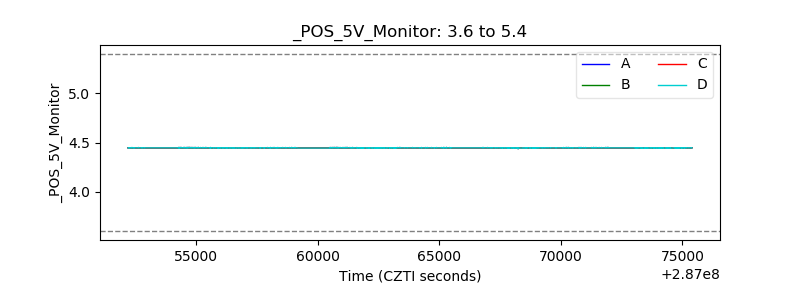 |
| _ROLL_ROT |  |
| _Roll_DEC | 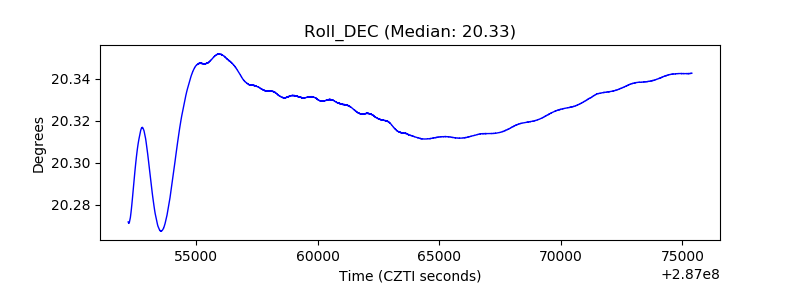 |
| _Roll_RA | 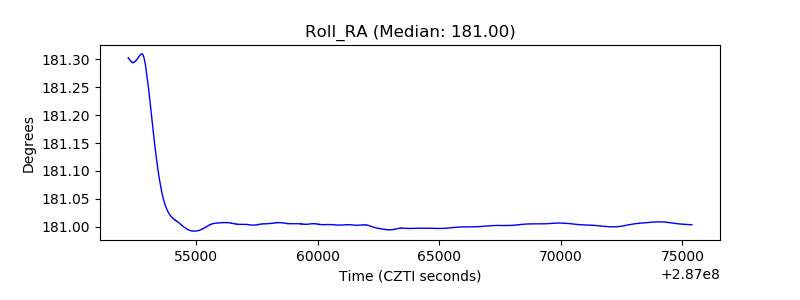 |
| Veto Counter |  |