| Param | Original file | Final file |
|---|---|---|
| Filename | modeM0/AS1A05_103T01_9000002700_18150cztM0_level2.evt | modeM0/AS1A05_103T01_9000002700_18150cztM0_level2_quad_clean.evt |
| Size (bytes) | 176,405,760 | 32,313,600 |
| Size | 168.2 MB | 30.8 MB |
| Events in quadrant A | 1,344,183 | 208,625 |
| Events in quadrant B | 1,214,615 | 213,383 |
| Events in quadrant C | 1,208,605 | 204,576 |
| Events in quadrant D | 1,431,699 | 200,723 |
| Mode M9 | |||
|---|---|---|---|
| Quadrant | BADHDUFLAG | Total packets | Discarded packets |
| A | 0 | 13 | 0 |
| B | 0 | 13 | 0 |
| C | 0 | 13 | 0 |
| D | 0 | 13 | 0 |
| Mode M0 | |||
|---|---|---|---|
| Quadrant | BADHDUFLAG | Total packets | Discarded packets |
| A | 0 | 5473 | 1 |
| B | 0 | 4967 | 1 |
| C | 0 | 4958 | 1 |
| D | 0 | 5679 | 2 |
| Mode SS | |||
|---|---|---|---|
| Quadrant | BADHDUFLAG | Total packets | Discarded packets |
| A | 0 | 44 | 0 |
| B | 0 | 44 | 0 |
| C | 0 | 44 | 0 |
| D | 0 | 44 | 0 |
| Quadrant | Total seconds | Saturated seconds | Saturation percentage |
|---|---|---|---|
| A | 2076 | 102 | 4.913295% |
| B | 2076 | 83 | 3.998073% |
| C | 2076 | 93 | 4.479769% |
| D | 2075 | 121 | 5.831325% |
Noise dominated data is calculated using 1-second bins in cleaned event files. If a bin has >2000 counts, and if more than 50% of those come from <1% of pixels, then it is considered to be noise-dominated and hence unusable.
| Quadrant | # 1 sec bins | Bins with >0 counts | Bins with >2000 counts | High rate bins dominated by noise | Noise dominated (total time) | Noise dominated (detector-on time) | Marked lightcurve |
|---|---|---|---|---|---|---|---|
| A | 3381 | 2076 | 3 | 3 | 0.09% | 0.14% | 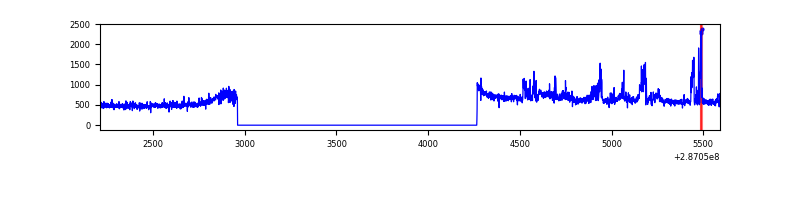 |
| B | 3381 | 2077 | 0 | 0 | 0.00% | 0.00% | 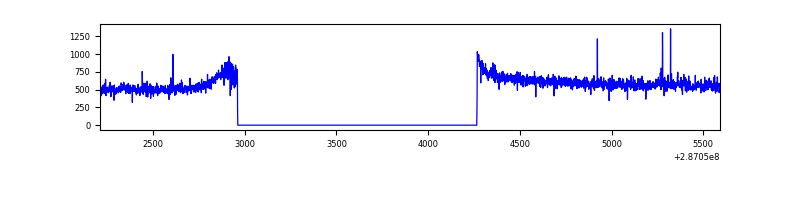 |
| C | 3381 | 2077 | 0 | 0 | 0.00% | 0.00% | 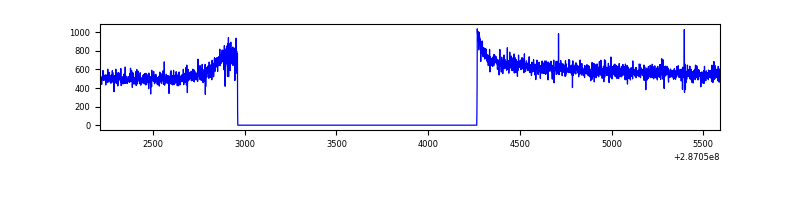 |
| D | 3380 | 2075 | 37 | 37 | 1.09% | 1.78% | 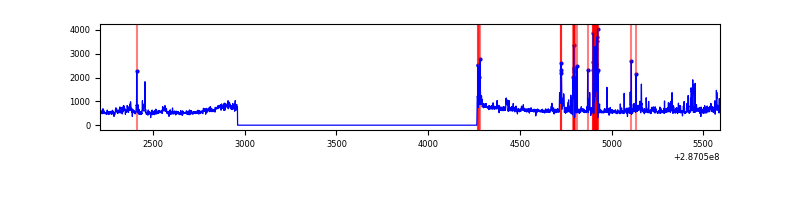 |
Top three noisy pixels from each quadrant. If the there are fewer than three noisy pixels in the level2.evt file, extra rows are filled as -1
| Pixel properties | Quadrant properties | ||||||
|---|---|---|---|---|---|---|---|
| Quadrant | DetID | PixID | Counts | Sigma | Mean | Median | Sigma |
| A | 15 | 174 | 138127 | 2172.26 | 313 | 308 | 63.4 |
| A | 0 | 226 | 2797 | 39.23 | 313 | 308 | 63.4 |
| A | 12 | 194 | 2347 | 32.14 | 313 | 308 | 63.4 |
| B | 12 | 111 | 6748 | 109.17 | 306 | 300 | 59.1 |
| B | 10 | 247 | 5773 | 92.67 | 306 | 300 | 59.1 |
| B | 11 | 111 | 5733 | 91.99 | 306 | 300 | 59.1 |
| C | 14 | 238 | 46365 | 658.19 | 297 | 298 | 70.0 |
| C | 3 | 233 | 3229 | 41.88 | 297 | 298 | 70.0 |
| C | 13 | 61 | 2203 | 27.22 | 297 | 298 | 70.0 |
| D | 10 | 70 | 107183 | 1448.47 | 301 | 293 | 73.8 |
| D | 7 | 238 | 71241 | 961.42 | 301 | 293 | 73.8 |
| D | 13 | 187 | 37941 | 510.17 | 301 | 293 | 73.8 |
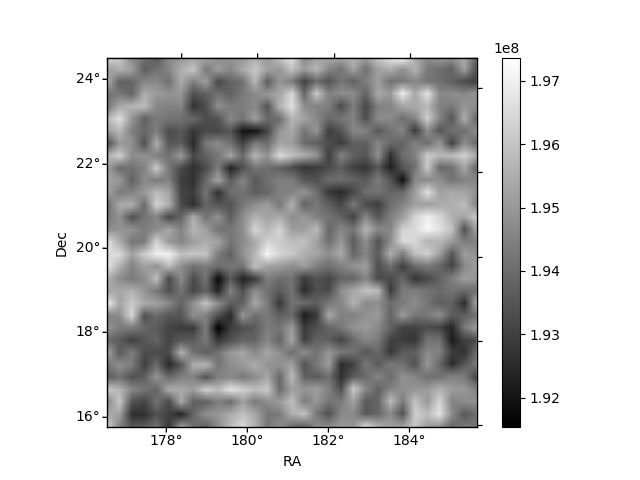
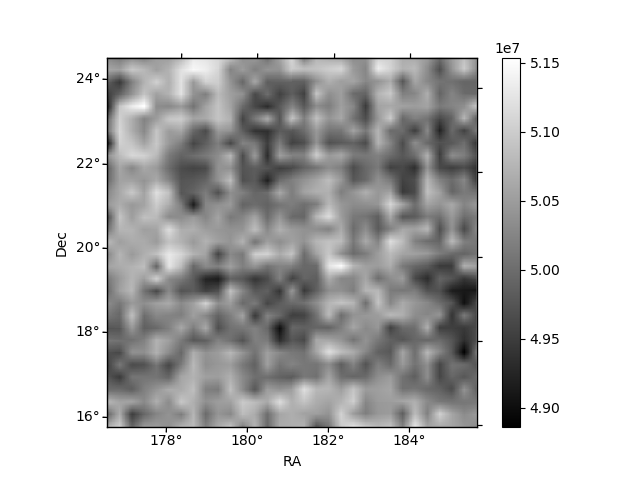
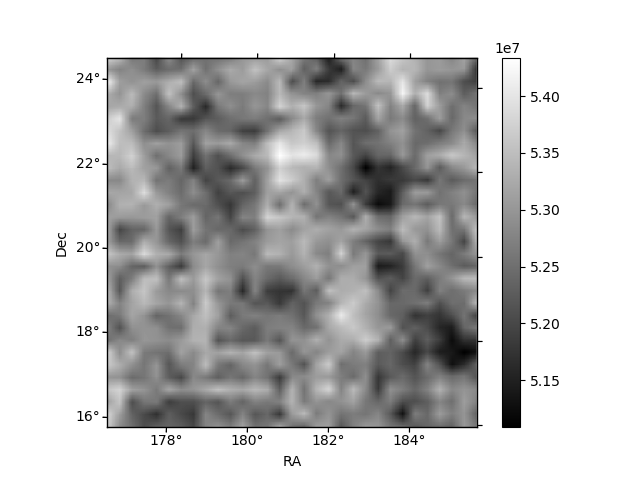
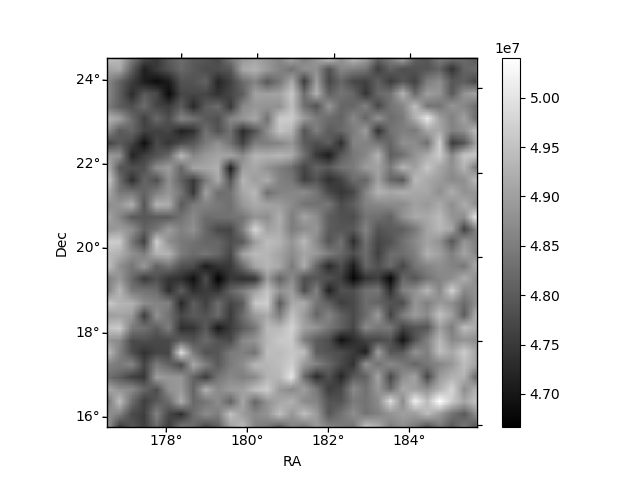
Histogram calculated using DETX and DETY for each event in the final _common_clean file
| Quadrant A | 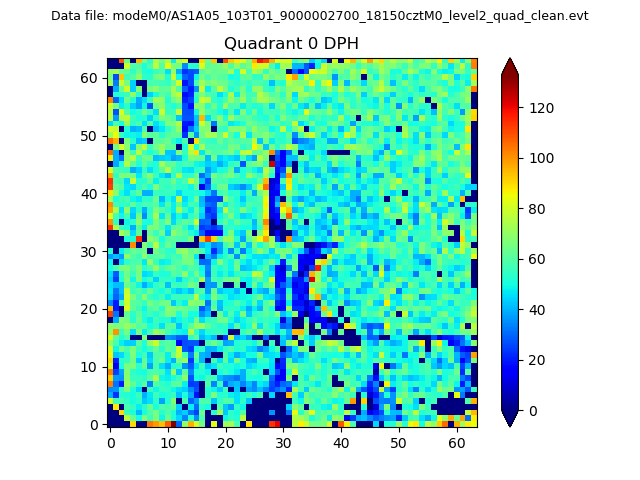 |
 |
Quadrant B |
|---|---|---|---|
| Quadrant D | 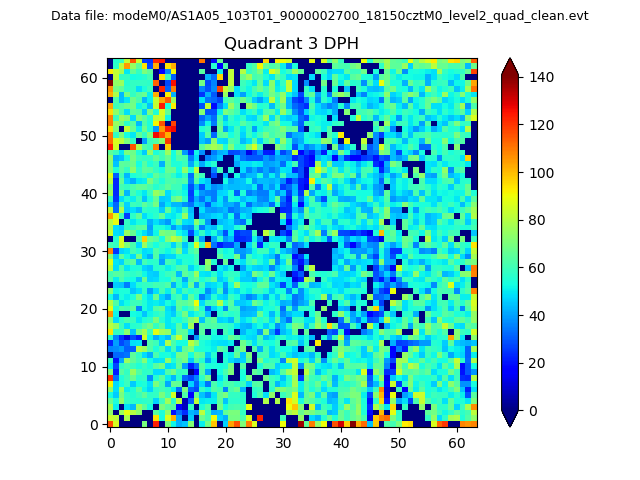 |
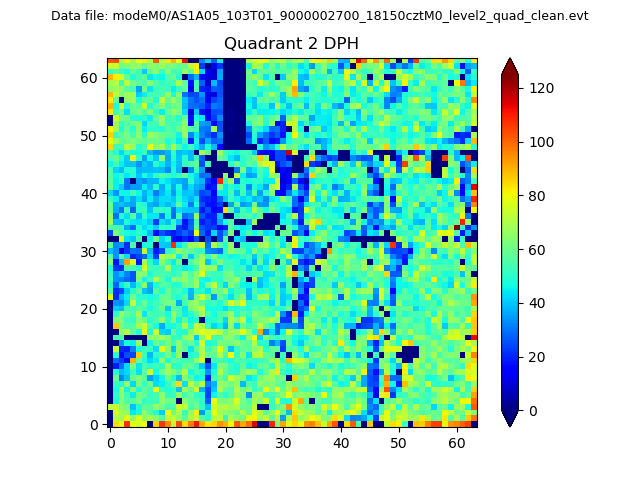 |
Quadrant C |
| Plot type | Count rate plots | Images |
|---|---|---|
| Comparison with Poisson distribution Blue bars denote a histogram of data divided into 1 sec bins. Red curve is a Poisson curve with rate = median count rate of data. |
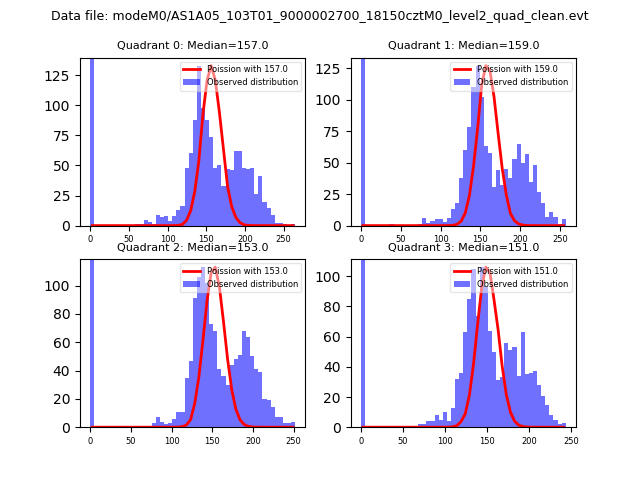 |
 |
| Quadrant-wise count rates Data is divided into 100 sec bins |
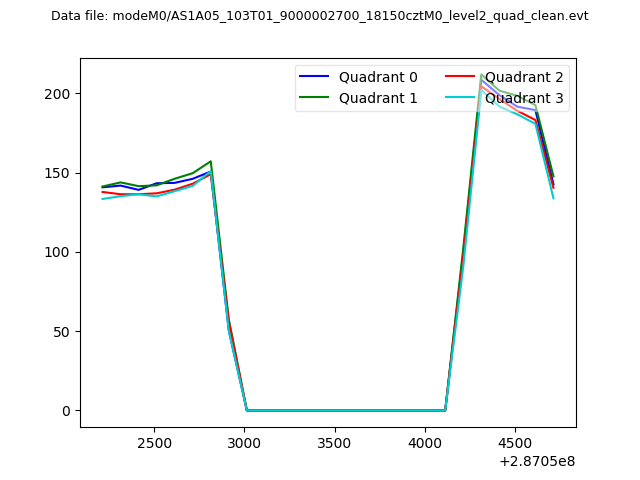 |
|
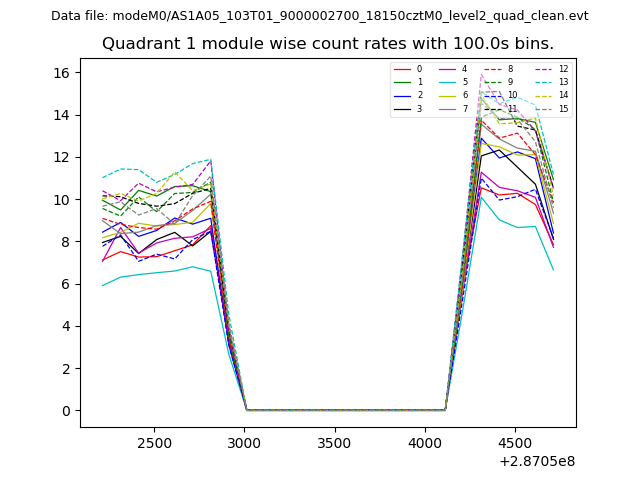
| Module-wise count rates for Quadrant A Data is divided into 100 sec bins |
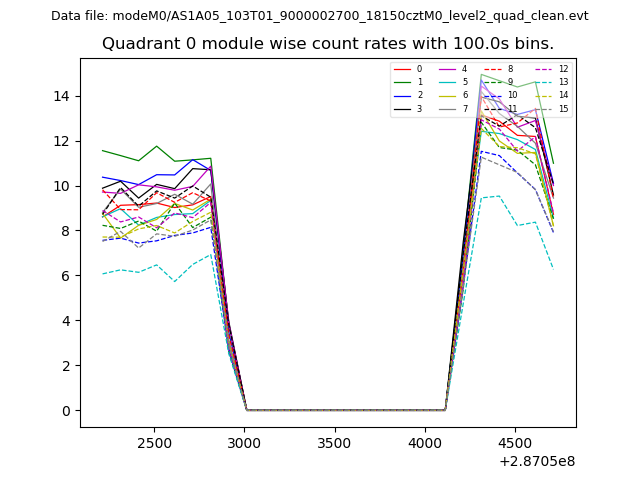 |
 |
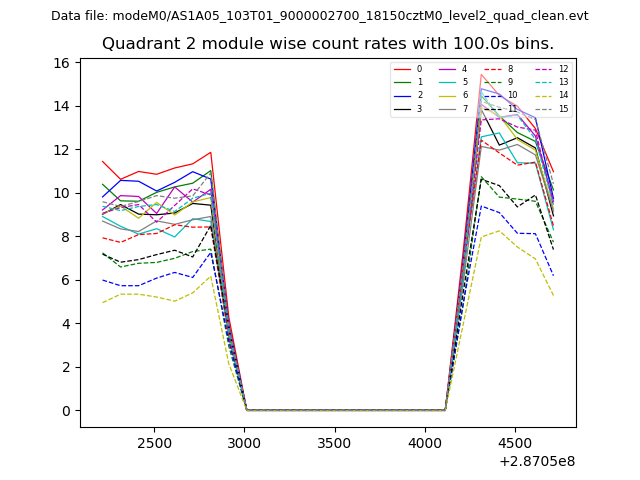
| Module-wise count rates for Quadrant B Data is divided into 100 sec bins |
 |
 |
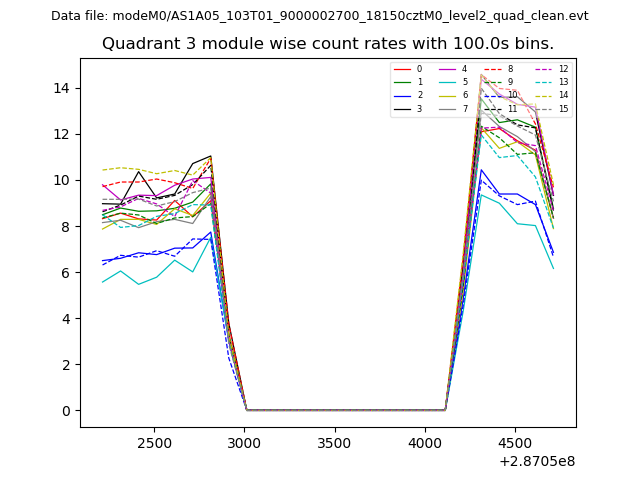
| Module-wise count rates for Quadrant C Data is divided into 100 sec bins |
 |
 |
| Module-wise count rates for Quadrant D Data is divided into 100 sec bins |
 |
 |
| Parameter | Plot |
|---|---|
| CZT HV Monitor | 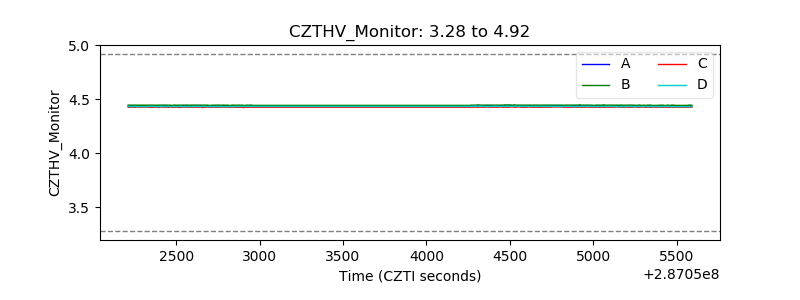 |
| D_VDD | 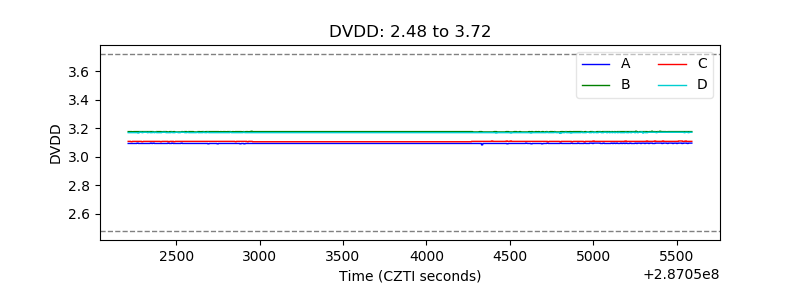 |
| Temperature 1 | 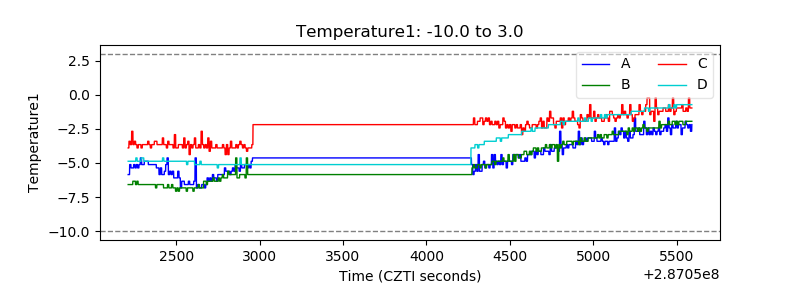 |
| Veto HV Monitor | 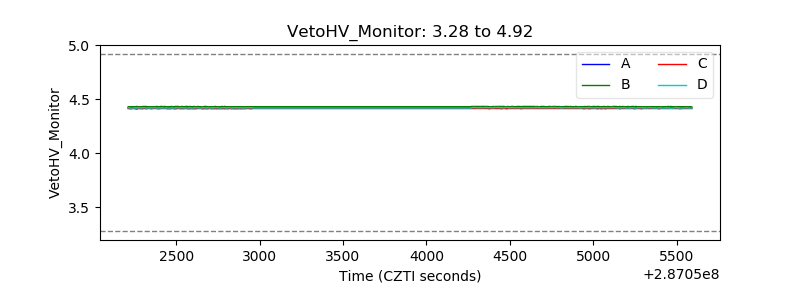 |
| Veto LLD | 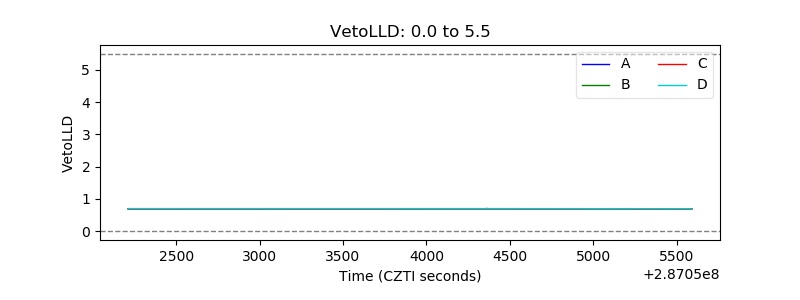 |
| Alpha Counter | 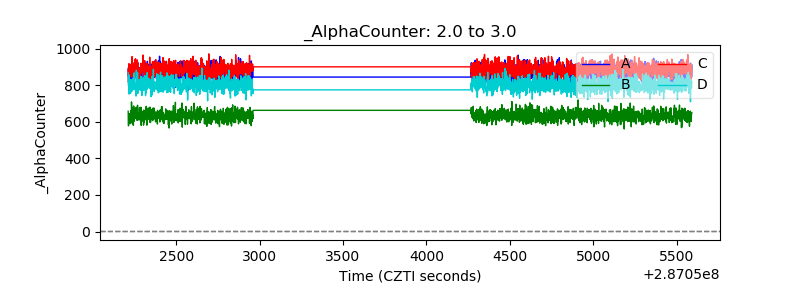 |
| _CPM_Rate | 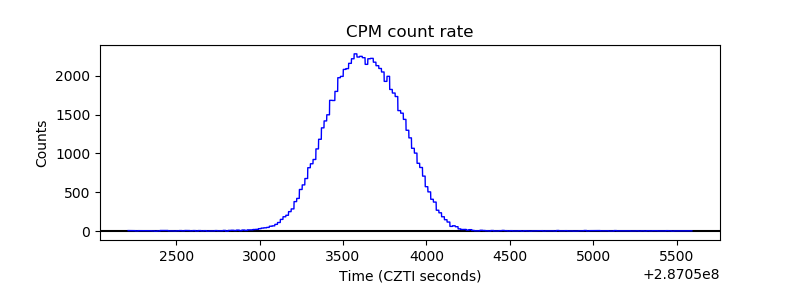 |
| CZT Counter |  |
| +2.5 Volts monitor |  |
| +5 Volts monitor |  |
| _ROLL_ROT | 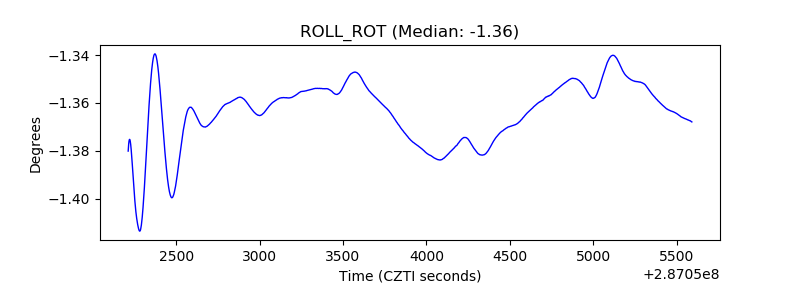 |
| _Roll_DEC | 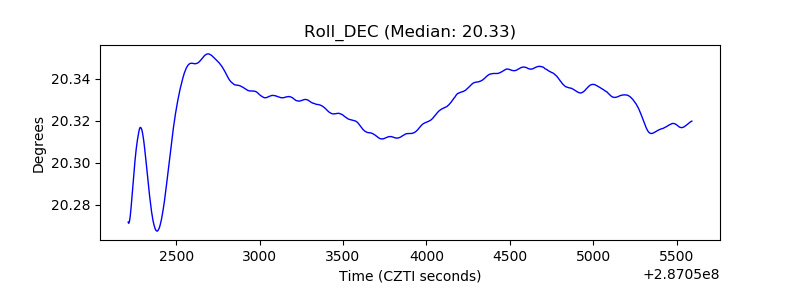 |
| _Roll_RA | 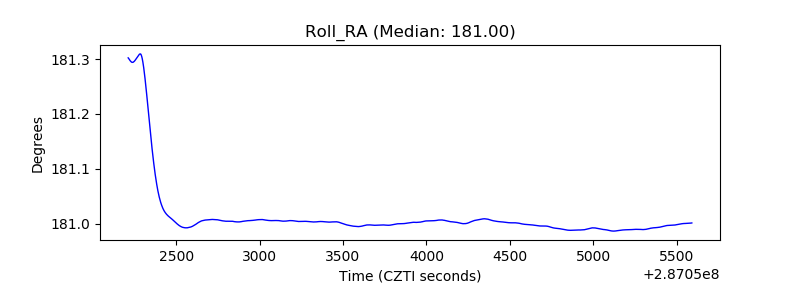 |
| Veto Counter | 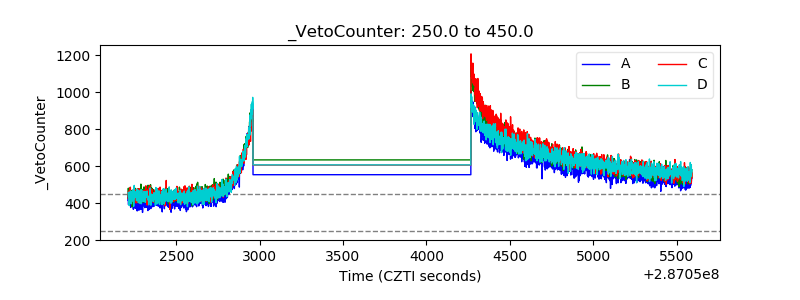 |