| Param | Original file | Final file |
|---|---|---|
| Filename | modeM0/AS1A05_103T01_9000002700_18151cztM0_level2.evt | modeM0/AS1A05_103T01_9000002700_18151cztM0_level2_quad_clean.evt |
| Size (bytes) | 536,042,880 | 72,270,720 |
| Size | 511.2 MB | 68.9 MB |
| Events in quadrant A | 3,707,982 | 441,929 |
| Events in quadrant B | 3,602,658 | 446,788 |
| Events in quadrant C | 3,526,697 | 430,641 |
| Events in quadrant D | 4,962,064 | 421,316 |
| Mode M9 | |||
|---|---|---|---|
| Quadrant | BADHDUFLAG | Total packets | Discarded packets |
| A | 0 | 19 | 0 |
| B | 0 | 20 | 0 |
| C | 0 | 20 | 0 |
| D | 0 | 20 | 0 |
| Mode M0 | |||
|---|---|---|---|
| Quadrant | BADHDUFLAG | Total packets | Discarded packets |
| A | 0 | 15005 | 2 |
| B | 0 | 14620 | 2 |
| C | 0 | 14316 | 2 |
| D | 0 | 19157 | 2 |
| Mode SS | |||
|---|---|---|---|
| Quadrant | BADHDUFLAG | Total packets | Discarded packets |
| A | 0 | 130 | 0 |
| B | 0 | 130 | 0 |
| C | 0 | 130 | 0 |
| D | 0 | 130 | 0 |
| Quadrant | Total seconds | Saturated seconds | Saturation percentage |
|---|---|---|---|
| A | 6418 | 103 | 1.604861% |
| B | 6417 | 84 | 1.309023% |
| C | 6417 | 94 | 1.464859% |
| D | 6417 | 345 | 5.376344% |
Noise dominated data is calculated using 1-second bins in cleaned event files. If a bin has >2000 counts, and if more than 50% of those come from <1% of pixels, then it is considered to be noise-dominated and hence unusable.
| Quadrant | # 1 sec bins | Bins with >0 counts | Bins with >2000 counts | High rate bins dominated by noise | Noise dominated (total time) | Noise dominated (detector-on time) | Marked lightcurve |
|---|---|---|---|---|---|---|---|
| A | 7768 | 6420 | 14 | 14 | 0.18% | 0.22% | 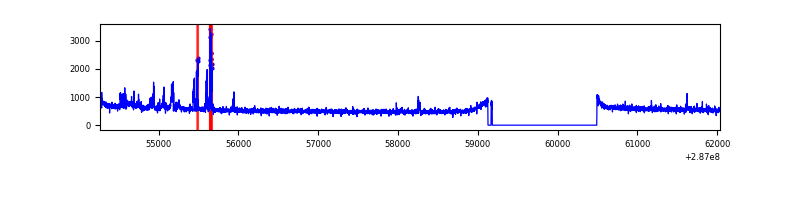 |
| B | 7767 | 6419 | 4 | 4 | 0.05% | 0.06% | 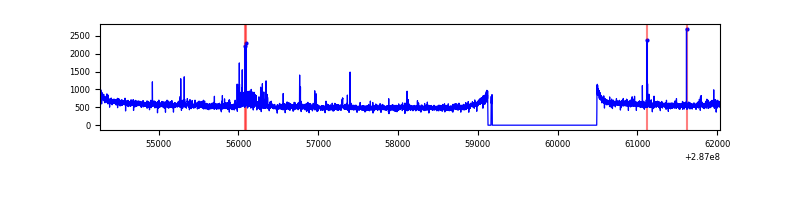 |
| C | 7767 | 6419 | 0 | 0 | 0.00% | 0.00% | 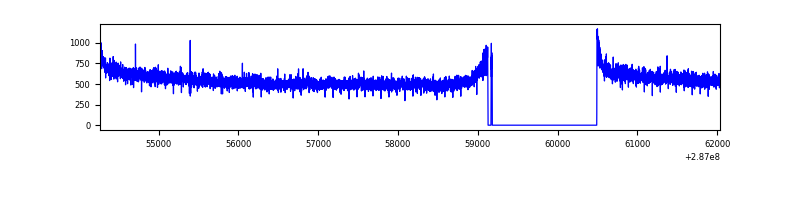 |
| D | 7767 | 6419 | 158 | 158 | 2.03% | 2.46% | 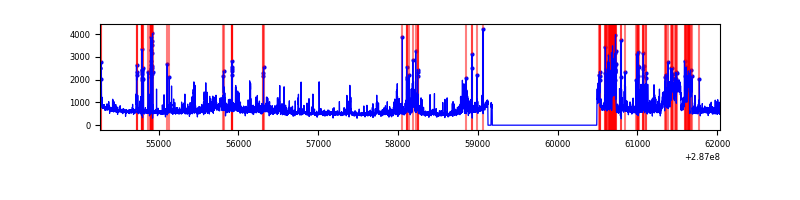 |
Top three noisy pixels from each quadrant. If the there are fewer than three noisy pixels in the level2.evt file, extra rows are filled as -1
| Pixel properties | Quadrant properties | ||||||
|---|---|---|---|---|---|---|---|
| Quadrant | DetID | PixID | Counts | Sigma | Mean | Median | Sigma |
| A | 15 | 174 | 218871 | 1207.58 | 908 | 892 | 180.5 |
| A | 0 | 226 | 8100 | 39.93 | 908 | 892 | 180.5 |
| A | 12 | 194 | 6702 | 32.19 | 908 | 892 | 180.5 |
| B | 7 | 220 | 53070 | 314.88 | 892 | 873 | 165.8 |
| B | 0 | 189 | 22470 | 130.28 | 892 | 873 | 165.8 |
| B | 12 | 111 | 18725 | 107.69 | 892 | 873 | 165.8 |
| C | 14 | 238 | 137321 | 683.49 | 865 | 871 | 199.6 |
| C | 0 | 207 | 8705 | 39.24 | 865 | 871 | 199.6 |
| C | 5 | 218 | 7528 | 33.35 | 865 | 871 | 199.6 |
| D | 13 | 187 | 766875 | 3573.01 | 876 | 851 | 214.4 |
| D | 12 | 110 | 281527 | 1309.17 | 876 | 851 | 214.4 |
| D | 10 | 70 | 139934 | 648.73 | 876 | 851 | 214.4 |
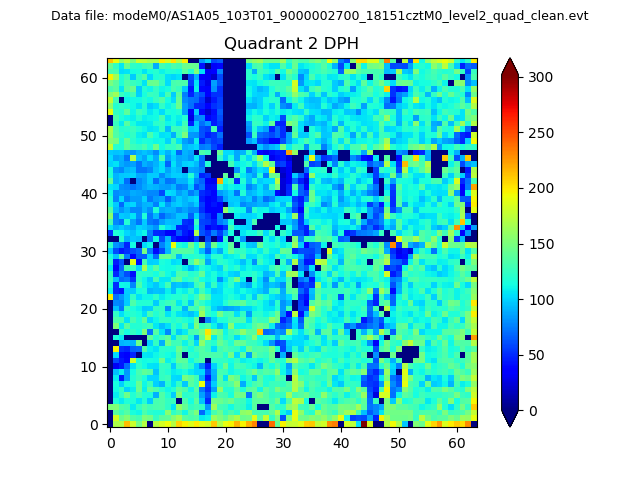
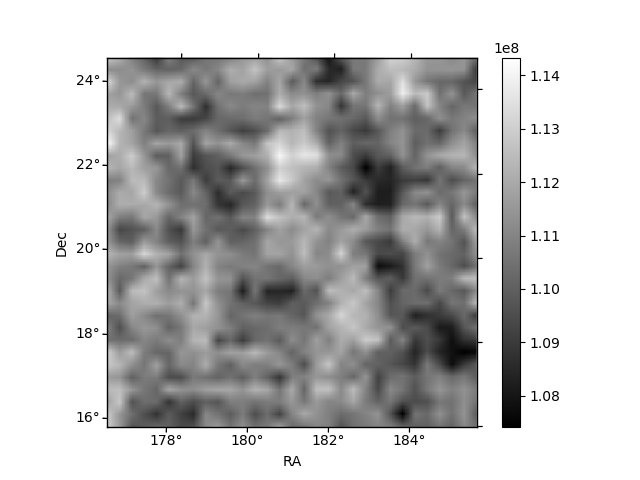
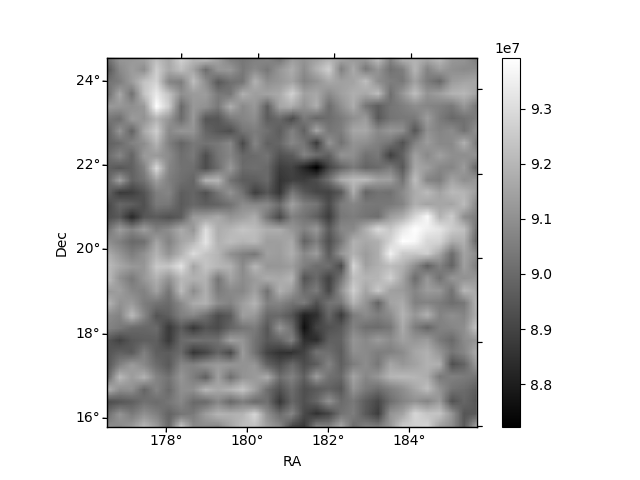
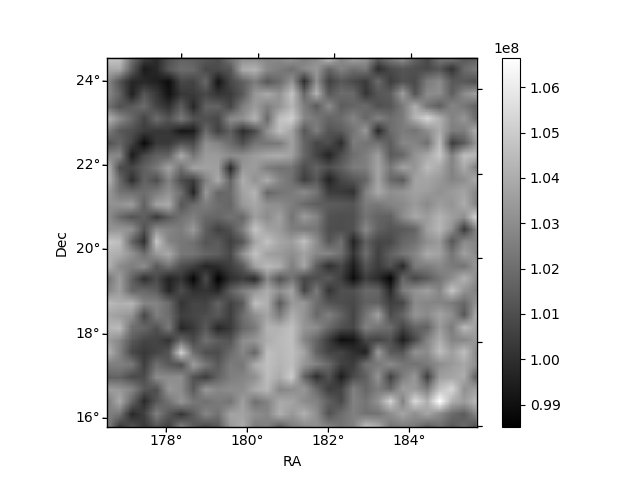
Histogram calculated using DETX and DETY for each event in the final _common_clean file
| Quadrant A | 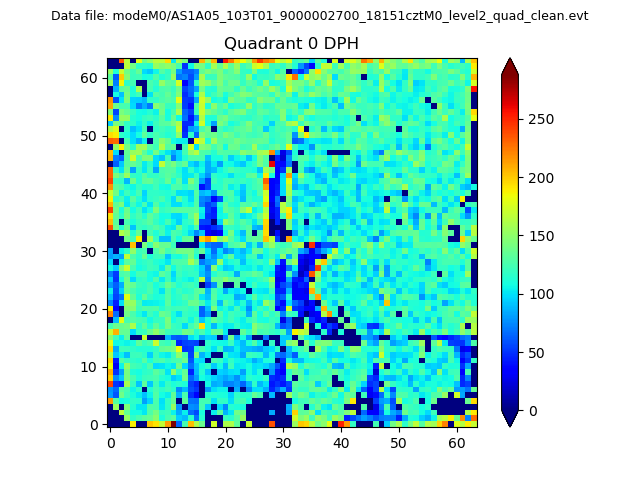 |
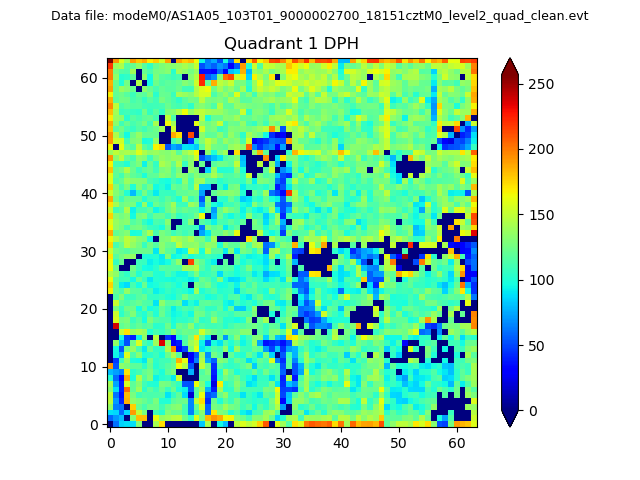 |
Quadrant B |
|---|---|---|---|
| Quadrant D | 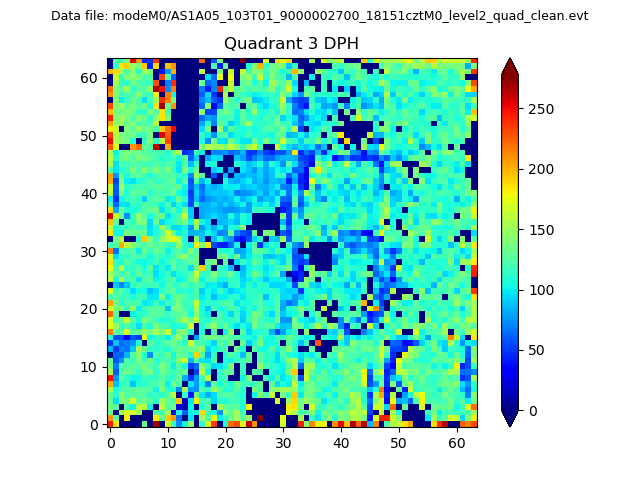 |
 |
Quadrant C |
| Plot type | Count rate plots | Images |
|---|---|---|
| Comparison with Poisson distribution Blue bars denote a histogram of data divided into 1 sec bins. Red curve is a Poisson curve with rate = median count rate of data. |
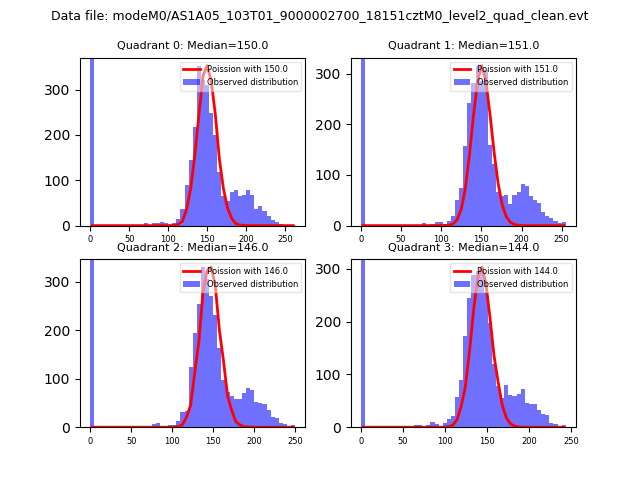 |
 |
| Quadrant-wise count rates Data is divided into 100 sec bins |
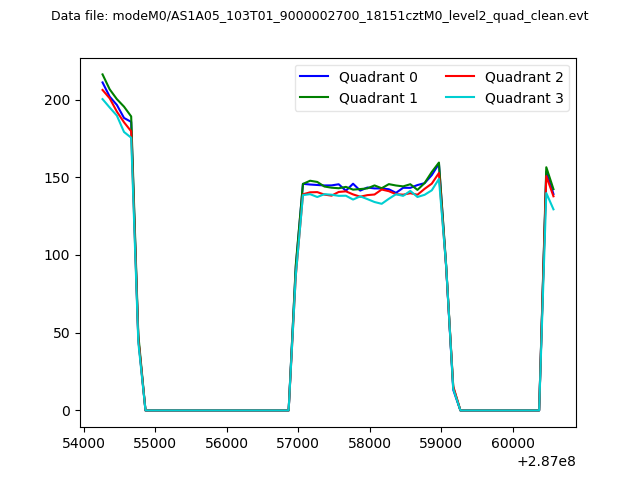 |
|
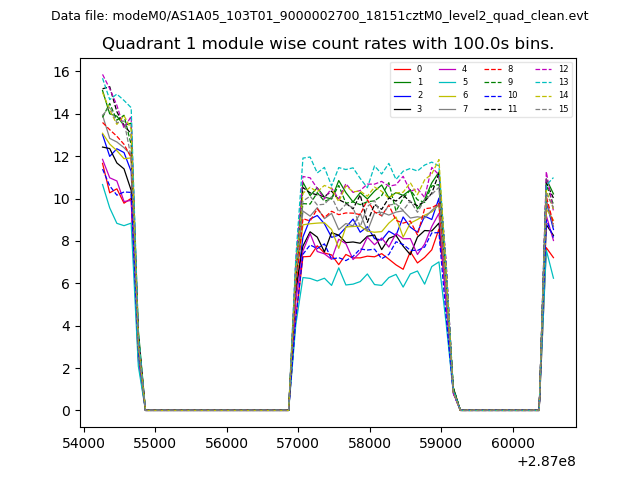
| Module-wise count rates for Quadrant A Data is divided into 100 sec bins |
 |
 |
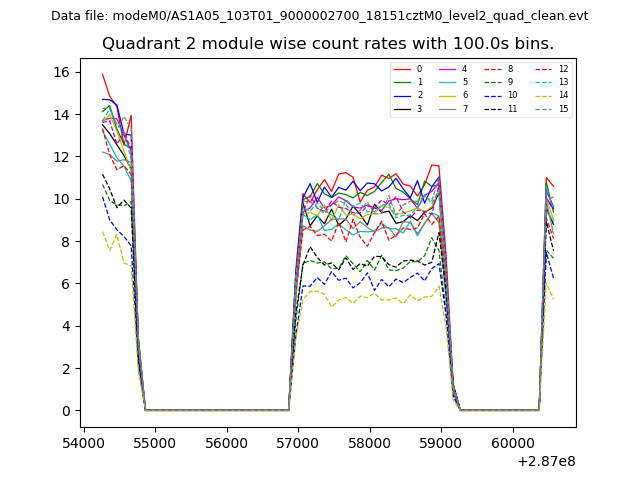
| Module-wise count rates for Quadrant B Data is divided into 100 sec bins |
 |
 |
| Module-wise count rates for Quadrant C Data is divided into 100 sec bins |
 |
 |
| Module-wise count rates for Quadrant D Data is divided into 100 sec bins |
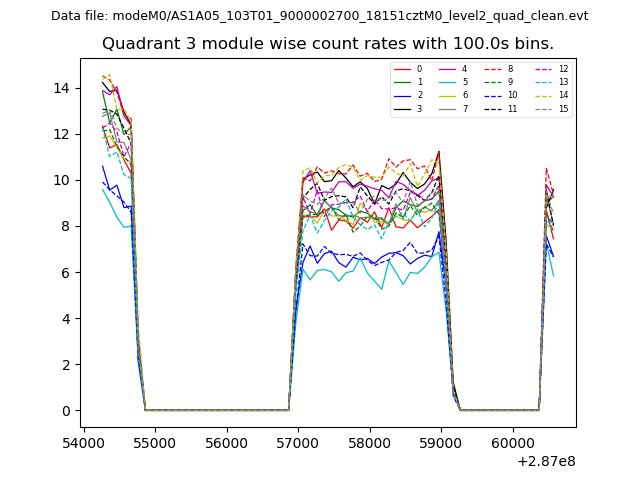 |
 |
| Parameter | Plot |
|---|---|
| CZT HV Monitor | 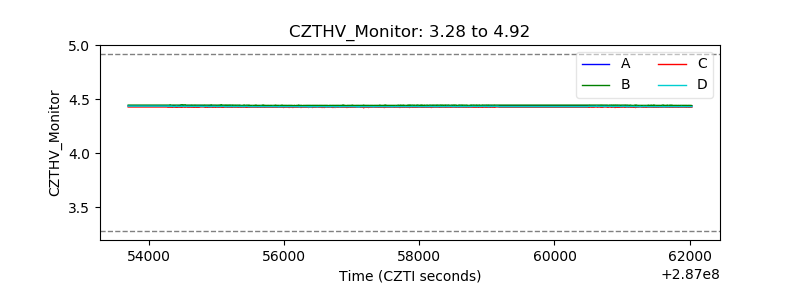 |
| D_VDD | 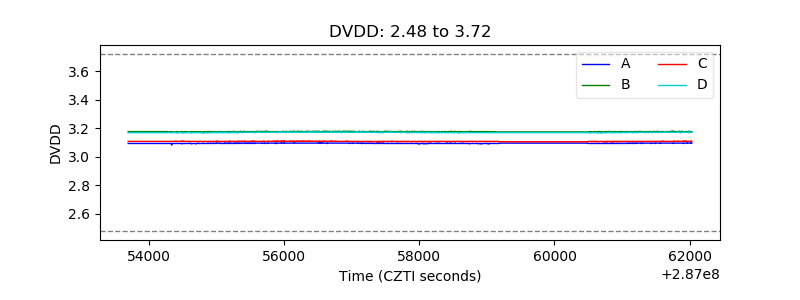 |
| Temperature 1 | 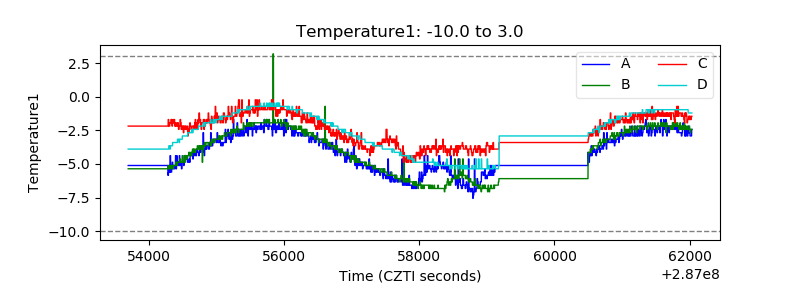 |
| Veto HV Monitor | 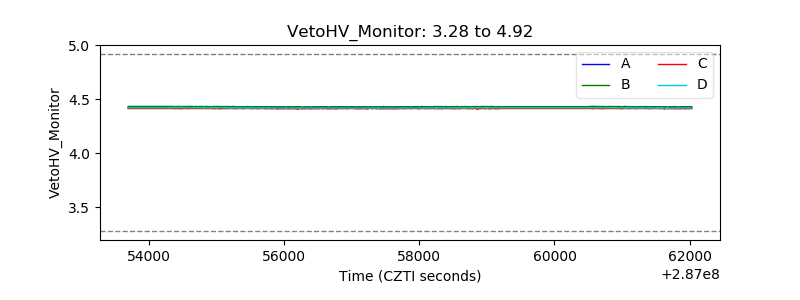 |
| Veto LLD | 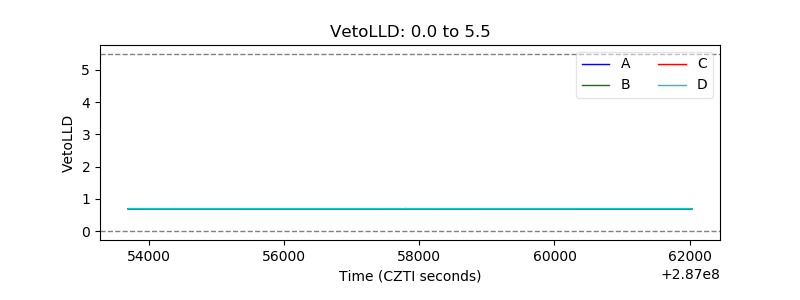 |
| Alpha Counter | 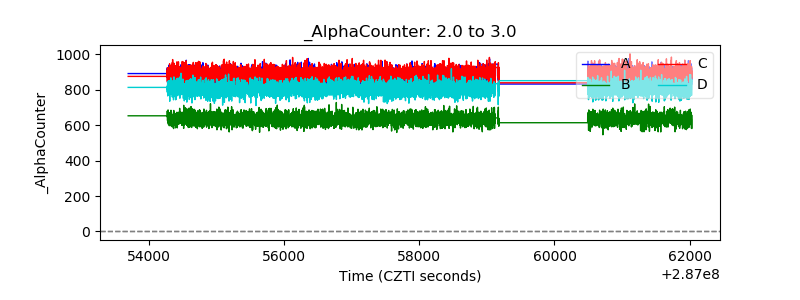 |
| _CPM_Rate | 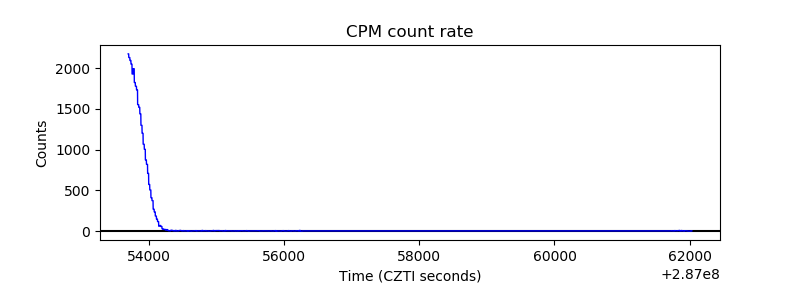 |
| CZT Counter | 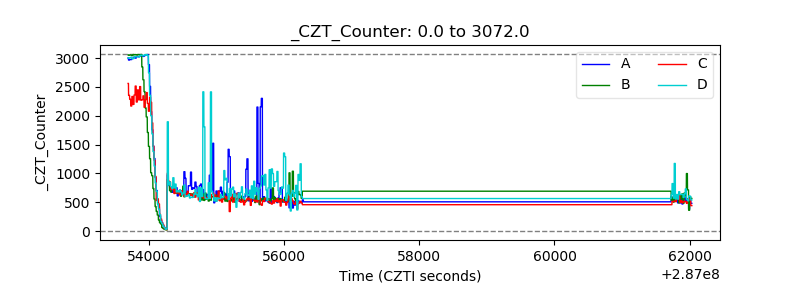 |
| +2.5 Volts monitor |  |
| +5 Volts monitor |  |
| _ROLL_ROT | 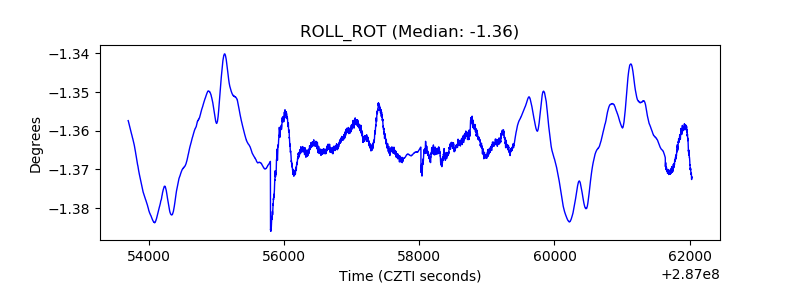 |
| _Roll_DEC | 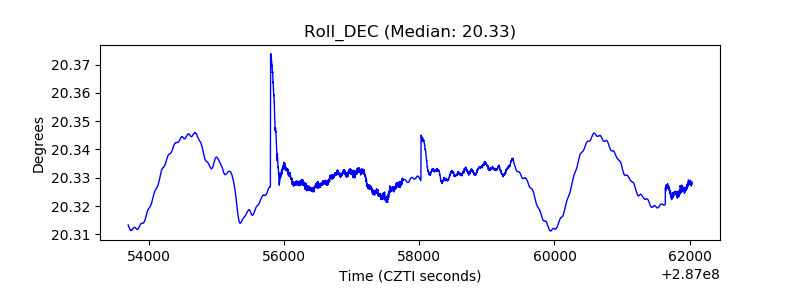 |
| _Roll_RA | 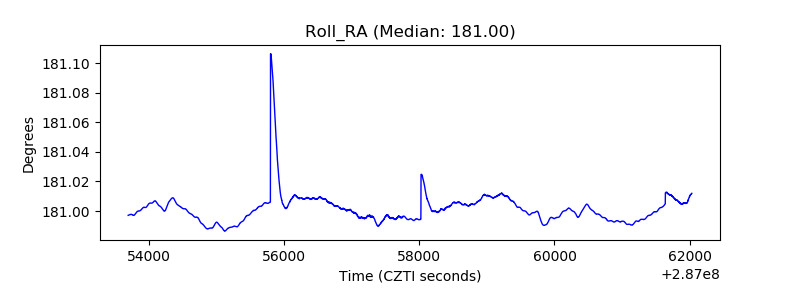 |
| Veto Counter | 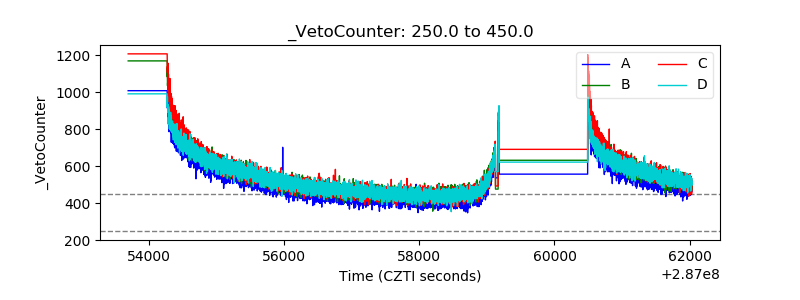 |