| Param | Original file | Final file |
|---|---|---|
| Filename | modeM0/AS1A05_103T01_9000002700_18153cztM0_level2.evt | modeM0/AS1A05_103T01_9000002700_18153cztM0_level2_quad_clean.evt |
| Size (bytes) | 545,832,000 | 73,607,040 |
| Size | 520.5 MB | 70.2 MB |
| Events in quadrant A | 3,411,717 | 446,908 |
| Events in quadrant B | 3,497,778 | 453,715 |
| Events in quadrant C | 3,392,278 | 440,237 |
| Events in quadrant D | 5,781,182 | 427,326 |
| Mode M9 | |||
|---|---|---|---|
| Quadrant | BADHDUFLAG | Total packets | Discarded packets |
| A | 0 | 12 | 0 |
| B | 0 | 13 | 0 |
| C | 0 | 13 | 0 |
| D | 0 | 13 | 0 |
| Mode M0 | |||
|---|---|---|---|
| Quadrant | BADHDUFLAG | Total packets | Discarded packets |
| A | 0 | 14131 | 2 |
| B | 0 | 14477 | 2 |
| C | 0 | 13975 | 2 |
| D | 0 | 21691 | 2 |
| Mode SS | |||
|---|---|---|---|
| Quadrant | BADHDUFLAG | Total packets | Discarded packets |
| A | 0 | 134 | 0 |
| B | 0 | 134 | 0 |
| C | 0 | 134 | 0 |
| D | 0 | 134 | 0 |
| Quadrant | Total seconds | Saturated seconds | Saturation percentage |
|---|---|---|---|
| A | 6604 | 115 | 1.741369% |
| B | 6604 | 110 | 1.665657% |
| C | 6604 | 118 | 1.786796% |
| D | 6604 | 549 | 8.313144% |
Noise dominated data is calculated using 1-second bins in cleaned event files. If a bin has >2000 counts, and if more than 50% of those come from <1% of pixels, then it is considered to be noise-dominated and hence unusable.
| Quadrant | # 1 sec bins | Bins with >0 counts | Bins with >2000 counts | High rate bins dominated by noise | Noise dominated (total time) | Noise dominated (detector-on time) | Marked lightcurve |
|---|---|---|---|---|---|---|---|
| A | 7604 | 6605 | 19 | 19 | 0.25% | 0.29% | 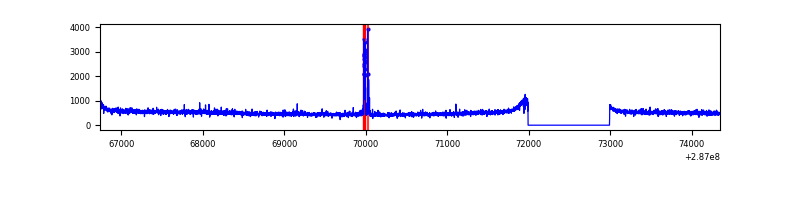 |
| B | 7604 | 6605 | 5 | 5 | 0.07% | 0.08% | 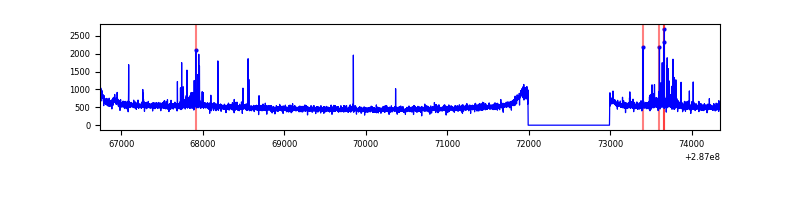 |
| C | 7604 | 6605 | 0 | 0 | 0.00% | 0.00% | 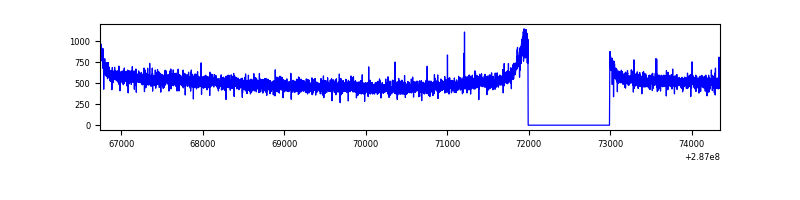 |
| D | 7604 | 6605 | 306 | 306 | 4.02% | 4.63% | 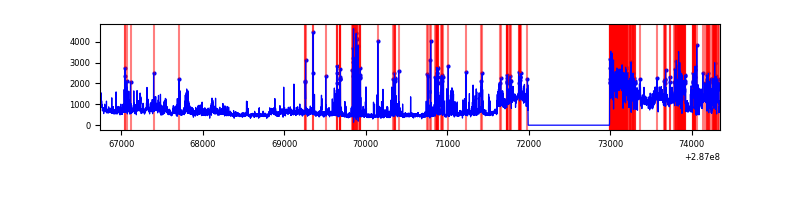 |
Top three noisy pixels from each quadrant. If the there are fewer than three noisy pixels in the level2.evt file, extra rows are filled as -1
| Pixel properties | Quadrant properties | ||||||
|---|---|---|---|---|---|---|---|
| Quadrant | DetID | PixID | Counts | Sigma | Mean | Median | Sigma |
| A | 4 | 2 | 87174 | 495.9 | 864 | 847 | 174.1 |
| A | 15 | 174 | 7738 | 39.58 | 864 | 847 | 174.1 |
| A | 0 | 226 | 7631 | 38.97 | 864 | 847 | 174.1 |
| B | 7 | 220 | 106338 | 640.74 | 856 | 837 | 164.7 |
| B | 0 | 189 | 21353 | 124.6 | 856 | 837 | 164.7 |
| B | 12 | 111 | 18947 | 109.99 | 856 | 837 | 164.7 |
| C | 14 | 238 | 129319 | 661.85 | 830 | 836 | 194.1 |
| C | 3 | 233 | 14980 | 72.86 | 830 | 836 | 194.1 |
| C | 13 | 61 | 5930 | 26.24 | 830 | 836 | 194.1 |
| D | 7 | 238 | 1710694 | 8465.72 | 825 | 805 | 202.0 |
| D | 13 | 187 | 696922 | 3446.5 | 825 | 805 | 202.0 |
| D | 10 | 70 | 64513 | 315.42 | 825 | 805 | 202.0 |
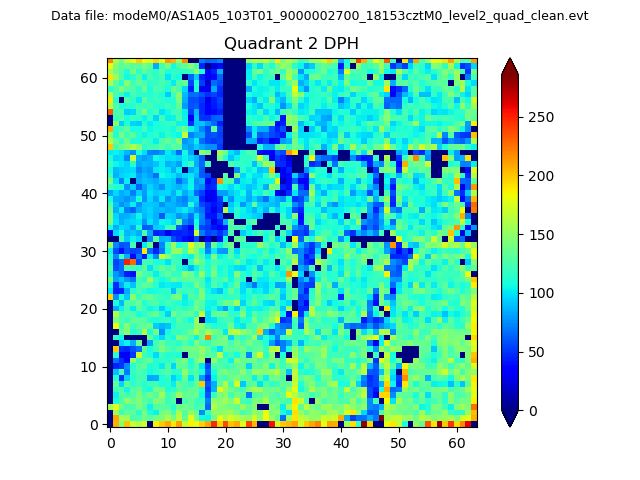
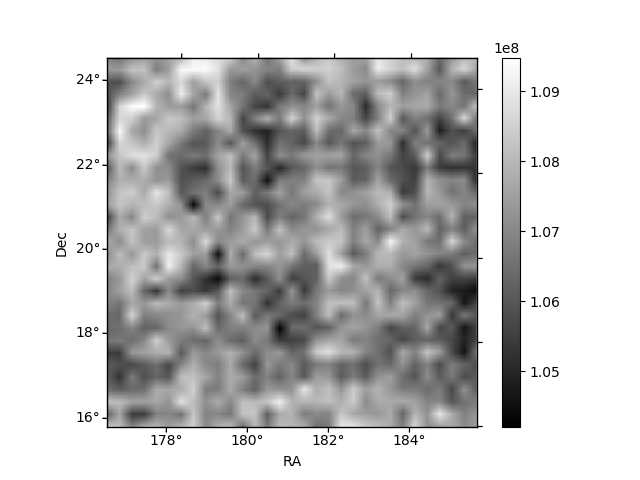
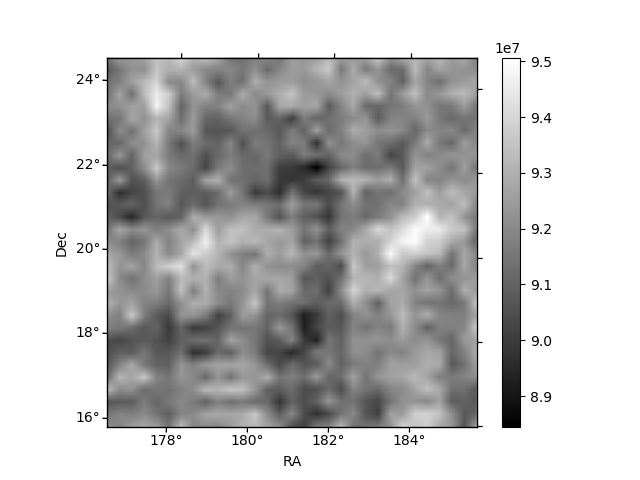
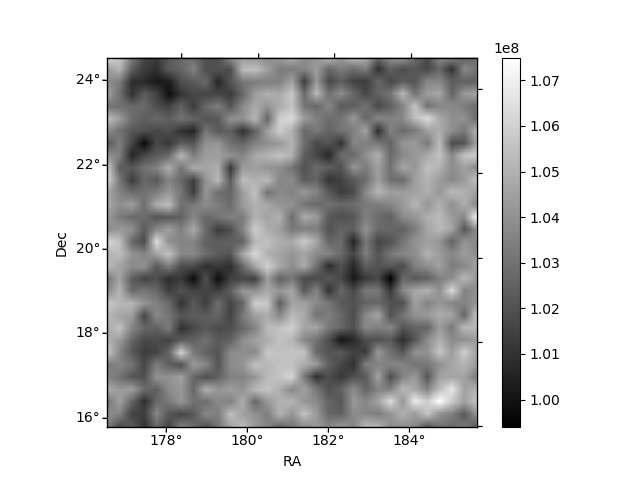
Histogram calculated using DETX and DETY for each event in the final _common_clean file
| Quadrant A | 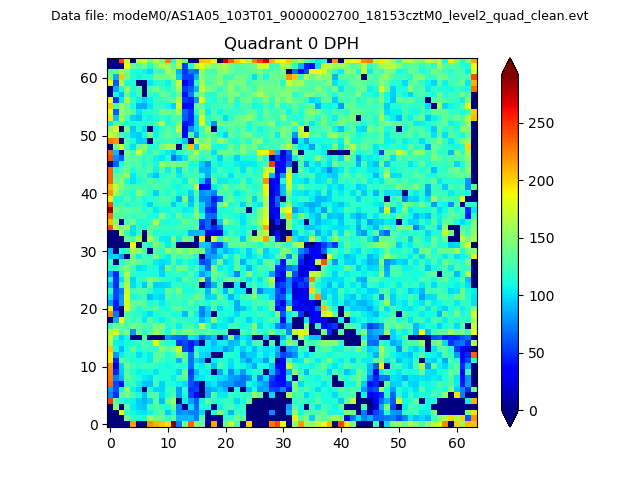 |
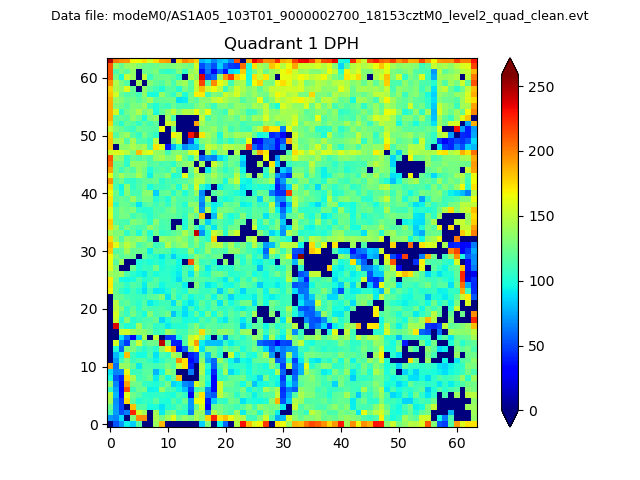 |
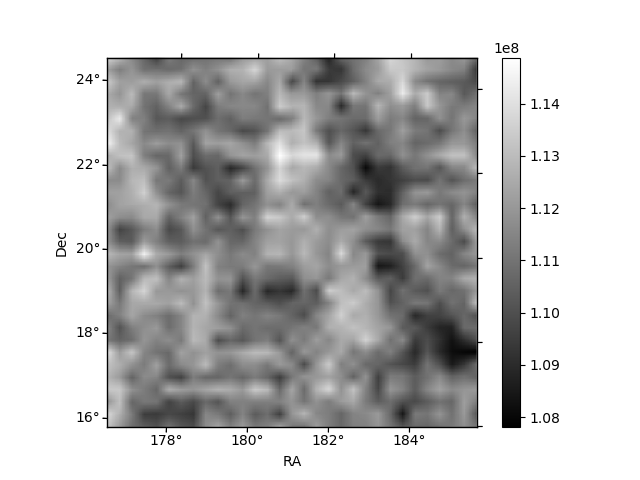
Quadrant B |
|---|---|---|---|
| Quadrant D | 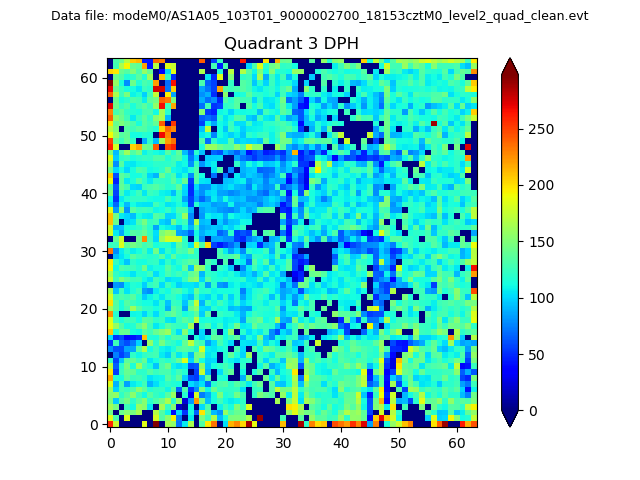 |
 |
Quadrant C |
| Plot type | Count rate plots | Images |
|---|---|---|
| Comparison with Poisson distribution Blue bars denote a histogram of data divided into 1 sec bins. Red curve is a Poisson curve with rate = median count rate of data. |
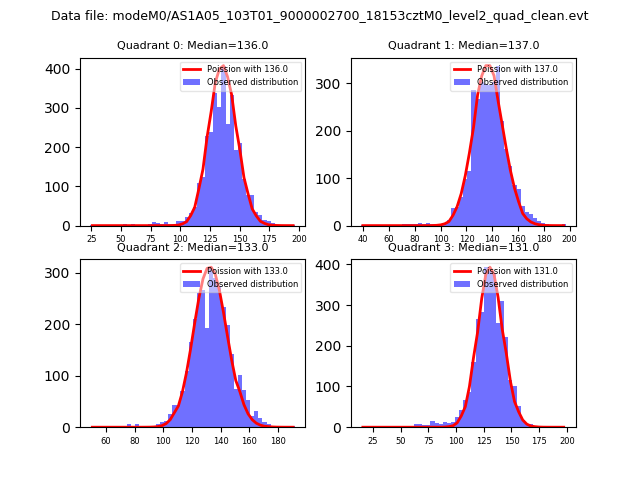 |
 |
| Quadrant-wise count rates Data is divided into 100 sec bins |
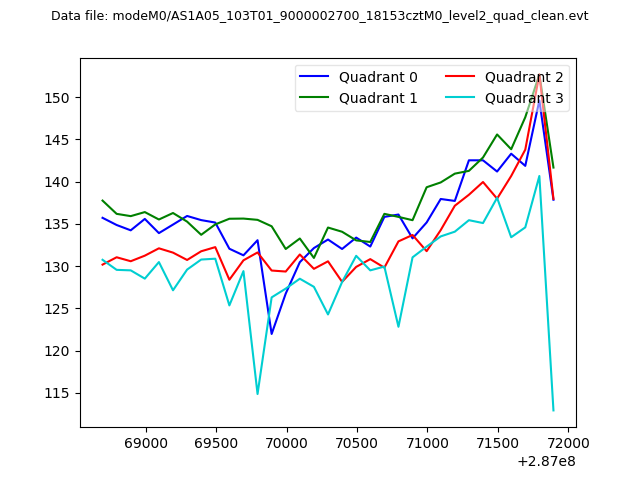 |
|
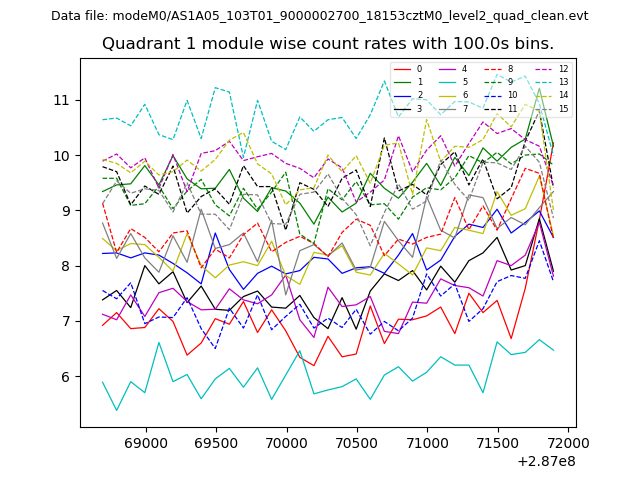
| Module-wise count rates for Quadrant A Data is divided into 100 sec bins |
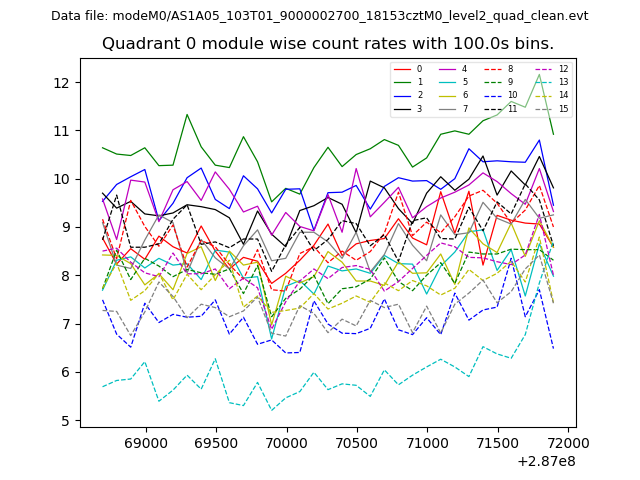 |
 |
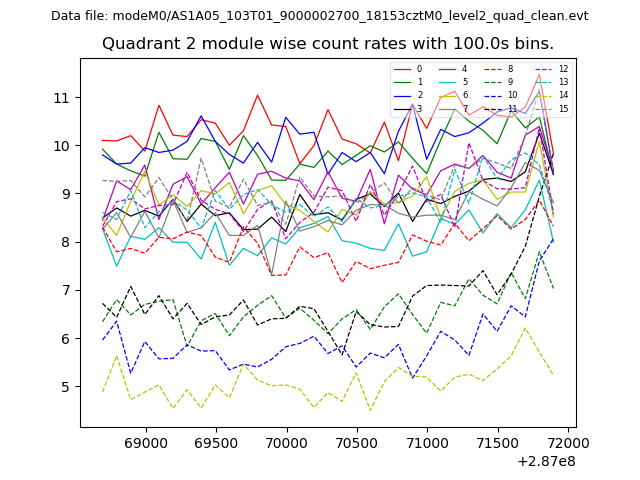
| Module-wise count rates for Quadrant B Data is divided into 100 sec bins |
 |
 |
| Module-wise count rates for Quadrant C Data is divided into 100 sec bins |
 |
 |
| Module-wise count rates for Quadrant D Data is divided into 100 sec bins |
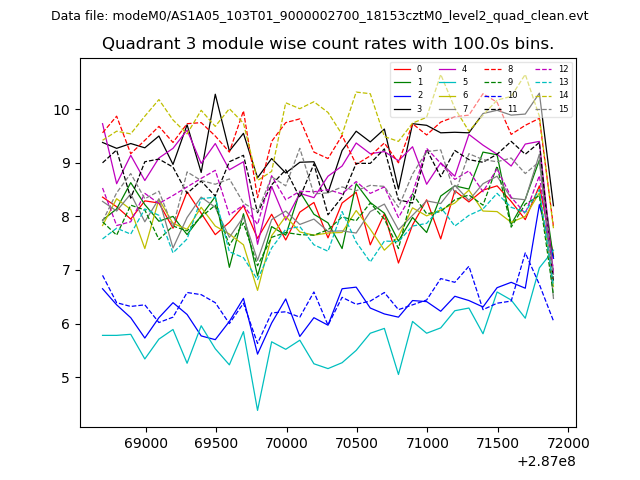 |
 |
| Parameter | Plot |
|---|---|
| CZT HV Monitor | 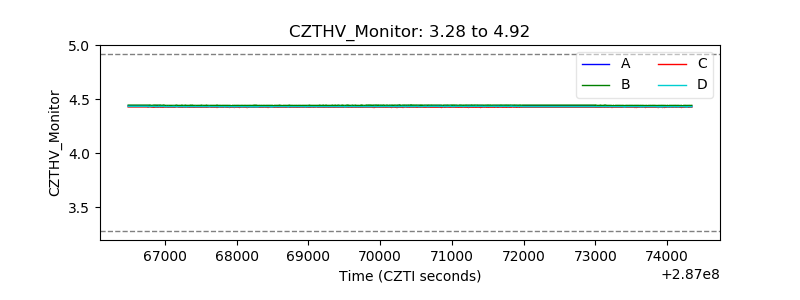 |
| D_VDD | 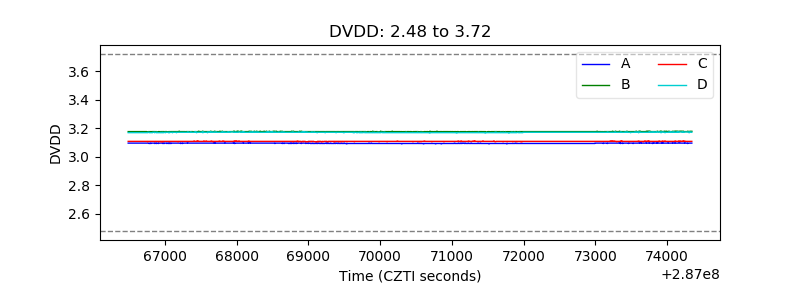 |
| Temperature 1 | 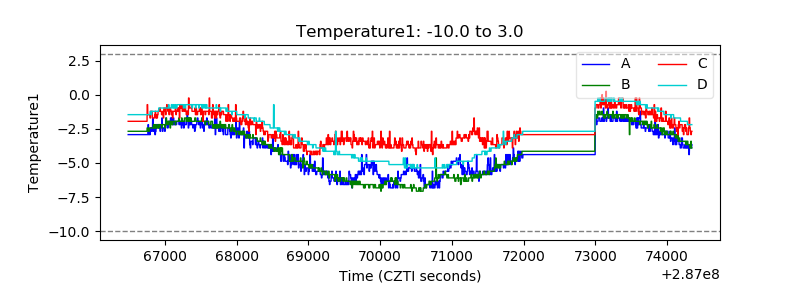 |
| Veto HV Monitor | 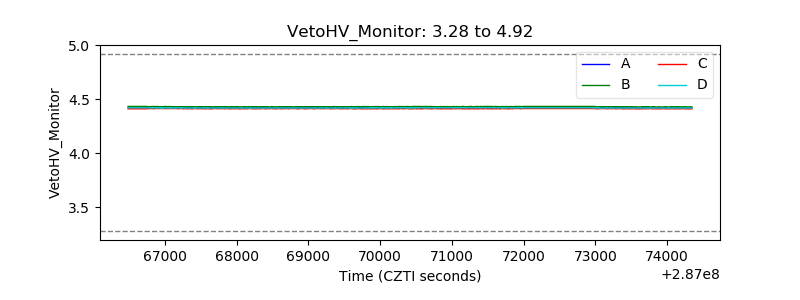 |
| Veto LLD | 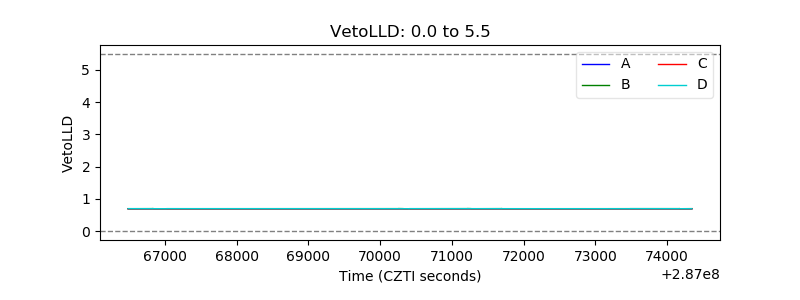 |
| Alpha Counter | 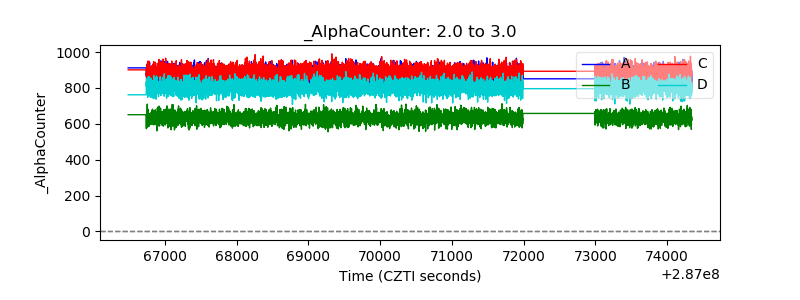 |
| _CPM_Rate | 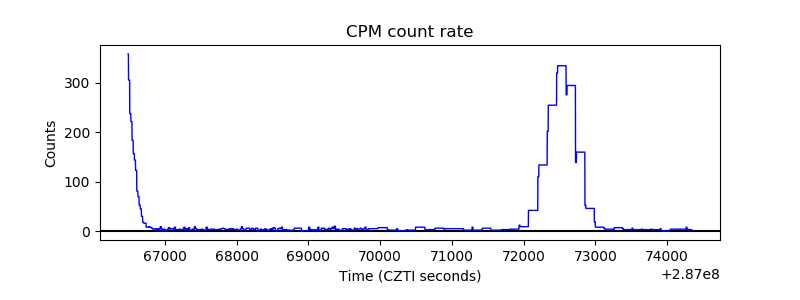 |
| CZT Counter | 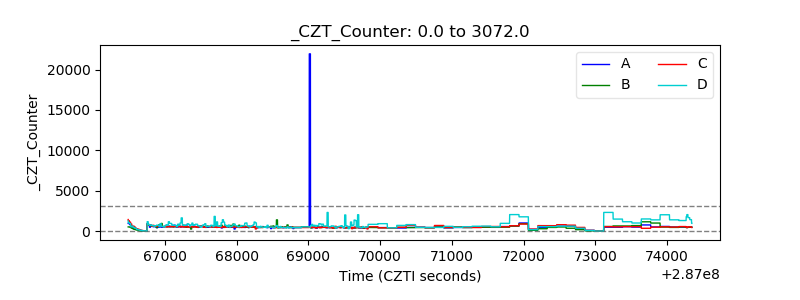 |
| +2.5 Volts monitor |  |
| +5 Volts monitor |  |
| _ROLL_ROT | 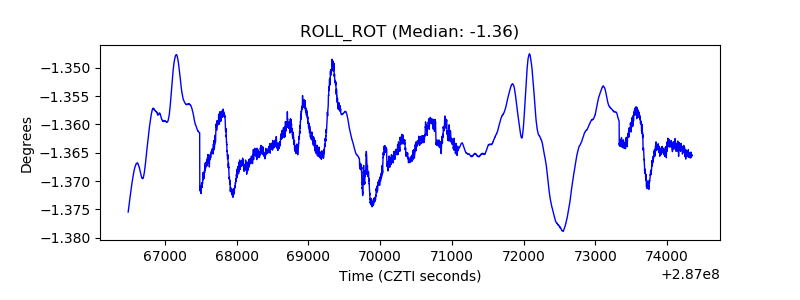 |
| _Roll_DEC | 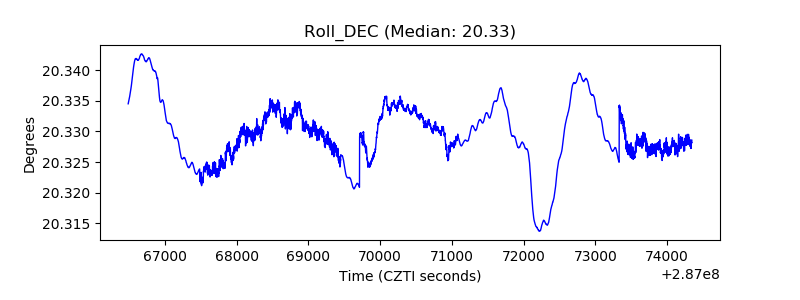 |
| _Roll_RA | 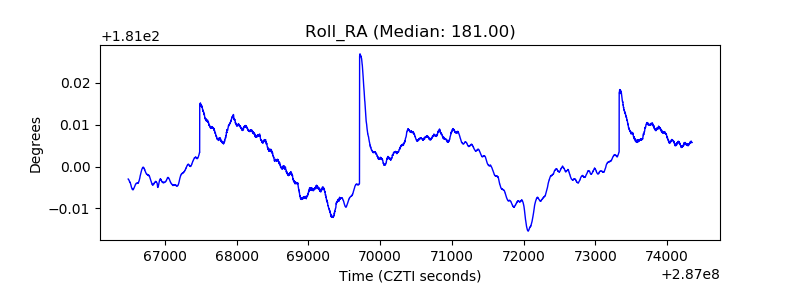 |
| Veto Counter | 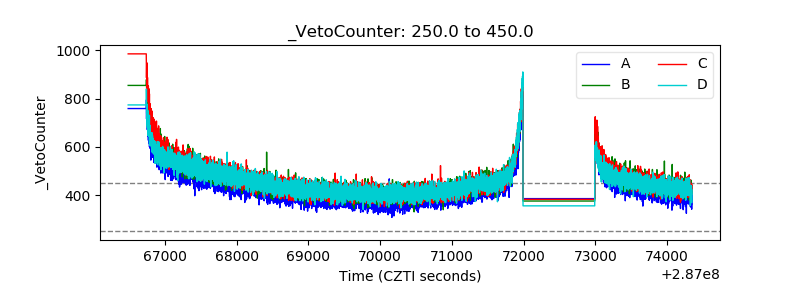 |