| Param | Original file | Final file |
|---|---|---|
| Filename | modeM0/AS1A05_103T01_9000002700_18154cztM0_level2.evt | modeM0/AS1A05_103T01_9000002700_18154cztM0_level2_quad_clean.evt |
| Size (bytes) | 237,792,960 | 21,686,400 |
| Size | 226.8 MB | 20.7 MB |
| Events in quadrant A | 1,331,993 | 121,470 |
| Events in quadrant B | 1,369,539 | 123,263 |
| Events in quadrant C | 1,294,639 | 118,670 |
| Events in quadrant D | 3,034,737 | 113,888 |
| Mode M9 | |||
|---|---|---|---|
| Quadrant | BADHDUFLAG | Total packets | Discarded packets |
| A | 0 | 10 | 0 |
| B | 0 | 10 | 0 |
| C | 0 | 10 | 0 |
| D | 0 | 10 | 0 |
| Mode M0 | |||
|---|---|---|---|
| Quadrant | BADHDUFLAG | Total packets | Discarded packets |
| A | 0 | 5479 | 1 |
| B | 0 | 5600 | 1 |
| C | 0 | 5314 | 1 |
| D | 0 | 10744 | 1 |
| Mode SS | |||
|---|---|---|---|
| Quadrant | BADHDUFLAG | Total packets | Discarded packets |
| A | 0 | 50 | 0 |
| B | 0 | 50 | 0 |
| C | 0 | 50 | 0 |
| D | 0 | 50 | 0 |
| Quadrant | Total seconds | Saturated seconds | Saturation percentage |
|---|---|---|---|
| A | 2494 | 78 | 3.127506% |
| B | 2495 | 94 | 3.767535% |
| C | 2495 | 97 | 3.887776% |
| D | 2495 | 466 | 18.677355% |
Noise dominated data is calculated using 1-second bins in cleaned event files. If a bin has >2000 counts, and if more than 50% of those come from <1% of pixels, then it is considered to be noise-dominated and hence unusable.
| Quadrant | # 1 sec bins | Bins with >0 counts | Bins with >2000 counts | High rate bins dominated by noise | Noise dominated (total time) | Noise dominated (detector-on time) | Marked lightcurve |
|---|---|---|---|---|---|---|---|
| A | 3494 | 2495 | 3 | 3 | 0.09% | 0.12% | 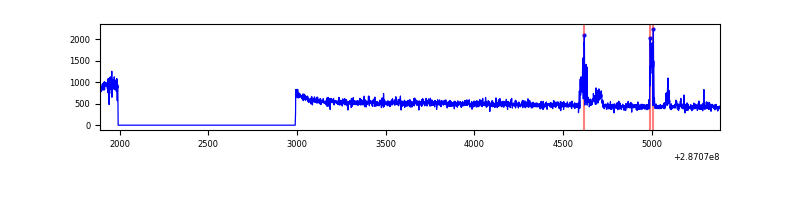 |
| B | 3495 | 2496 | 6 | 6 | 0.17% | 0.24% | 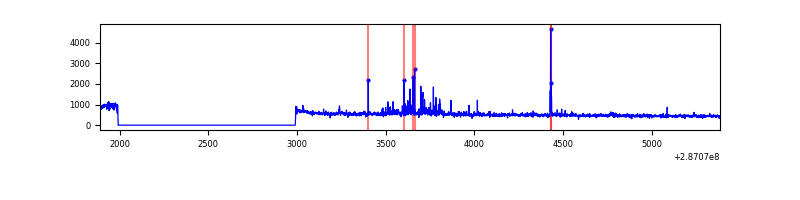 |
| C | 3495 | 2496 | 0 | 0 | 0.00% | 0.00% | 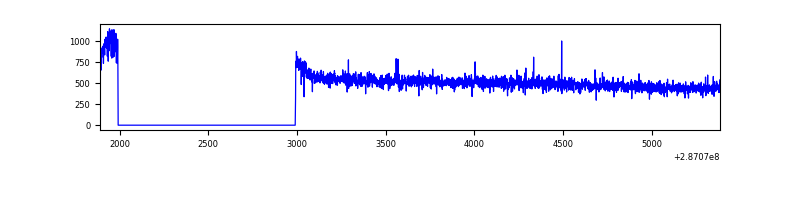 |
| D | 3495 | 2496 | 252 | 252 | 7.21% | 10.10% | 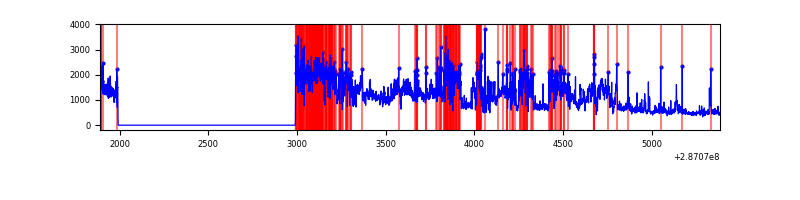 |
Top three noisy pixels from each quadrant. If the there are fewer than three noisy pixels in the level2.evt file, extra rows are filled as -1
| Pixel properties | Quadrant properties | ||||||
|---|---|---|---|---|---|---|---|
| Quadrant | DetID | PixID | Counts | Sigma | Mean | Median | Sigma |
| A | 15 | 174 | 69294 | 1023.63 | 327 | 319 | 67.4 |
| A | 4 | 2 | 3063 | 40.72 | 327 | 319 | 67.4 |
| A | 0 | 226 | 2852 | 37.59 | 327 | 319 | 67.4 |
| B | 7 | 220 | 73565 | 1126.92 | 326 | 317 | 65.0 |
| B | 0 | 189 | 8267 | 122.31 | 326 | 317 | 65.0 |
| B | 12 | 111 | 7126 | 104.76 | 326 | 317 | 65.0 |
| C | 14 | 238 | 48132 | 633.89 | 315 | 317 | 75.4 |
| C | 3 | 233 | 13037 | 168.63 | 315 | 317 | 75.4 |
| C | 13 | 61 | 2312 | 26.45 | 315 | 317 | 75.4 |
| D | 7 | 238 | 1558036 | 20390.4 | 307 | 299 | 76.4 |
| D | 13 | 187 | 155145 | 2026.9 | 307 | 299 | 76.4 |
| D | 12 | 110 | 65230 | 849.93 | 307 | 299 | 76.4 |
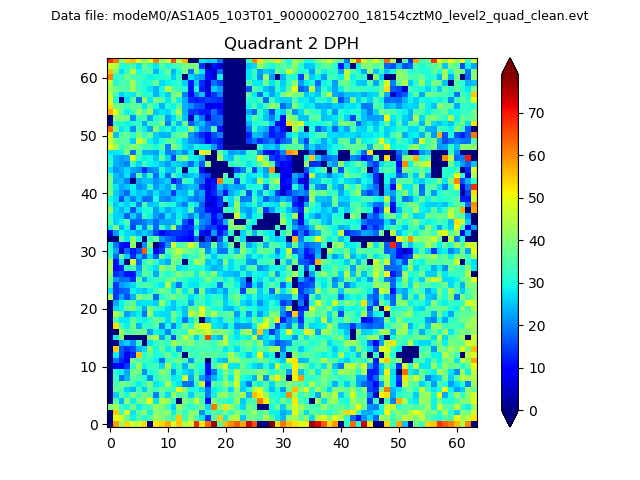
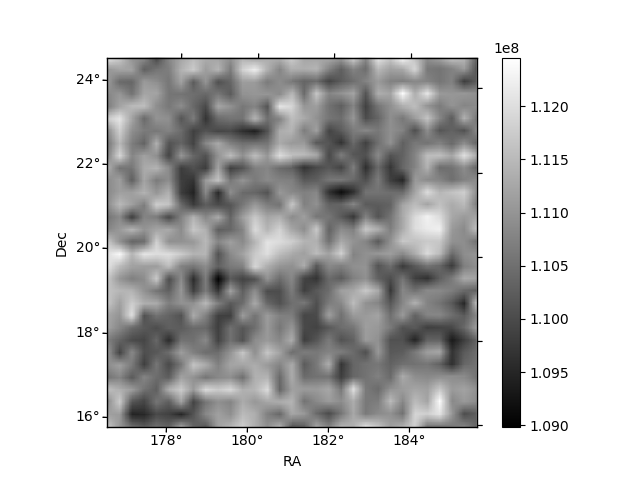
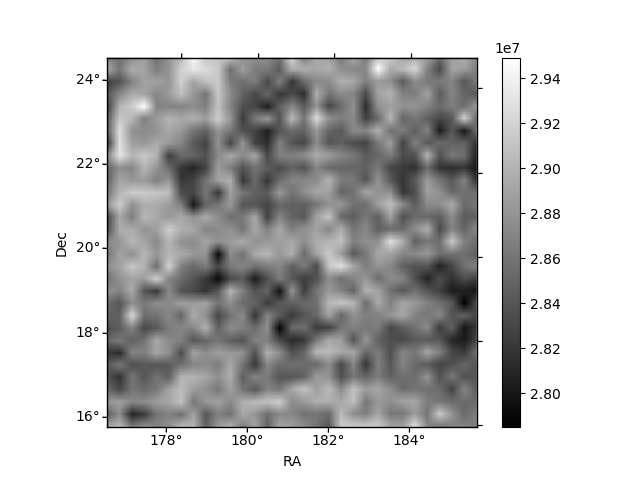
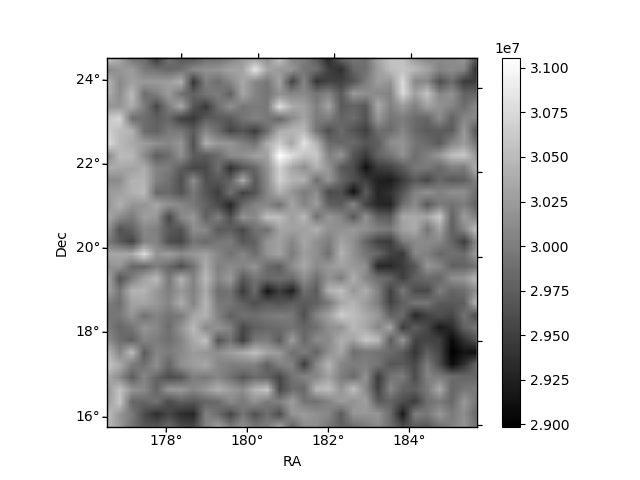
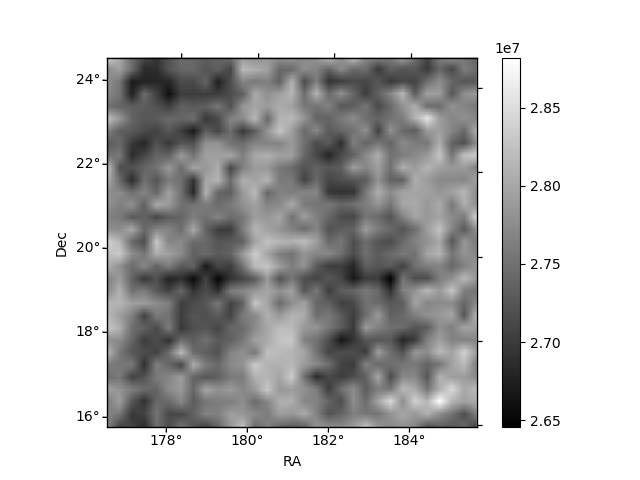
Histogram calculated using DETX and DETY for each event in the final _common_clean file
| Quadrant A | 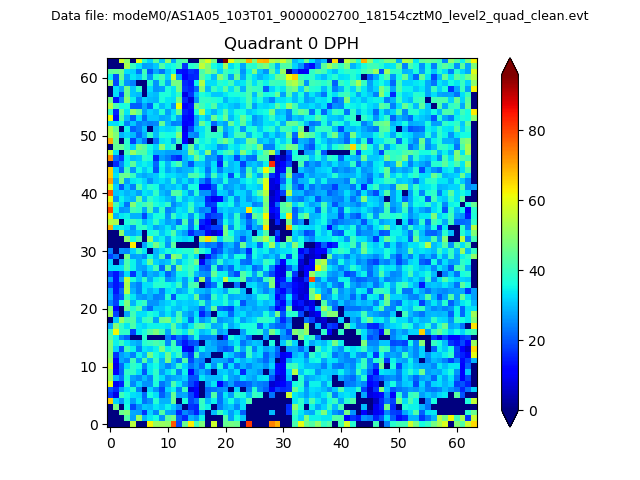 |
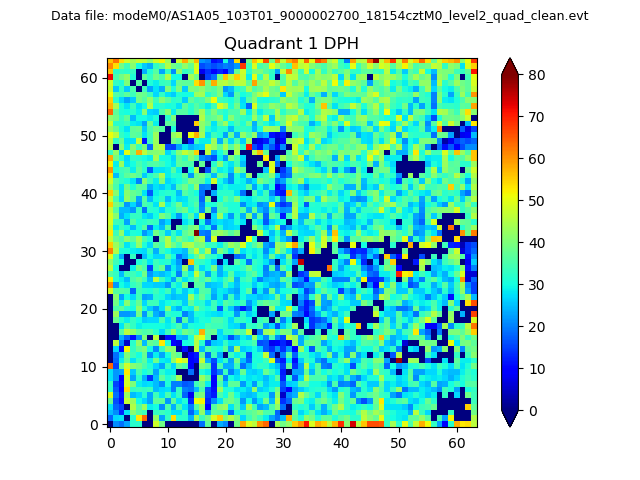 |
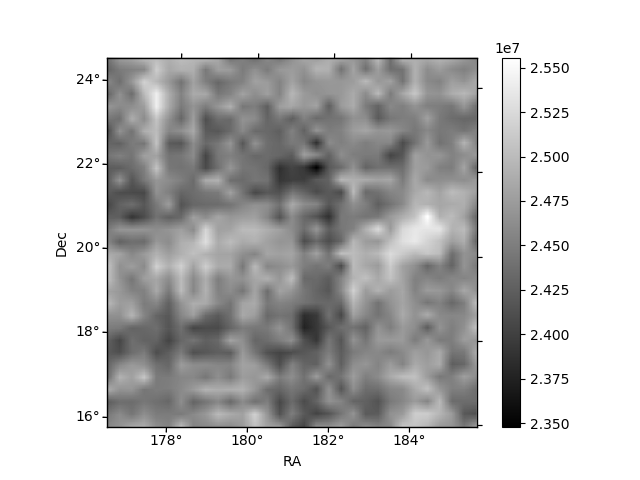
Quadrant B |
|---|---|---|---|
| Quadrant D | 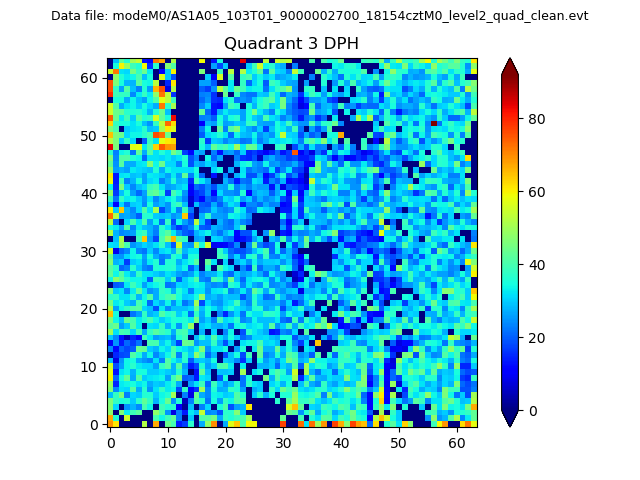 |
 |
Quadrant C |
| Plot type | Count rate plots | Images |
|---|---|---|
| Comparison with Poisson distribution Blue bars denote a histogram of data divided into 1 sec bins. Red curve is a Poisson curve with rate = median count rate of data. |
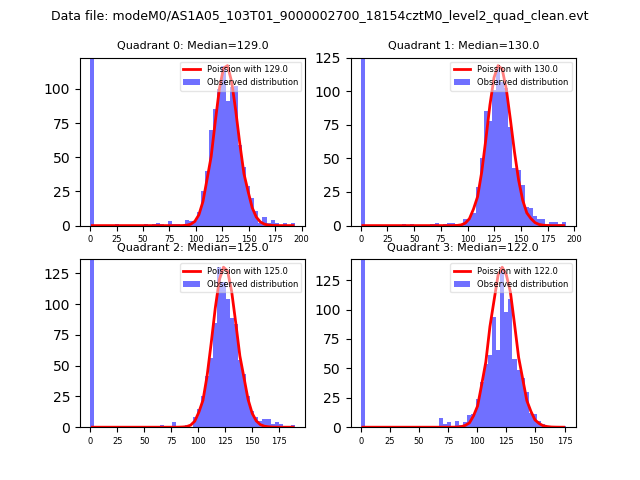 |
 |
| Quadrant-wise count rates Data is divided into 100 sec bins |
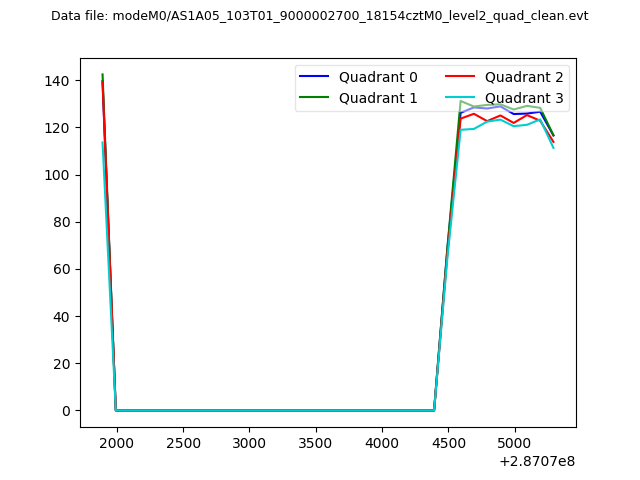 |
|
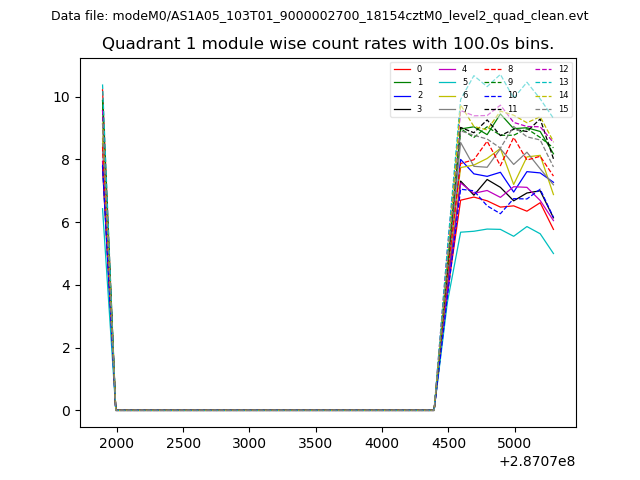
| Module-wise count rates for Quadrant A Data is divided into 100 sec bins |
 |
 |
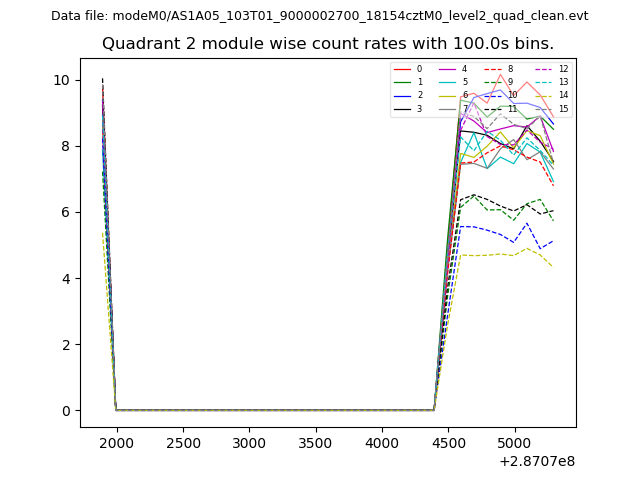
| Module-wise count rates for Quadrant B Data is divided into 100 sec bins |
 |
 |
| Module-wise count rates for Quadrant C Data is divided into 100 sec bins |
 |
 |
| Module-wise count rates for Quadrant D Data is divided into 100 sec bins |
 |
 |
| Parameter | Plot |
|---|---|
| CZT HV Monitor |  |
| D_VDD | 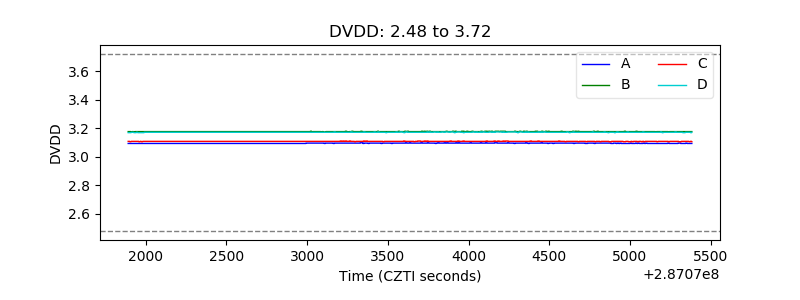 |
| Temperature 1 | 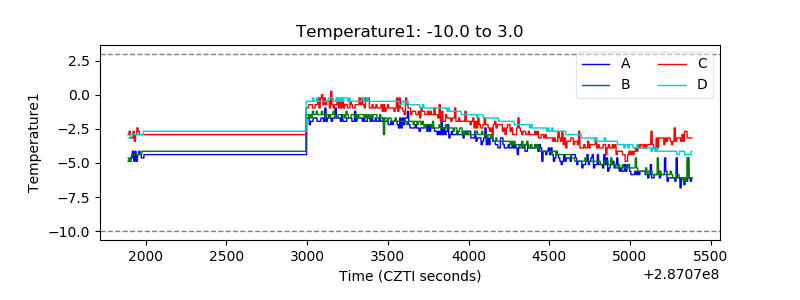 |
| Veto HV Monitor | 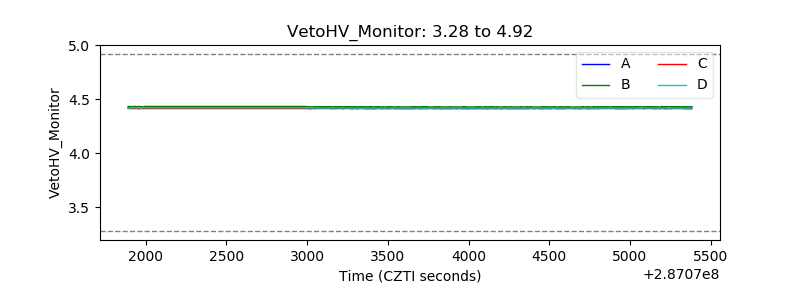 |
| Veto LLD |  |
| Alpha Counter | 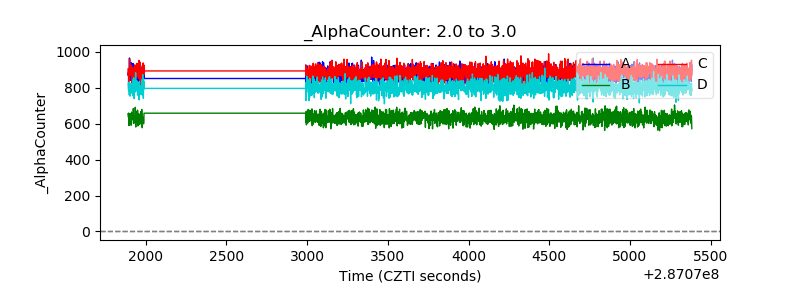 |
| _CPM_Rate | 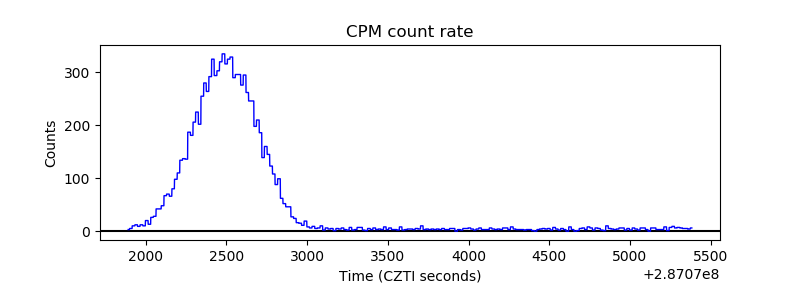 |
| CZT Counter | 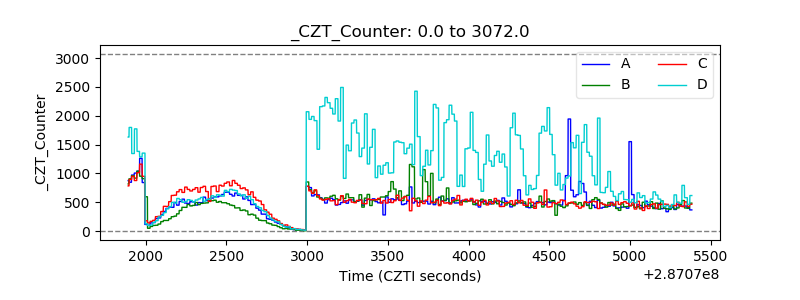 |
| +2.5 Volts monitor |  |
| +5 Volts monitor |  |
| _ROLL_ROT |  |
| _Roll_DEC |  |
| _Roll_RA | 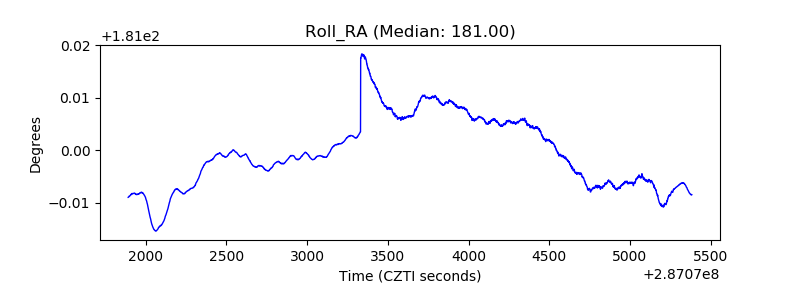 |
| Veto Counter |  |