| Param | Original file | Final file |
|---|---|---|
| Filename | modeM0/AS1A05_194T05_9000002702cztM0_level2.fits | modeM0/AS1A05_194T05_9000002702cztM0_level2_quad_clean.evt |
| Size (bytes) | 159,105,600 | 152,663,040 |
| Size | 151.7 MB | 145.6 MB |
| Events in quadrant A | 972,348 | 901,008 |
| Events in quadrant B | 930,450 | 906,671 |
| Events in quadrant C | 937,342 | 856,522 |
| Events in quadrant D | 826,386 | 806,867 |
| Mode M0 | |||
|---|---|---|---|
| Quadrant | BADHDUFLAG | Total packets | Discarded packets |
| A | 0 | 35622 | 0 |
| B | 0 | 35721 | 0 |
| C | 0 | 38902 | 0 |
| D | 0 | 46928 | 0 |
| Mode SS | |||
|---|---|---|---|
| Quadrant | BADHDUFLAG | Total packets | Discarded packets |
| A | 0 | 342 | 0 |
| B | 0 | 342 | 0 |
| C | 0 | 342 | 0 |
| D | 0 | 342 | 0 |
| Mode M9 | |||
|---|---|---|---|
| Quadrant | BADHDUFLAG | Total packets | Discarded packets |
| A | 0 | 10 | 0 |
| B | 0 | 10 | 0 |
| C | 0 | 10 | 0 |
| D | 0 | 10 | 0 |
| Quadrant | Total seconds | Saturated seconds | Saturation percentage |
|---|---|---|---|
| A | 16702 | 246 | 1.472877% |
| B | 16702 | 305 | 1.826129% |
| C | 16702 | 691 | 4.137229% |
| D | 16702 | 514 | 3.077476% |
Noise dominated data is calculated using 1-second bins in cleaned event files. If a bin has >2000 counts, and if more than 50% of those come from <1% of pixels, then it is considered to be noise-dominated and hence unusable.
| Quadrant | # 1 sec bins | Bins with >0 counts | Bins with >2000 counts | High rate bins dominated by noise | Noise dominated (total time) | Noise dominated (detector-on time) | Marked lightcurve |
|---|---|---|---|---|---|---|---|
| A | 17742 | 16702 | 0 | 0 | 0.00% | 0.00% | 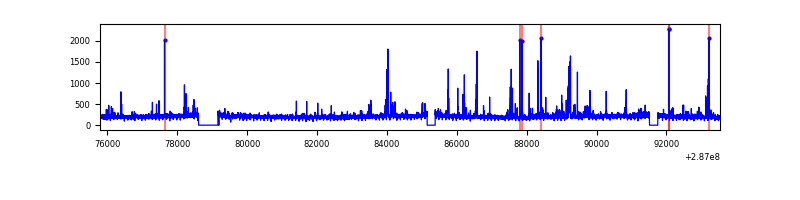 |
| B | 17742 | 16702 | 0 | 0 | 0.00% | 0.00% |  |
| C | 17742 | 16698 | 0 | 0 | 0.00% | 0.00% | 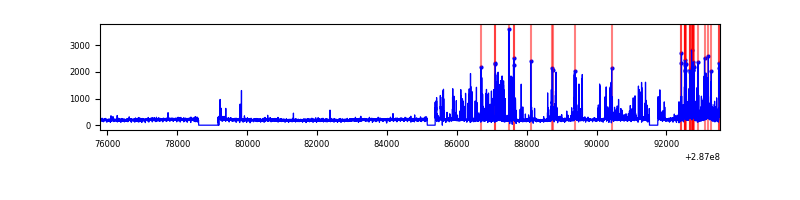 |
| D | 17742 | 16699 | 0 | 0 | 0.00% | 0.00% | 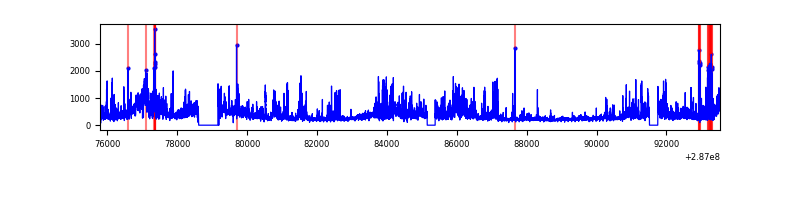 |
Top three noisy pixels from each quadrant. If the there are fewer than three noisy pixels in the level2.evt file, extra rows are filled as -1
| Pixel properties | Quadrant properties | ||||||
|---|---|---|---|---|---|---|---|
| Quadrant | DetID | PixID | Counts | Sigma | Mean | Median | Sigma |
| A | 0 | 29 | 882 | 10.03 | 252 | 235 | 64.5 |
| A | 7 | 110 | 787 | 8.56 | 252 | 235 | 64.5 |
| A | 15 | 236 | 740 | 7.83 | 252 | 235 | 64.5 |
| B | 2 | 9 | 846 | 12.0 | 245 | 233 | 51.1 |
| B | 2 | 8 | 702 | 9.18 | 245 | 233 | 51.1 |
| B | 5 | 225 | 625 | 7.67 | 245 | 233 | 51.1 |
| C | 1 | 81 | 692 | 7.1 | 247 | 231 | 64.9 |
| C | 1 | 80 | 688 | 7.04 | 247 | 231 | 64.9 |
| C | 12 | 241 | 663 | 6.66 | 247 | 231 | 64.9 |
| D | 3 | 14 | 616 | 6.21 | 235 | 214 | 64.8 |
| D | 10 | 190 | 612 | 6.15 | 235 | 214 | 64.8 |
| D | 7 | 3 | 611 | 6.13 | 235 | 214 | 64.8 |
Histogram calculated using DETX and DETY for each event in the final _common_clean file
| Quadrant A | 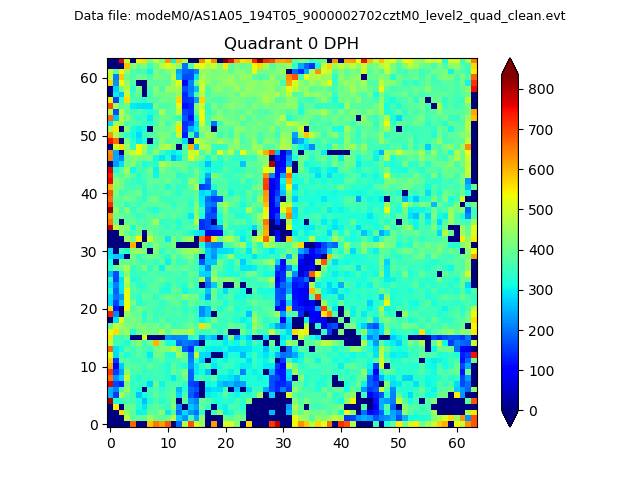 |
 |
Quadrant B |
|---|---|---|---|
| Quadrant D |  |
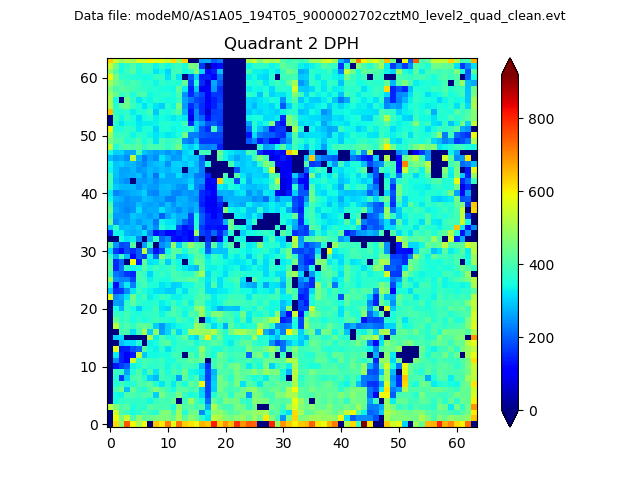 |
Quadrant C |
| Plot type | Count rate plots | Images |
|---|---|---|
| Comparison with Poisson distribution Blue bars denote a histogram of data divided into 1 sec bins. Red curve is a Poisson curve with rate = median count rate of data. |
 |
 |
| Quadrant-wise count rates Data is divided into 100 sec bins |
 |
|
| Module-wise count rates for Quadrant A Data is divided into 100 sec bins |
 |
 |
| Module-wise count rates for Quadrant B Data is divided into 100 sec bins |
 |
 |
| Module-wise count rates for Quadrant C Data is divided into 100 sec bins |
 |
 |
| Module-wise count rates for Quadrant D Data is divided into 100 sec bins |
 |
 |
| Parameter | Plot |
|---|---|
| CZT HV Monitor |  |
| D_VDD | 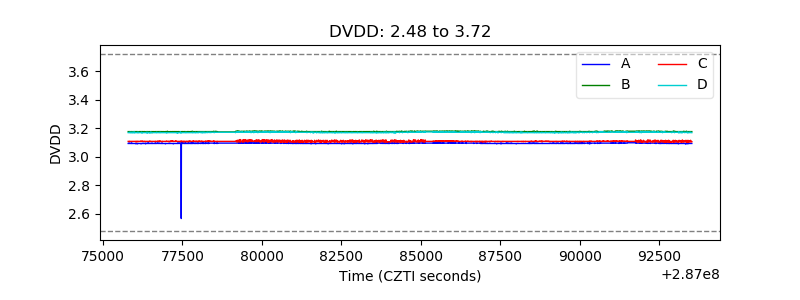 |
| Temperature 1 |  |
| Veto HV Monitor |  |
| Veto LLD | 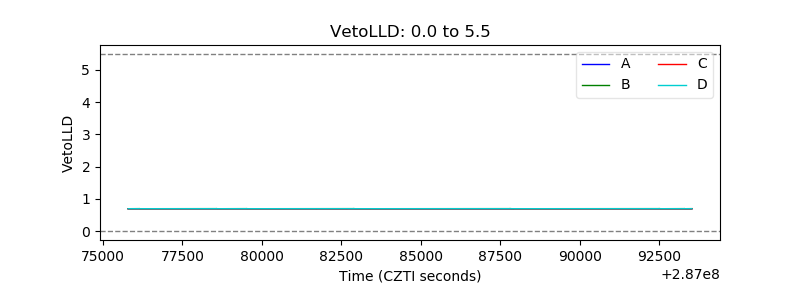 |
| Alpha Counter |  |
| _CPM_Rate |  |
| CZT Counter |  |
| +2.5 Volts monitor |  |
| +5 Volts monitor |  |
| _ROLL_ROT | 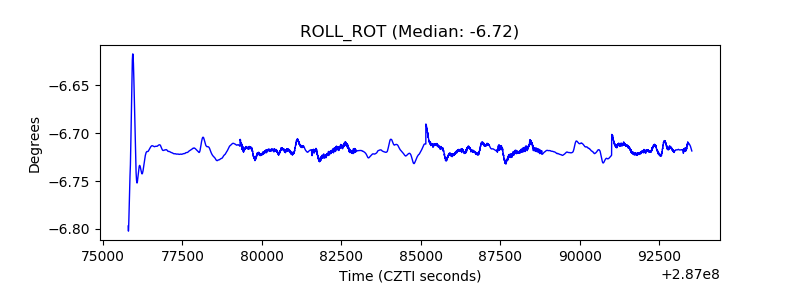 |
| _Roll_DEC |  |
| _Roll_RA |  |
| Veto Counter |  |