| Param | Original file | Final file |
|---|---|---|
| Filename | modeM0/AS1A05_194T05_9000002702_18155cztM0_level2.evt | modeM0/AS1A05_194T05_9000002702_18155cztM0_level2_quad_clean.evt |
| Size (bytes) | 615,116,160 | 88,162,560 |
| Size | 586.6 MB | 84.1 MB |
| Events in quadrant A | 3,967,549 | 535,575 |
| Events in quadrant B | 4,189,929 | 542,006 |
| Events in quadrant C | 4,122,854 | 526,083 |
| Events in quadrant D | 5,811,831 | 515,476 |
| Mode M0 | |||
|---|---|---|---|
| Quadrant | BADHDUFLAG | Total packets | Discarded packets |
| A | 0 | 16961 | 2 |
| B | 0 | 17523 | 2 |
| C | 0 | 17258 | 2 |
| D | 0 | 22814 | 2 |
| Mode SS | |||
|---|---|---|---|
| Quadrant | BADHDUFLAG | Total packets | Discarded packets |
| A | 0 | 166 | 0 |
| B | 0 | 166 | 0 |
| C | 0 | 166 | 0 |
| D | 0 | 166 | 0 |
| Mode M9 | |||
|---|---|---|---|
| Quadrant | BADHDUFLAG | Total packets | Discarded packets |
| A | 0 | 8 | 0 |
| B | 0 | 8 | 0 |
| C | 0 | 8 | 0 |
| D | 0 | 8 | 0 |
| Quadrant | Total seconds | Saturated seconds | Saturation percentage |
|---|---|---|---|
| A | 7913 | 139 | 1.756603% |
| B | 7914 | 216 | 2.729340% |
| C | 7913 | 272 | 3.437382% |
| D | 7913 | 297 | 3.753317% |
Noise dominated data is calculated using 1-second bins in cleaned event files. If a bin has >2000 counts, and if more than 50% of those come from <1% of pixels, then it is considered to be noise-dominated and hence unusable.
| Quadrant | # 1 sec bins | Bins with >0 counts | Bins with >2000 counts | High rate bins dominated by noise | Noise dominated (total time) | Noise dominated (detector-on time) | Marked lightcurve |
|---|---|---|---|---|---|---|---|
| A | 8713 | 7916 | 4 | 4 | 0.05% | 0.05% | 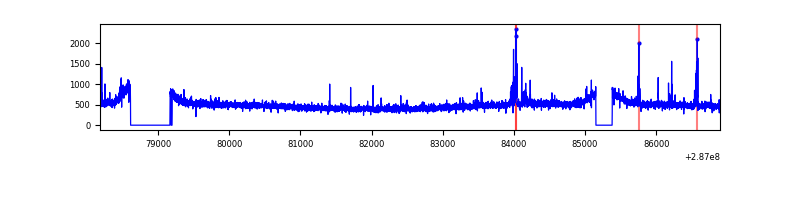 |
| B | 8714 | 7917 | 5 | 5 | 0.06% | 0.06% | 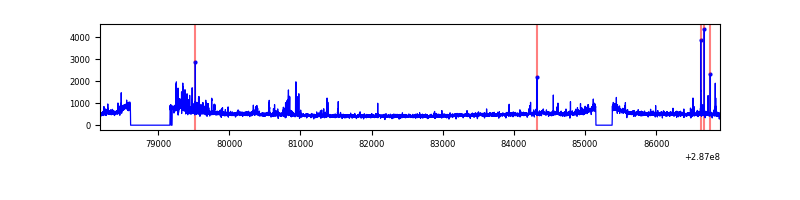 |
| C | 8713 | 7916 | 20 | 20 | 0.23% | 0.25% | 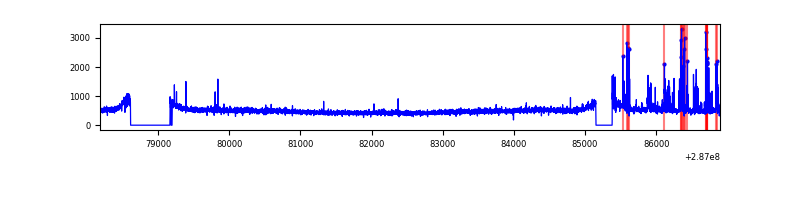 |
| D | 8713 | 7916 | 61 | 61 | 0.70% | 0.77% | 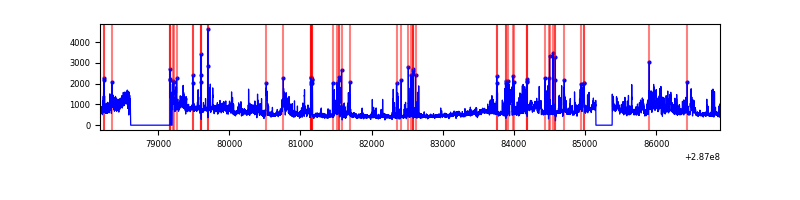 |
Top three noisy pixels from each quadrant. If the there are fewer than three noisy pixels in the level2.evt file, extra rows are filled as -1
| Pixel properties | Quadrant properties | ||||||
|---|---|---|---|---|---|---|---|
| Quadrant | DetID | PixID | Counts | Sigma | Mean | Median | Sigma |
| A | 15 | 174 | 70813 | 339.79 | 1001 | 976 | 205.5 |
| A | 4 | 2 | 50680 | 241.83 | 1001 | 976 | 205.5 |
| A | 0 | 226 | 8968 | 38.89 | 1001 | 976 | 205.5 |
| B | 7 | 220 | 150383 | 778.59 | 996 | 970 | 191.9 |
| B | 0 | 197 | 30106 | 151.83 | 996 | 970 | 191.9 |
| B | 4 | 216 | 24548 | 122.86 | 996 | 970 | 191.9 |
| C | 4 | 254 | 202889 | 899.92 | 954 | 960 | 224.4 |
| C | 14 | 238 | 146196 | 647.26 | 954 | 960 | 224.4 |
| C | 3 | 233 | 18080 | 76.3 | 954 | 960 | 224.4 |
| D | 7 | 238 | 1315643 | 5519.22 | 969 | 940 | 238.2 |
| D | 13 | 187 | 487902 | 2044.3 | 969 | 940 | 238.2 |
| D | 12 | 233 | 68931 | 285.43 | 969 | 940 | 238.2 |
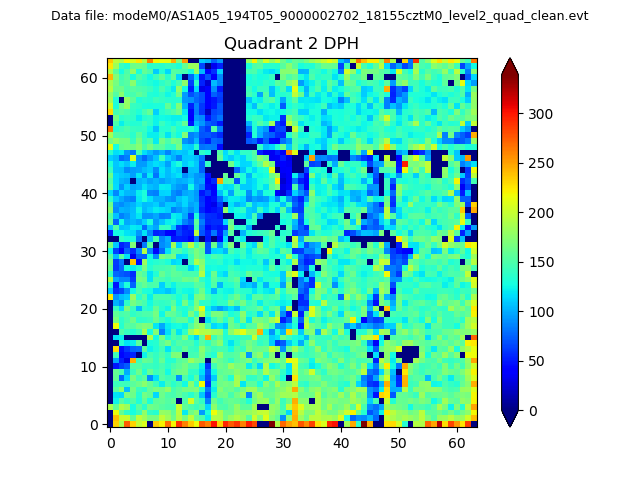
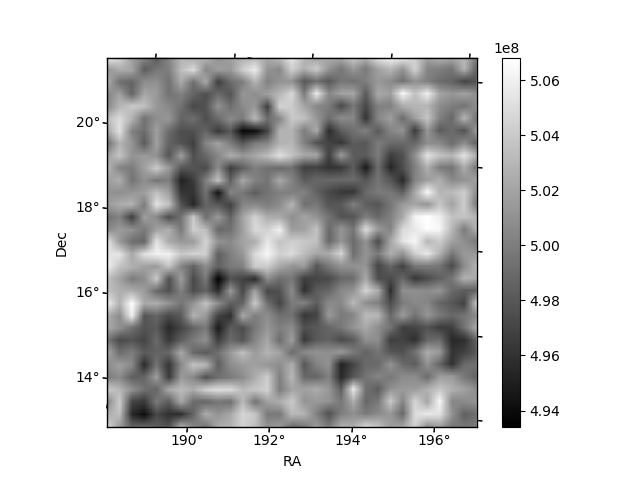
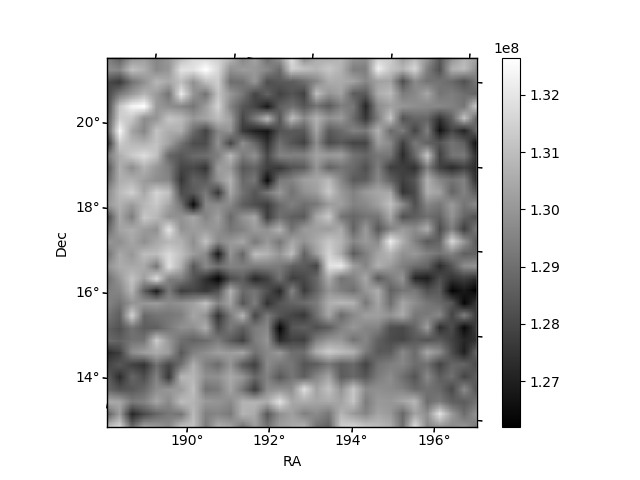
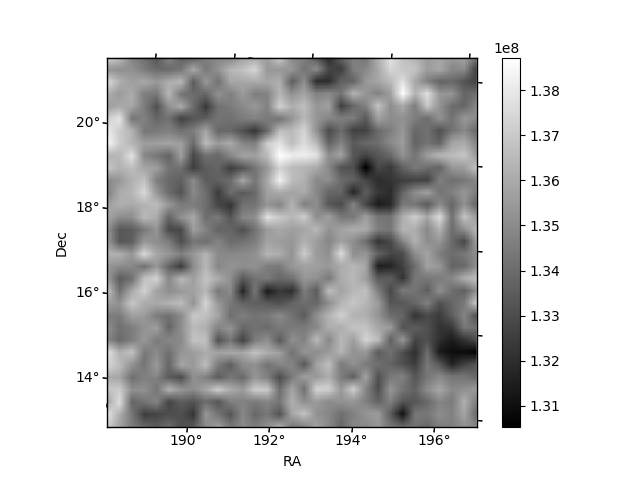
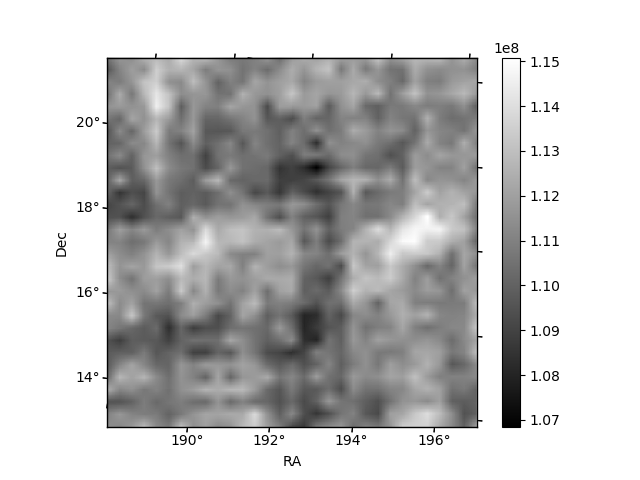
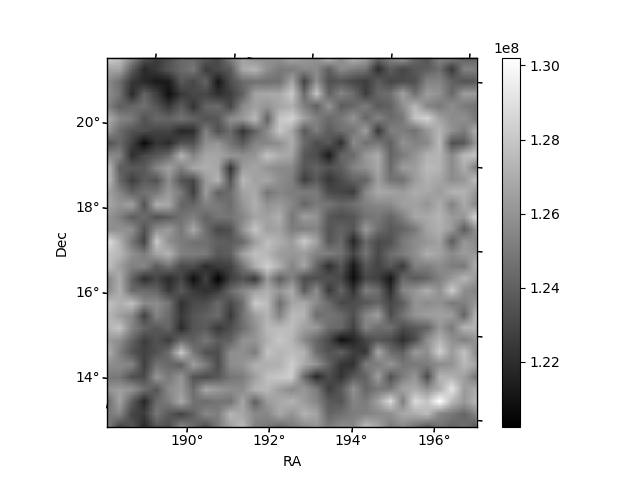
Histogram calculated using DETX and DETY for each event in the final _common_clean file
| Quadrant A | 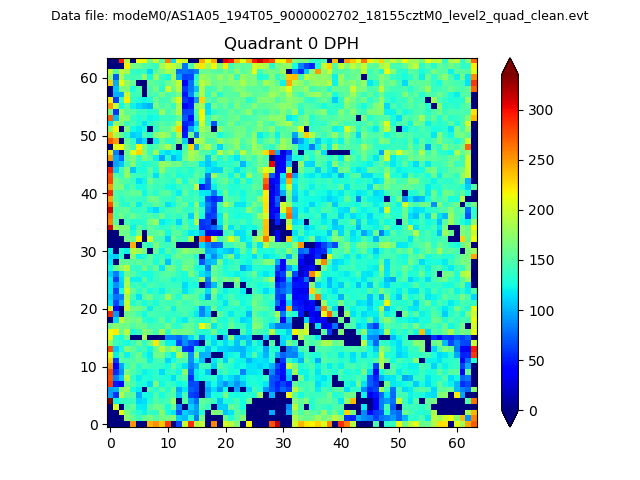 |
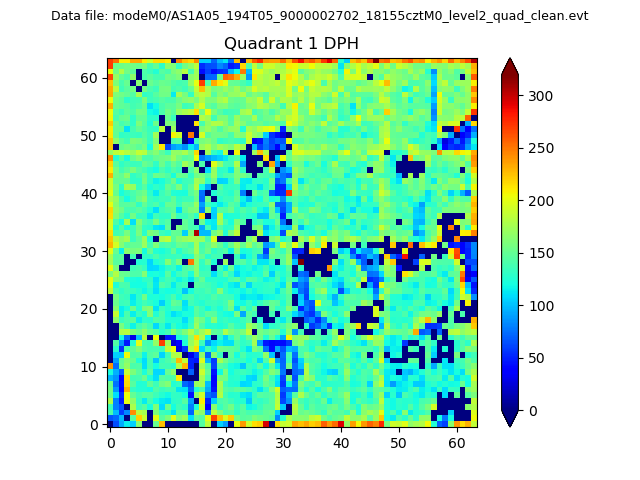 |
Quadrant B |
|---|---|---|---|
| Quadrant D | 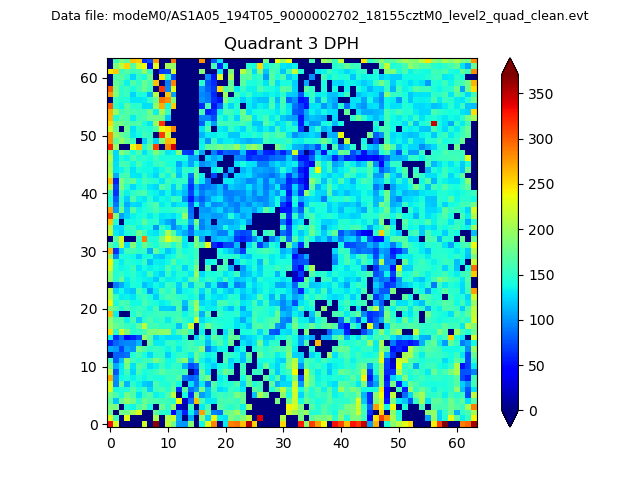 |
 |
Quadrant C |
| Plot type | Count rate plots | Images |
|---|---|---|
| Comparison with Poisson distribution Blue bars denote a histogram of data divided into 1 sec bins. Red curve is a Poisson curve with rate = median count rate of data. |
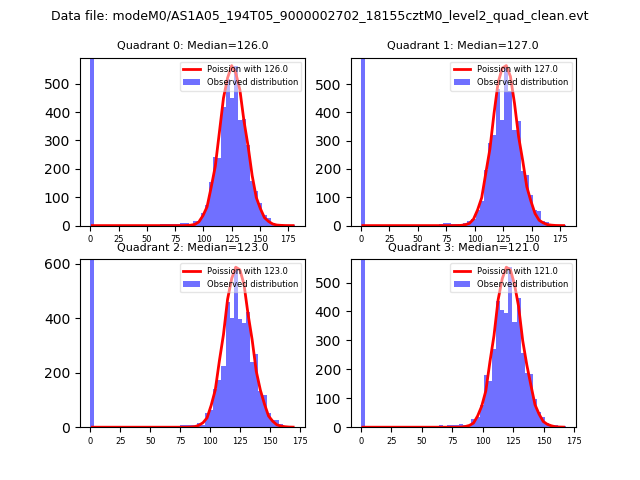 |
 |
| Quadrant-wise count rates Data is divided into 100 sec bins |
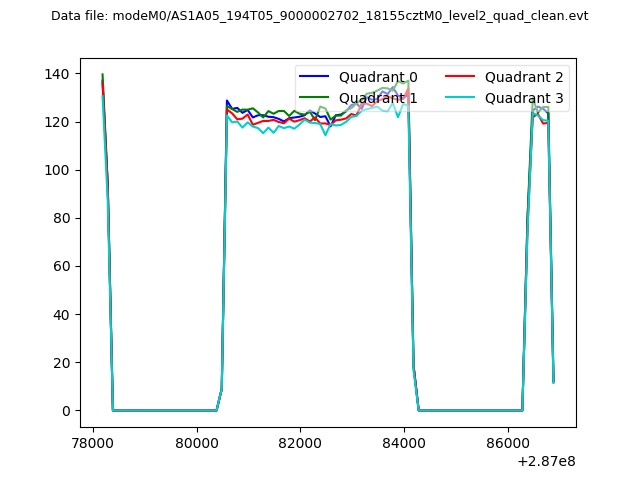 |
|
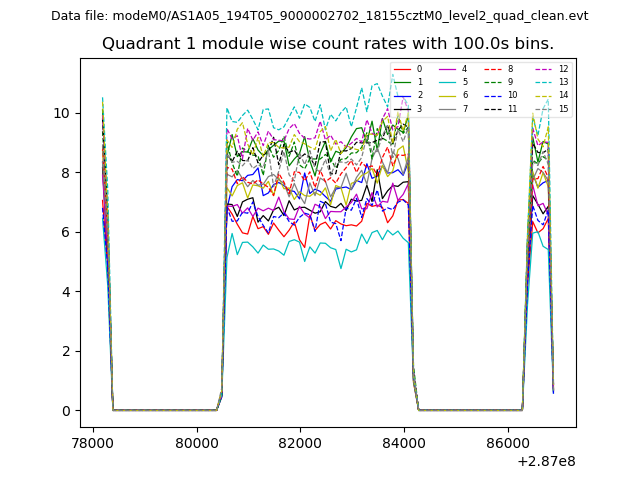
| Module-wise count rates for Quadrant A Data is divided into 100 sec bins |
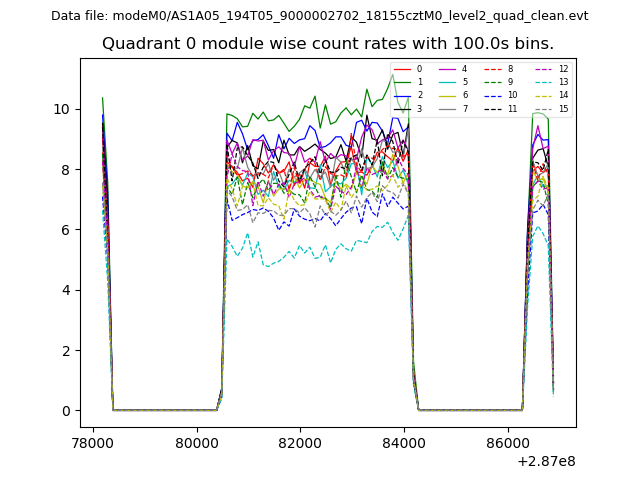 |
 |
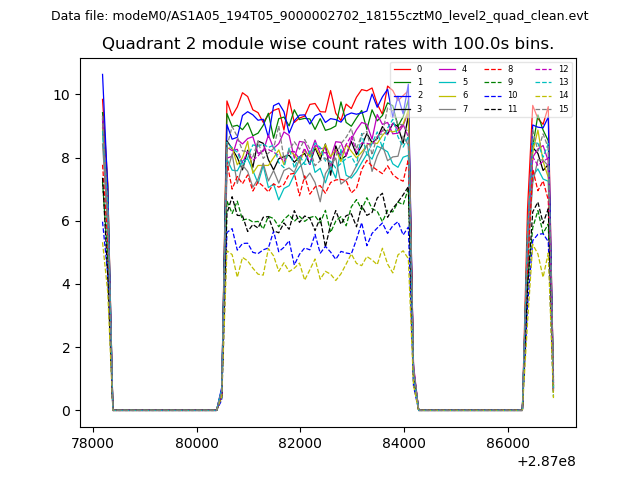
| Module-wise count rates for Quadrant B Data is divided into 100 sec bins |
 |
 |
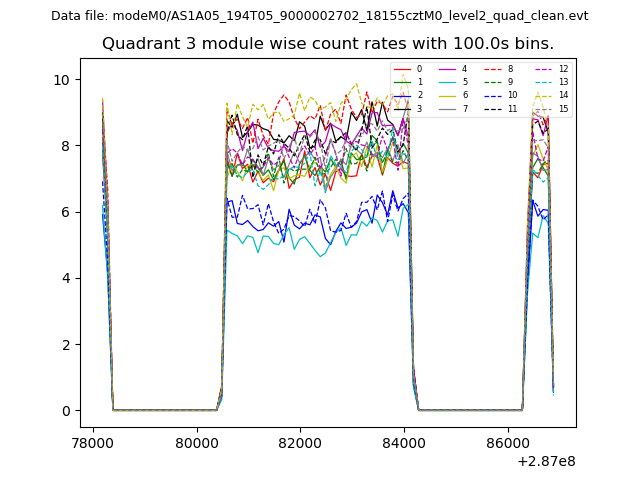
| Module-wise count rates for Quadrant C Data is divided into 100 sec bins |
 |
 |
| Module-wise count rates for Quadrant D Data is divided into 100 sec bins |
 |
 |
| Parameter | Plot |
|---|---|
| CZT HV Monitor | 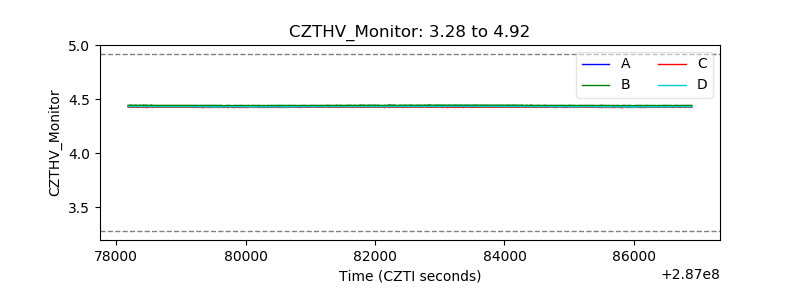 |
| D_VDD | 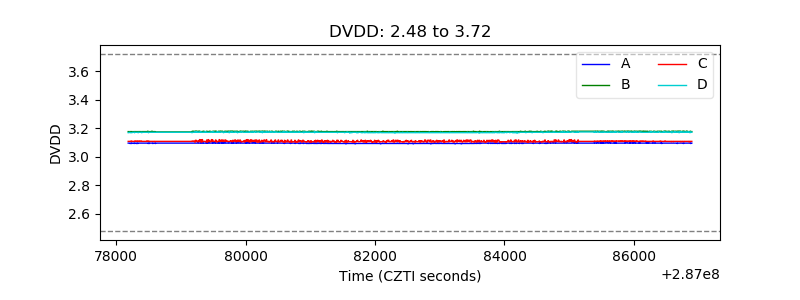 |
| Temperature 1 | 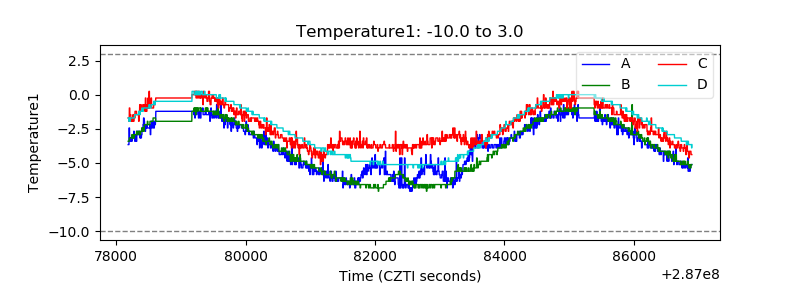 |
| Veto HV Monitor | 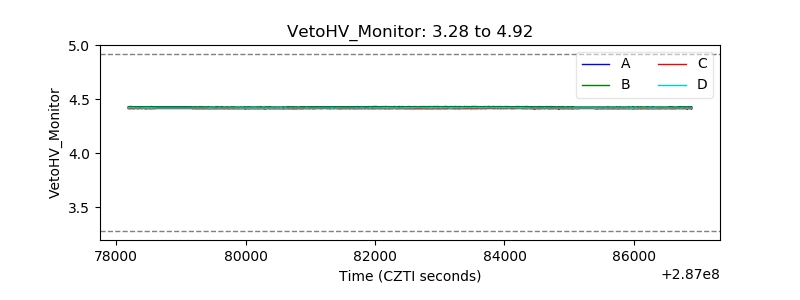 |
| Veto LLD | 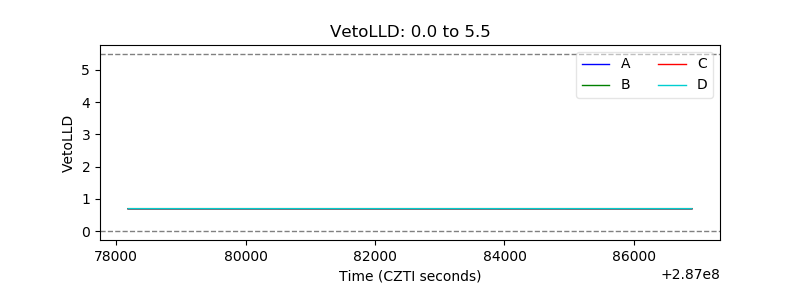 |
| Alpha Counter | 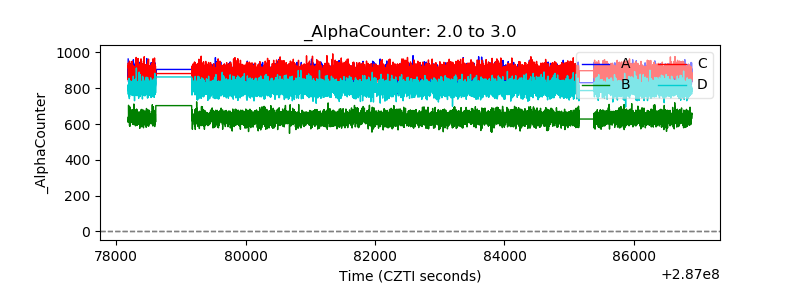 |
| _CPM_Rate | 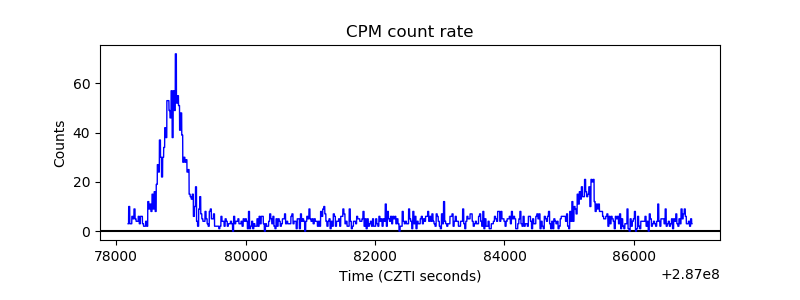 |
| CZT Counter | 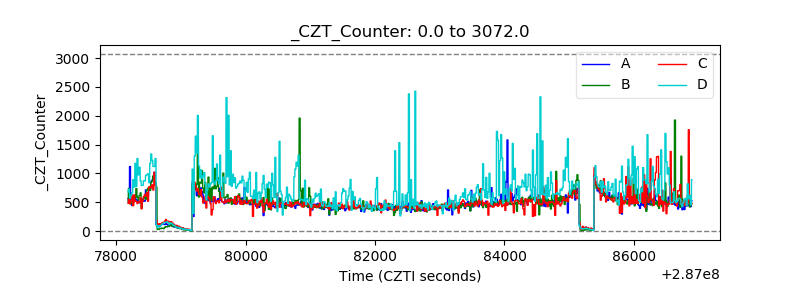 |
| +2.5 Volts monitor |  |
| +5 Volts monitor |  |
| _ROLL_ROT | 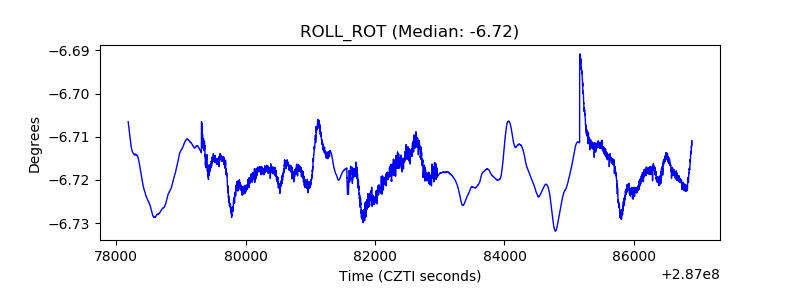 |
| _Roll_DEC | 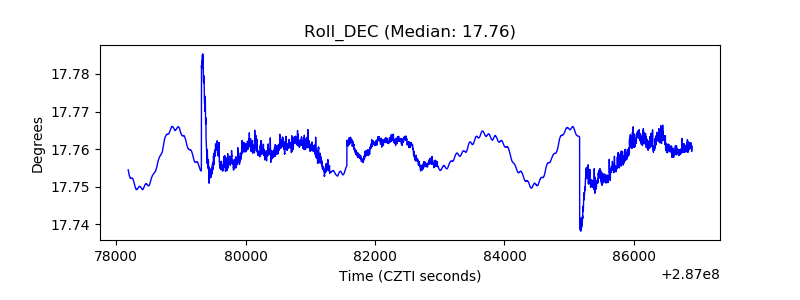 |
| _Roll_RA | 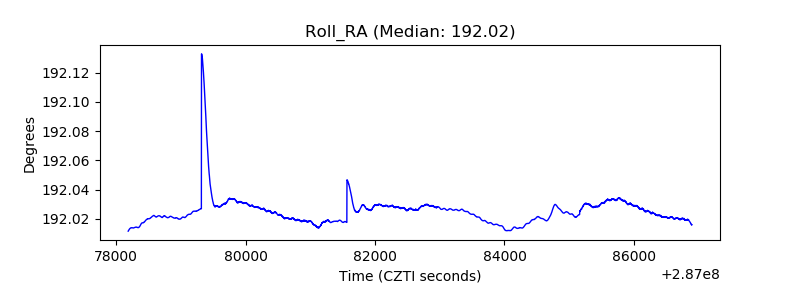 |
| Veto Counter | 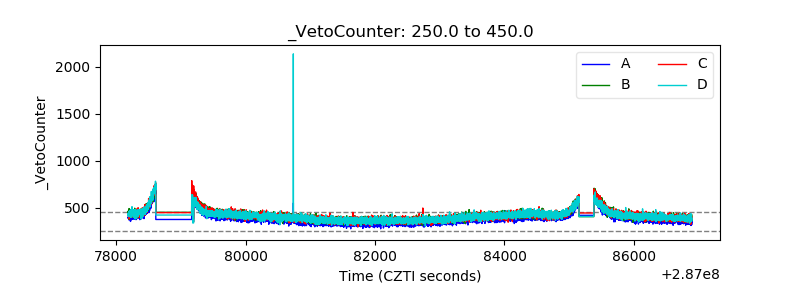 |