| Param | Original file | Final file |
|---|---|---|
| Filename | modeM0/AS1A05_194T05_9000002702_18160cztM0_level2.evt | modeM0/AS1A05_194T05_9000002702_18160cztM0_level2_quad_clean.evt |
| Size (bytes) | 221,996,160 | 25,989,120 |
| Size | 211.7 MB | 24.8 MB |
| Events in quadrant A | 1,300,026 | 155,974 |
| Events in quadrant B | 1,307,866 | 158,594 |
| Events in quadrant C | 1,874,095 | 147,158 |
| Events in quadrant D | 2,071,465 | 147,045 |
| Mode M0 | |||
|---|---|---|---|
| Quadrant | BADHDUFLAG | Total packets | Discarded packets |
| A | 0 | 5428 | 1 |
| B | 0 | 5408 | 1 |
| C | 0 | 7155 | 1 |
| D | 0 | 7892 | 1 |
| Mode SS | |||
|---|---|---|---|
| Quadrant | BADHDUFLAG | Total packets | Discarded packets |
| A | 0 | 52 | 0 |
| B | 0 | 52 | 0 |
| C | 0 | 52 | 0 |
| D | 0 | 52 | 0 |
| Mode M9 | |||
|---|---|---|---|
| Quadrant | BADHDUFLAG | Total packets | Discarded packets |
| A | 0 | 2 | 0 |
| B | 0 | 2 | 0 |
| C | 0 | 2 | 0 |
| D | 0 | 2 | 0 |
| Quadrant | Total seconds | Saturated seconds | Saturation percentage |
|---|---|---|---|
| A | 2468 | 82 | 3.322528% |
| B | 2469 | 87 | 3.523694% |
| C | 2469 | 253 | 10.247064% |
| D | 2469 | 162 | 6.561361% |
Noise dominated data is calculated using 1-second bins in cleaned event files. If a bin has >2000 counts, and if more than 50% of those come from <1% of pixels, then it is considered to be noise-dominated and hence unusable.
| Quadrant | # 1 sec bins | Bins with >0 counts | Bins with >2000 counts | High rate bins dominated by noise | Noise dominated (total time) | Noise dominated (detector-on time) | Marked lightcurve |
|---|---|---|---|---|---|---|---|
| A | 2708 | 2469 | 10 | 10 | 0.37% | 0.41% | 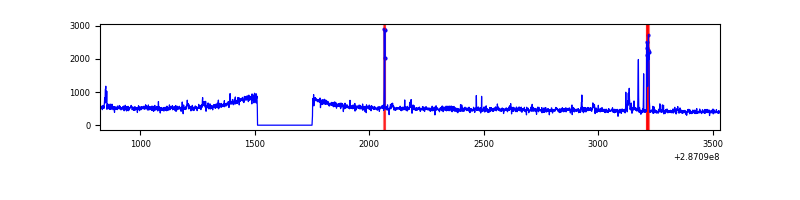 |
| B | 2709 | 2470 | 3 | 3 | 0.11% | 0.12% | 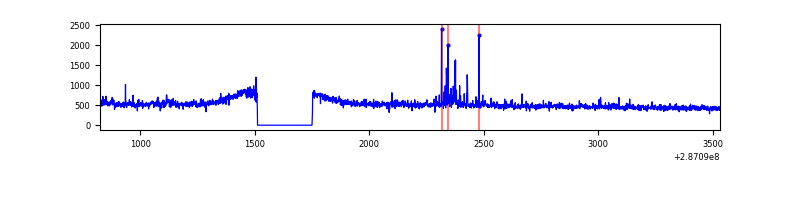 |
| C | 2709 | 2470 | 84 | 84 | 3.10% | 3.40% | 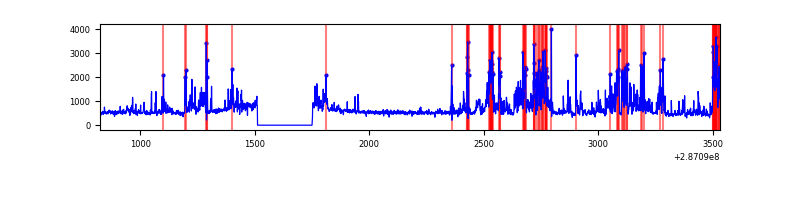 |
| D | 2709 | 2470 | 87 | 87 | 3.21% | 3.52% | 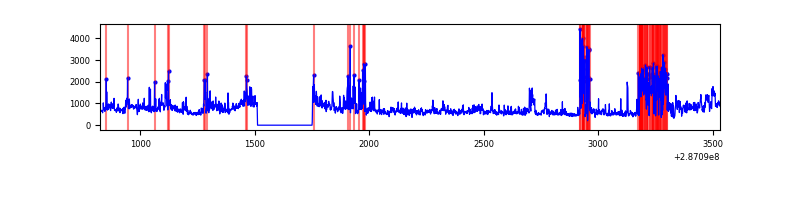 |
Top three noisy pixels from each quadrant. If the there are fewer than three noisy pixels in the level2.evt file, extra rows are filled as -1
| Pixel properties | Quadrant properties | ||||||
|---|---|---|---|---|---|---|---|
| Quadrant | DetID | PixID | Counts | Sigma | Mean | Median | Sigma |
| A | 15 | 174 | 57480 | 841.53 | 321 | 313 | 67.9 |
| A | 0 | 31 | 3801 | 51.35 | 321 | 313 | 67.9 |
| A | 0 | 226 | 2871 | 37.66 | 321 | 313 | 67.9 |
| B | 0 | 197 | 25705 | 386.3 | 324 | 315 | 65.7 |
| B | 12 | 111 | 7521 | 109.64 | 324 | 315 | 65.7 |
| B | 11 | 111 | 6329 | 91.5 | 324 | 315 | 65.7 |
| C | 4 | 254 | 623449 | 8505.5 | 304 | 305 | 73.3 |
| C | 14 | 238 | 46134 | 625.54 | 304 | 305 | 73.3 |
| C | 5 | 218 | 8440 | 111.04 | 304 | 305 | 73.3 |
| D | 7 | 238 | 629343 | 7988.74 | 309 | 298 | 78.7 |
| D | 12 | 233 | 68498 | 866.13 | 309 | 298 | 78.7 |
| D | 12 | 110 | 50032 | 631.61 | 309 | 298 | 78.7 |
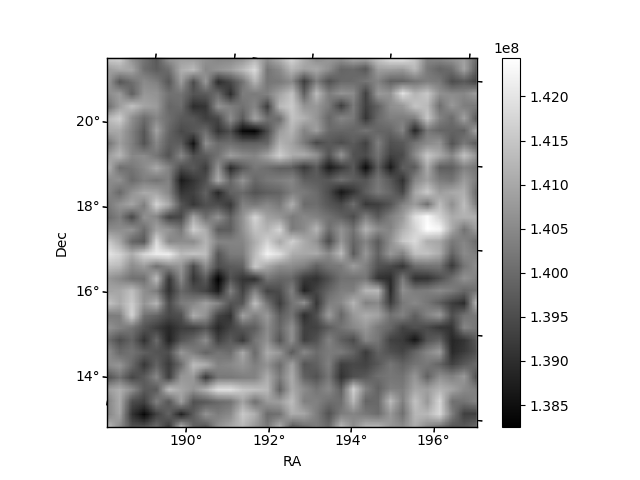
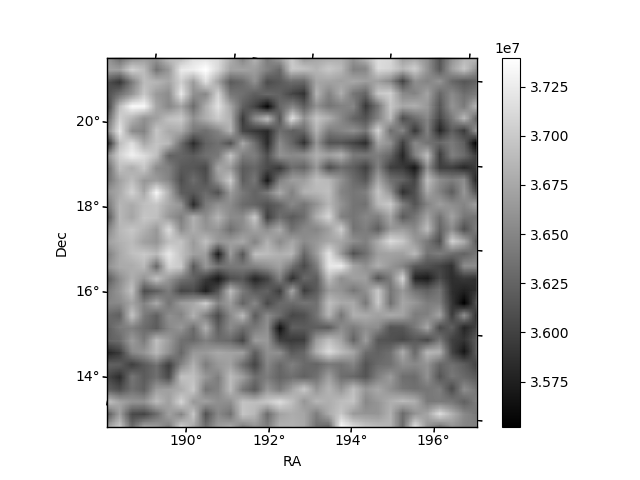
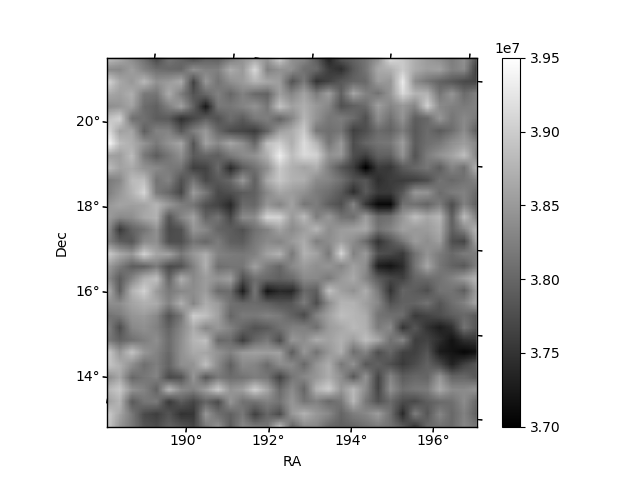
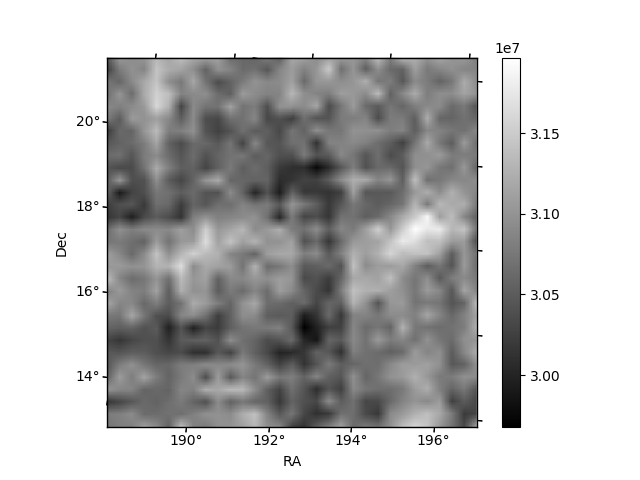
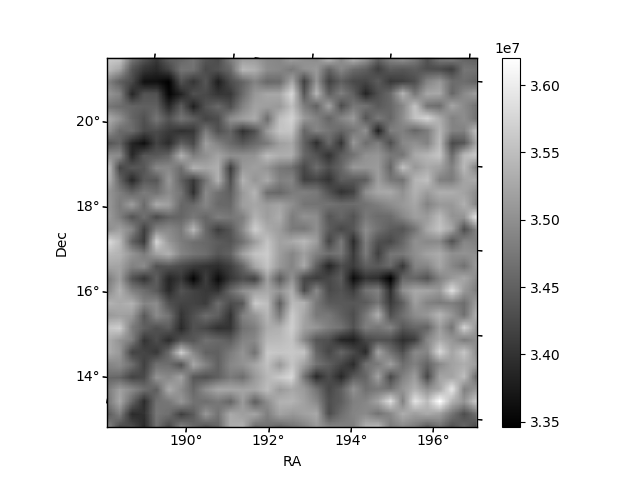
Histogram calculated using DETX and DETY for each event in the final _common_clean file
| Quadrant A | 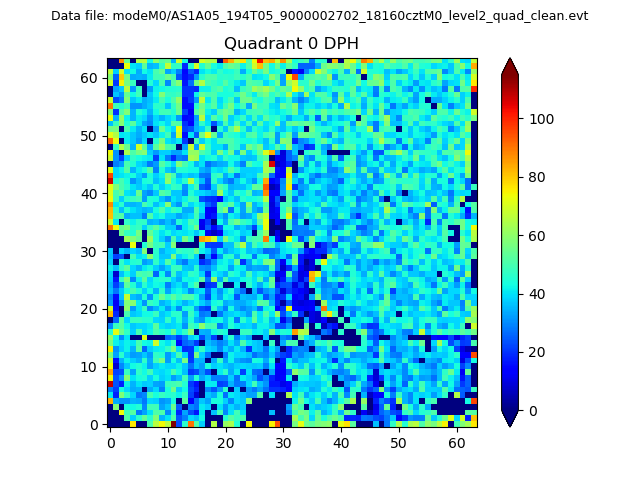 |
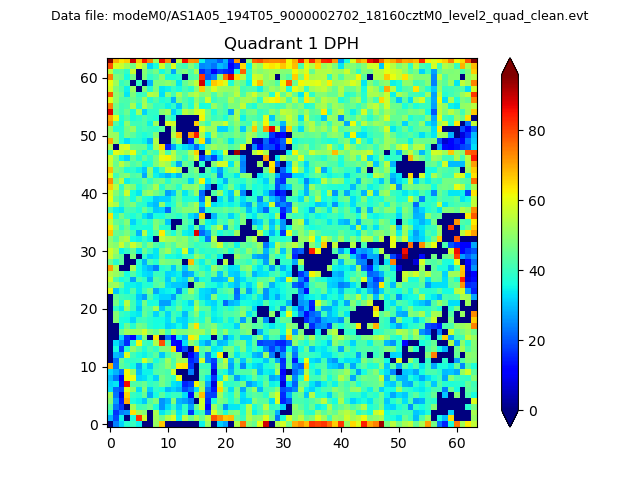 |
Quadrant B |
|---|---|---|---|
| Quadrant D | 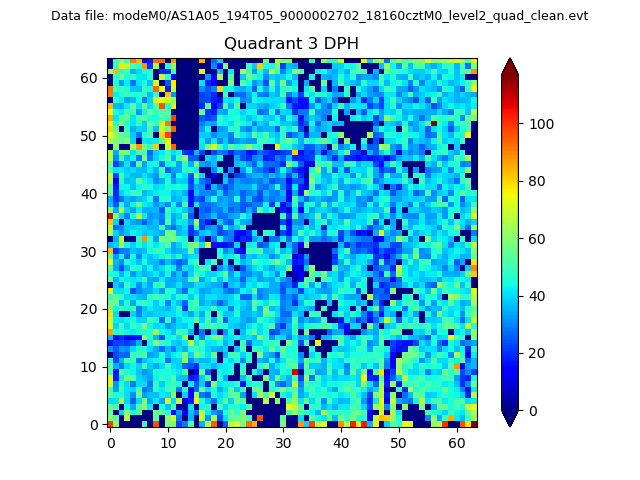 |
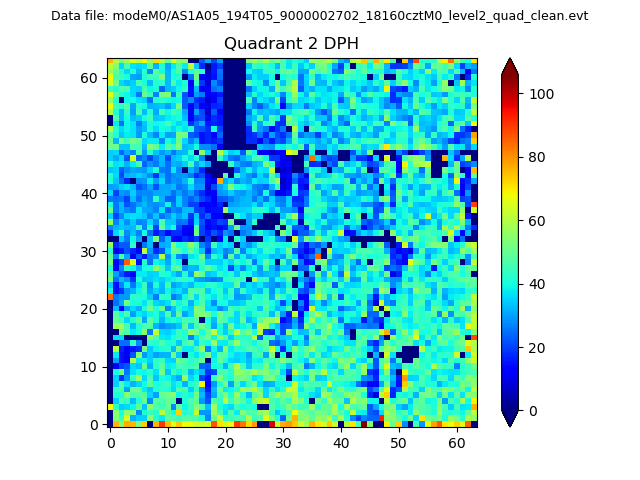 |
Quadrant C |
| Plot type | Count rate plots | Images |
|---|---|---|
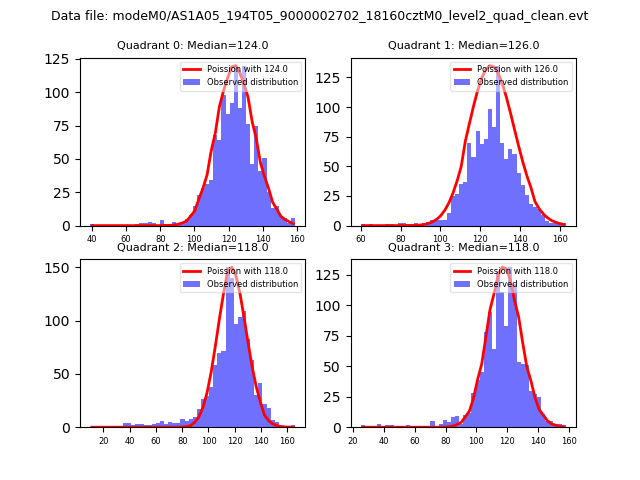
| Comparison with Poisson distribution Blue bars denote a histogram of data divided into 1 sec bins. Red curve is a Poisson curve with rate = median count rate of data. |
 |
 |
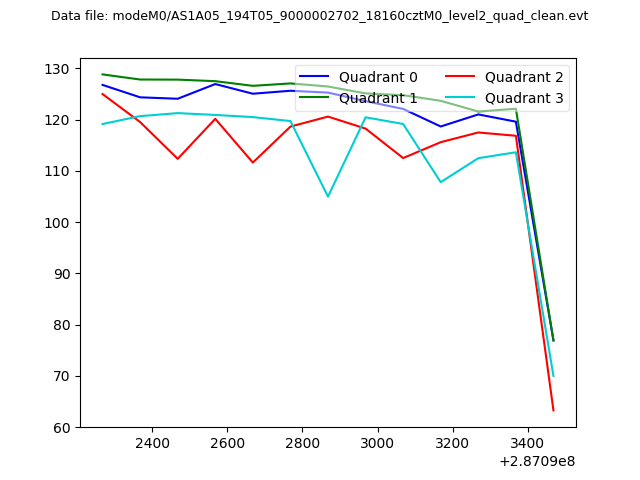
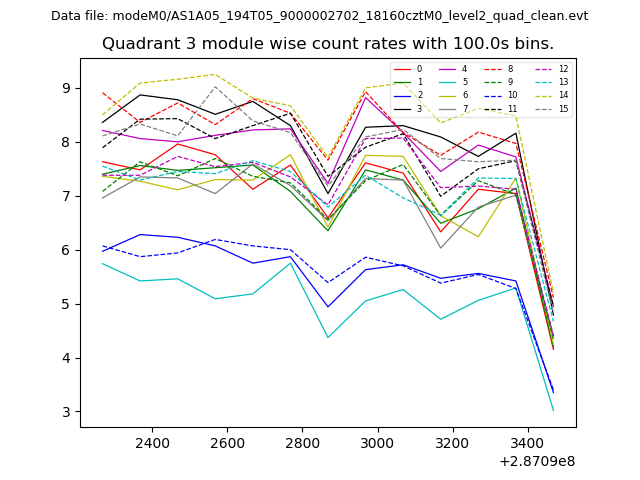
| Quadrant-wise count rates Data is divided into 100 sec bins |
 |
|
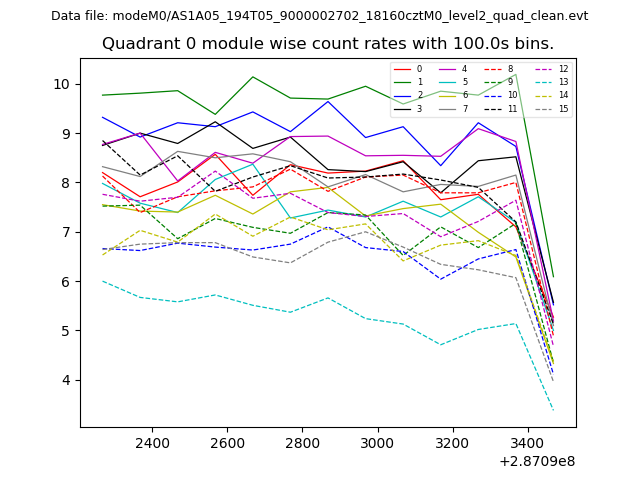
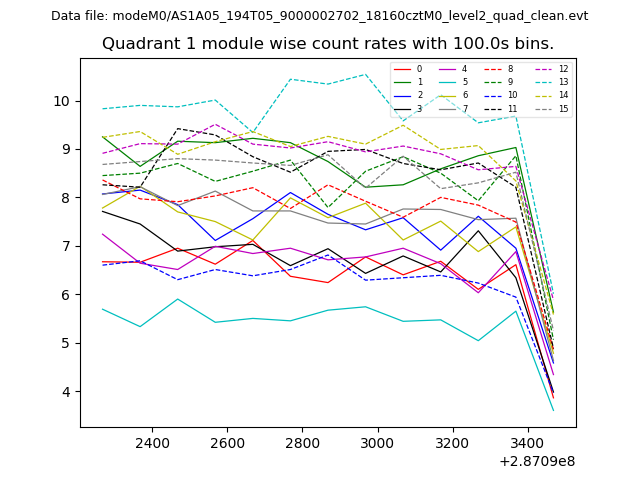
| Module-wise count rates for Quadrant A Data is divided into 100 sec bins |
 |
 |
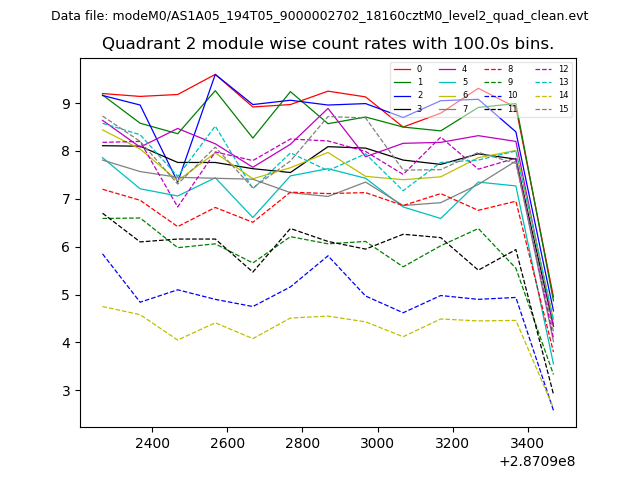
| Module-wise count rates for Quadrant B Data is divided into 100 sec bins |
 |
 |
| Module-wise count rates for Quadrant C Data is divided into 100 sec bins |
 |
 |
| Module-wise count rates for Quadrant D Data is divided into 100 sec bins |
 |
 |
| Parameter | Plot |
|---|---|
| CZT HV Monitor | 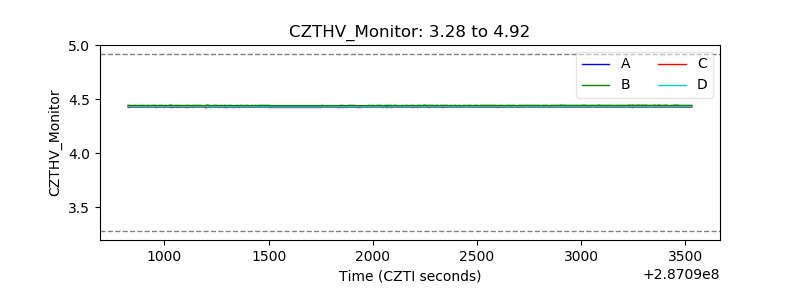 |
| D_VDD | 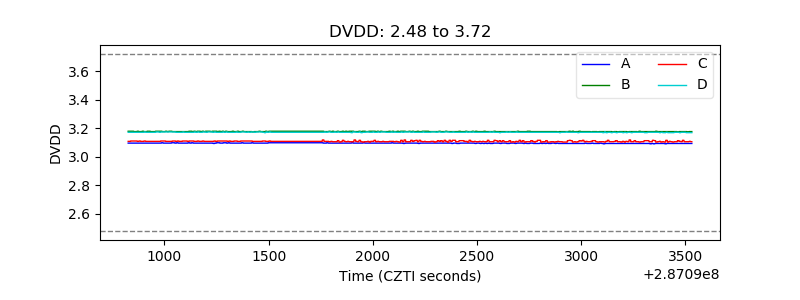 |
| Temperature 1 | 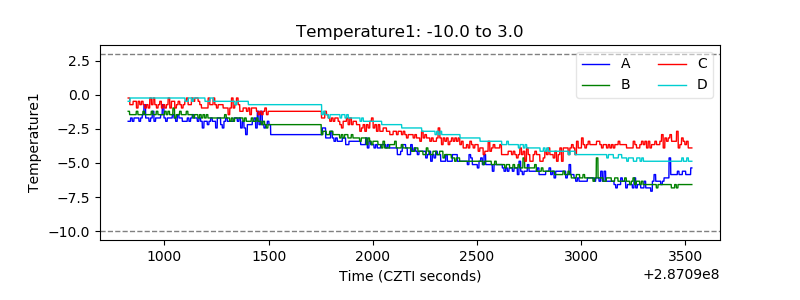 |
| Veto HV Monitor | 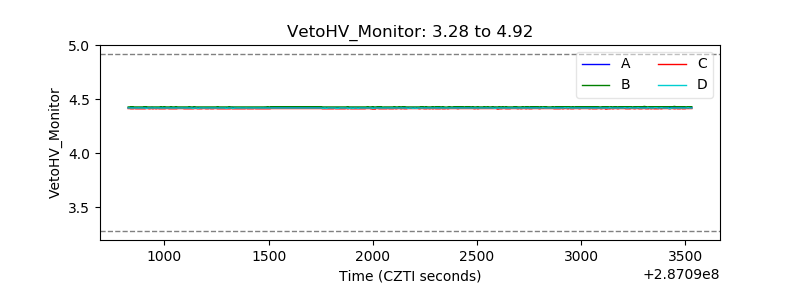 |
| Veto LLD | 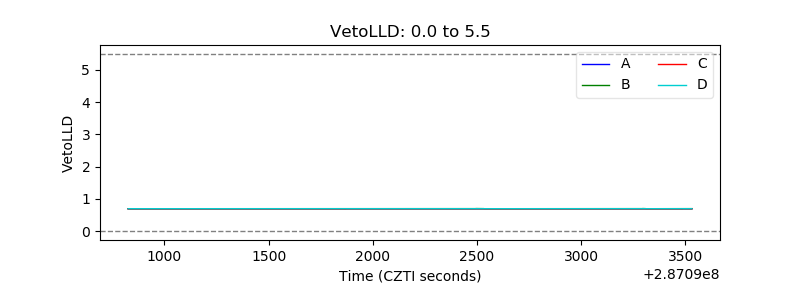 |
| Alpha Counter | 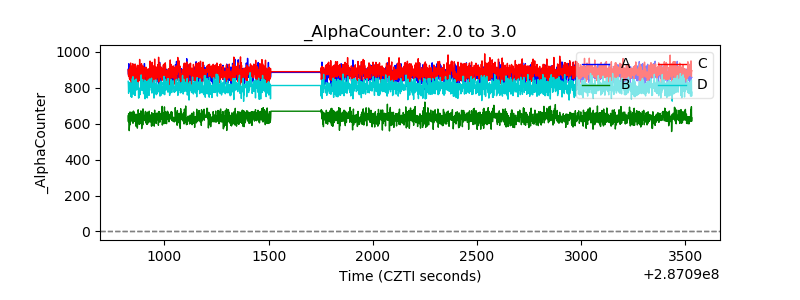 |
| _CPM_Rate | 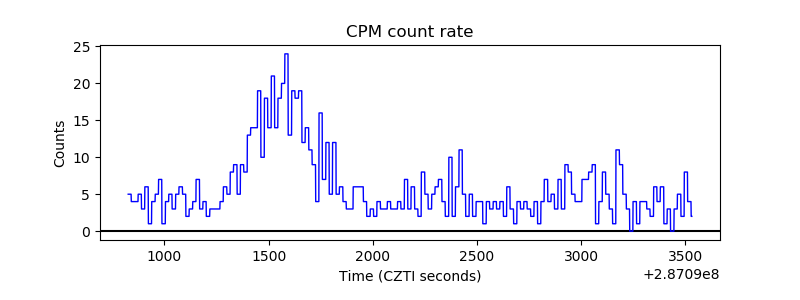 |
| CZT Counter | 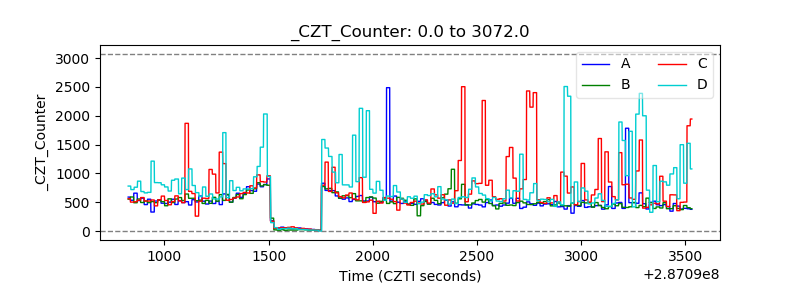 |
| +2.5 Volts monitor |  |
| +5 Volts monitor |  |
| _ROLL_ROT | 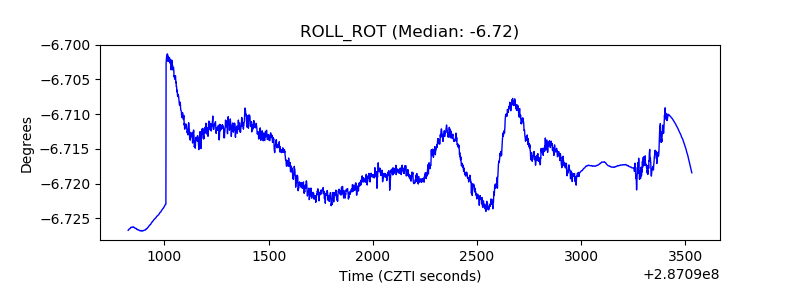 |
| _Roll_DEC | 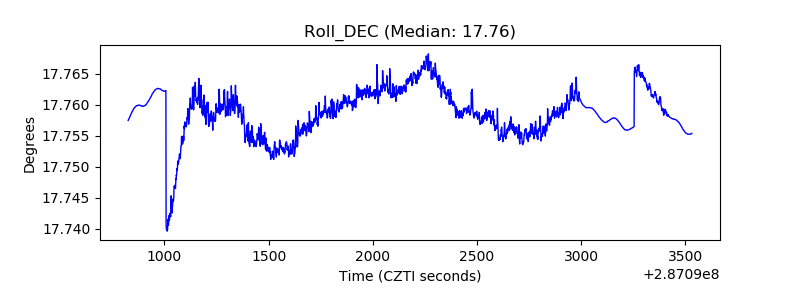 |
| _Roll_RA | 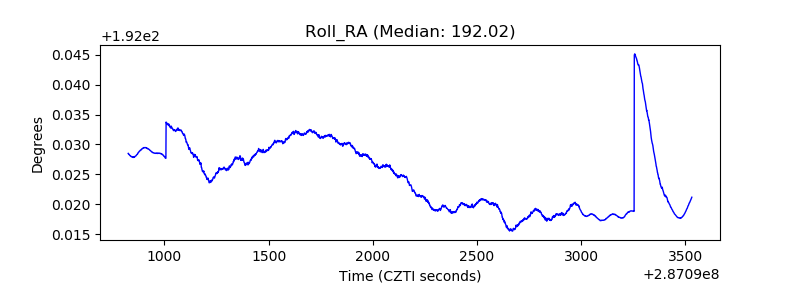 |
| Veto Counter | 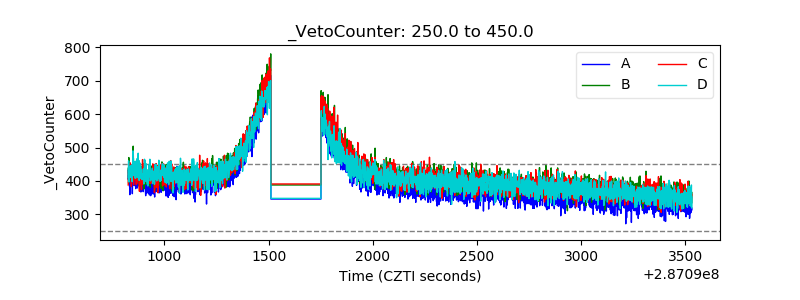 |