| Param | Original file | Final file |
|---|---|---|
| Filename | modeM0/AS1T03_014T01_9000002704cztM0_level2.fits | modeM0/AS1T03_014T01_9000002704cztM0_level2_quad_clean.evt |
| Size (bytes) | 494,562,240 | 329,472,000 |
| Size | 471.7 MB | 314.2 MB |
| Events in quadrant A | 3,077,482 | 1,693,343 |
| Events in quadrant B | 2,939,460 | 1,724,390 |
| Events in quadrant C | 2,973,036 | 1,643,991 |
| Events in quadrant D | 2,618,166 | 1,544,383 |
| Mode M9 | |||
|---|---|---|---|
| Quadrant | BADHDUFLAG | Total packets | Discarded packets |
| A | 0 | 89 | 0 |
| B | 0 | 89 | 0 |
| C | 0 | 89 | 0 |
| D | 0 | 89 | 0 |
| Mode SS | |||
|---|---|---|---|
| Quadrant | BADHDUFLAG | Total packets | Discarded packets |
| A | 0 | 1002 | 0 |
| B | 0 | 1002 | 0 |
| C | 0 | 1002 | 0 |
| D | 0 | 1002 | 0 |
| Mode M0 | |||
|---|---|---|---|
| Quadrant | BADHDUFLAG | Total packets | Discarded packets |
| A | 0 | 110832 | 0 |
| B | 0 | 104667 | 0 |
| C | 0 | 112029 | 0 |
| D | 0 | 130371 | 0 |
| Quadrant | Total seconds | Saturated seconds | Saturation percentage |
|---|---|---|---|
| A | 49093 | 1064 | 2.167315% |
| B | 49093 | 598 | 1.218096% |
| C | 49093 | 1445 | 2.943393% |
| D | 49093 | 1005 | 2.047135% |
Noise dominated data is calculated using 1-second bins in cleaned event files. If a bin has >2000 counts, and if more than 50% of those come from <1% of pixels, then it is considered to be noise-dominated and hence unusable.
| Quadrant | # 1 sec bins | Bins with >0 counts | Bins with >2000 counts | High rate bins dominated by noise | Noise dominated (total time) | Noise dominated (detector-on time) | Marked lightcurve |
|---|---|---|---|---|---|---|---|
| A | 58128 | 49092 | 0 | 0 | 0.00% | 0.00% |  |
| B | 58128 | 49093 | 0 | 0 | 0.00% | 0.00% |  |
| C | 58128 | 49075 | 0 | 0 | 0.00% | 0.00% |  |
| D | 58128 | 49086 | 0 | 0 | 0.00% | 0.00% |  |
Top three noisy pixels from each quadrant. If the there are fewer than three noisy pixels in the level2.evt file, extra rows are filled as -1
| Pixel properties | Quadrant properties | ||||||
|---|---|---|---|---|---|---|---|
| Quadrant | DetID | PixID | Counts | Sigma | Mean | Median | Sigma |
| A | 0 | 29 | 2887 | 10.81 | 800 | 751 | 197.6 |
| A | 7 | 110 | 2366 | 8.17 | 800 | 751 | 197.6 |
| A | 0 | 30 | 2309 | 7.88 | 800 | 751 | 197.6 |
| B | 2 | 9 | 2504 | 11.37 | 776 | 742 | 154.9 |
| B | 2 | 8 | 2108 | 8.82 | 776 | 742 | 154.9 |
| B | 14 | 254 | 1918 | 7.59 | 776 | 742 | 154.9 |
| C | 1 | 81 | 2334 | 7.93 | 785 | 734 | 201.7 |
| C | 1 | 80 | 2261 | 7.57 | 785 | 734 | 201.7 |
| C | 12 | 241 | 2052 | 6.54 | 785 | 734 | 201.7 |
| D | 10 | 190 | 1920 | 6.27 | 747 | 680 | 197.7 |
| D | 6 | 67 | 1905 | 6.2 | 747 | 680 | 197.7 |
| D | 3 | 14 | 1853 | 5.93 | 747 | 680 | 197.7 |
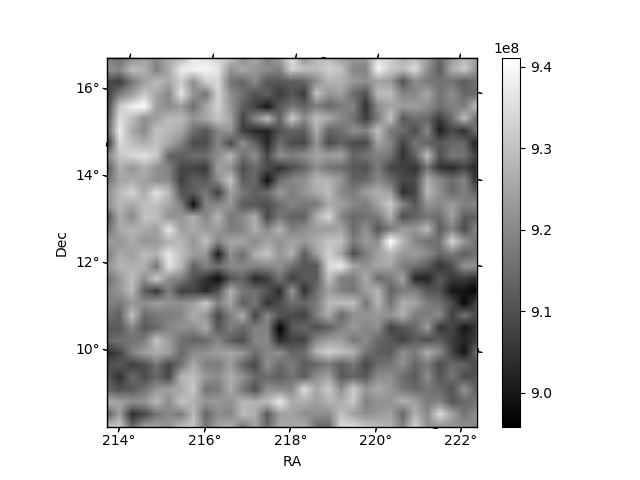
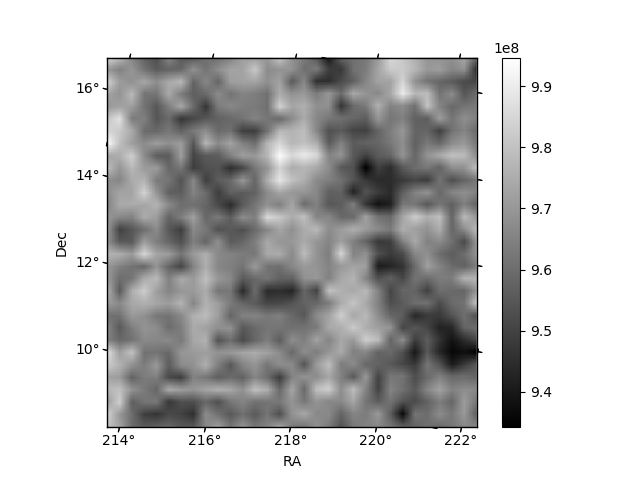
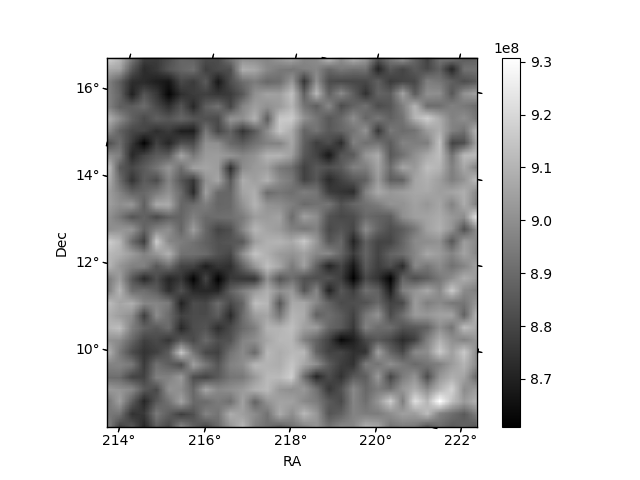
Histogram calculated using DETX and DETY for each event in the final _common_clean file
| Quadrant A |  |
 |
Quadrant B |
|---|---|---|---|
| Quadrant D |  |
 |
Quadrant C |
| Plot type | Count rate plots | Images |
|---|---|---|
| Comparison with Poisson distribution Blue bars denote a histogram of data divided into 1 sec bins. Red curve is a Poisson curve with rate = median count rate of data. |
 |
 |
| Quadrant-wise count rates Data is divided into 100 sec bins |
 |
|
| Module-wise count rates for Quadrant A Data is divided into 100 sec bins |
 |
 |
| Module-wise count rates for Quadrant B Data is divided into 100 sec bins |
 |
 |
| Module-wise count rates for Quadrant C Data is divided into 100 sec bins |
 |
 |
| Module-wise count rates for Quadrant D Data is divided into 100 sec bins |
 |
 |
| Parameter | Plot |
|---|---|
| CZT HV Monitor |  |
| D_VDD | 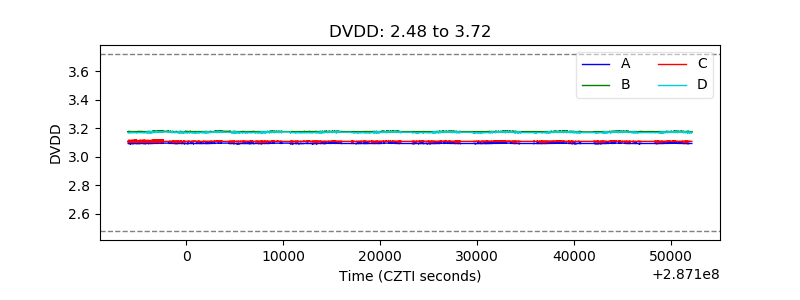 |
| Temperature 1 |  |
| Veto HV Monitor |  |
| Veto LLD |  |
| Alpha Counter |  |
| _CPM_Rate |  |
| CZT Counter |  |
| +2.5 Volts monitor |  |
| +5 Volts monitor |  |
| _ROLL_ROT |  |
| _Roll_DEC |  |
| _Roll_RA |  |
| Veto Counter |  |