| Param | Original file | Final file |
|---|---|---|
| Filename | modeM0/AS1T03_014T01_9000002704_18160cztM0_level2.evt | modeM0/AS1T03_014T01_9000002704_18160cztM0_level2_quad_clean.evt |
| Size (bytes) | 1,532,197,440 | 280,267,200 |
| Size | 1.4 GB | 267.3 MB |
| Events in quadrant A | 10,333,039 | 1,753,530 |
| Events in quadrant B | 10,400,118 | 1,787,184 |
| Events in quadrant C | 10,931,968 | 1,739,435 |
| Events in quadrant D | 13,267,875 | 1,711,160 |
| Mode M9 | |||
|---|---|---|---|
| Quadrant | BADHDUFLAG | Total packets | Discarded packets |
| A | 0 | 28 | 0 |
| B | 0 | 28 | 0 |
| C | 0 | 28 | 0 |
| D | 0 | 28 | 0 |
| Mode SS | |||
|---|---|---|---|
| Quadrant | BADHDUFLAG | Total packets | Discarded packets |
| A | 0 | 442 | 0 |
| B | 0 | 442 | 0 |
| C | 0 | 442 | 0 |
| D | 0 | 442 | 0 |
| Mode M0 | |||
|---|---|---|---|
| Quadrant | BADHDUFLAG | Total packets | Discarded packets |
| A | 0 | 45386 | 4 |
| B | 0 | 45307 | 4 |
| C | 0 | 46546 | 4 |
| D | 0 | 53749 | 4 |
| Quadrant | Total seconds | Saturated seconds | Saturation percentage |
|---|---|---|---|
| A | 21759 | 133 | 0.611241% |
| B | 21759 | 208 | 0.955926% |
| C | 21759 | 367 | 1.686658% |
| D | 21759 | 429 | 1.971598% |
Noise dominated data is calculated using 1-second bins in cleaned event files. If a bin has >2000 counts, and if more than 50% of those come from <1% of pixels, then it is considered to be noise-dominated and hence unusable.
| Quadrant | # 1 sec bins | Bins with >0 counts | Bins with >2000 counts | High rate bins dominated by noise | Noise dominated (total time) | Noise dominated (detector-on time) | Marked lightcurve |
|---|---|---|---|---|---|---|---|
| A | 24554 | 21763 | 6 | 6 | 0.02% | 0.03% | 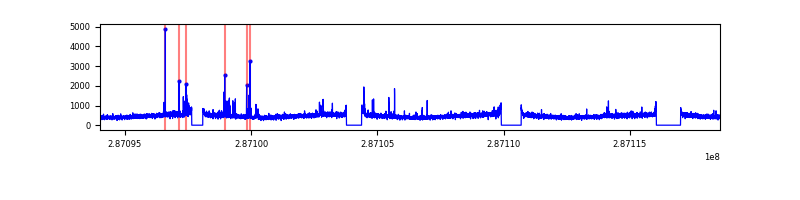 |
| B | 24554 | 21763 | 6 | 6 | 0.02% | 0.03% | 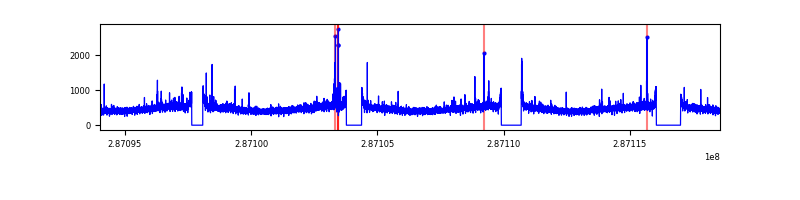 |
| C | 24554 | 21763 | 58 | 58 | 0.24% | 0.27% | 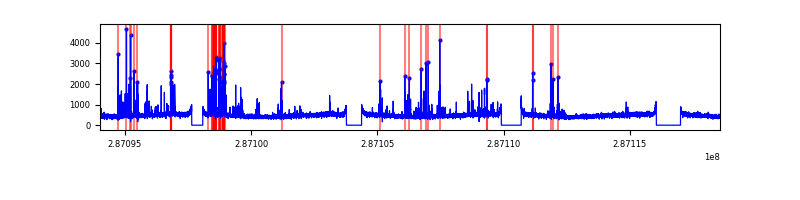 |
| D | 24554 | 21763 | 177 | 177 | 0.72% | 0.81% | 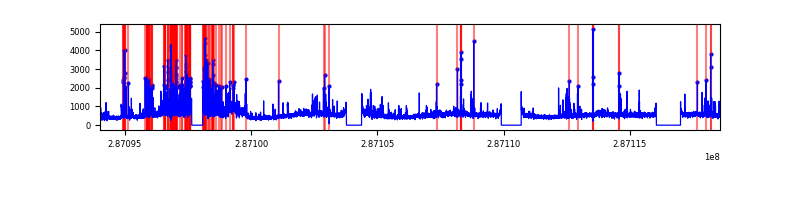 |
Top three noisy pixels from each quadrant. If the there are fewer than three noisy pixels in the level2.evt file, extra rows are filled as -1
| Pixel properties | Quadrant properties | ||||||
|---|---|---|---|---|---|---|---|
| Quadrant | DetID | PixID | Counts | Sigma | Mean | Median | Sigma |
| A | 15 | 174 | 262536 | 493.59 | 2612 | 2555 | 526.7 |
| A | 4 | 2 | 41009 | 73.01 | 2612 | 2555 | 526.7 |
| A | 0 | 226 | 22451 | 37.77 | 2612 | 2555 | 526.7 |
| B | 7 | 220 | 73064 | 140.99 | 2610 | 2546 | 500.1 |
| B | 12 | 111 | 60006 | 114.89 | 2610 | 2546 | 500.1 |
| B | 11 | 111 | 51917 | 98.71 | 2610 | 2546 | 500.1 |
| C | 4 | 254 | 727363 | 1231.04 | 2505 | 2520 | 588.8 |
| C | 14 | 238 | 392183 | 661.79 | 2505 | 2520 | 588.8 |
| C | 3 | 233 | 24073 | 36.6 | 2505 | 2520 | 588.8 |
| D | 7 | 238 | 2357982 | 3831.31 | 2535 | 2468 | 614.8 |
| D | 10 | 70 | 305525 | 492.93 | 2535 | 2468 | 614.8 |
| D | 11 | 176 | 295081 | 475.94 | 2535 | 2468 | 614.8 |
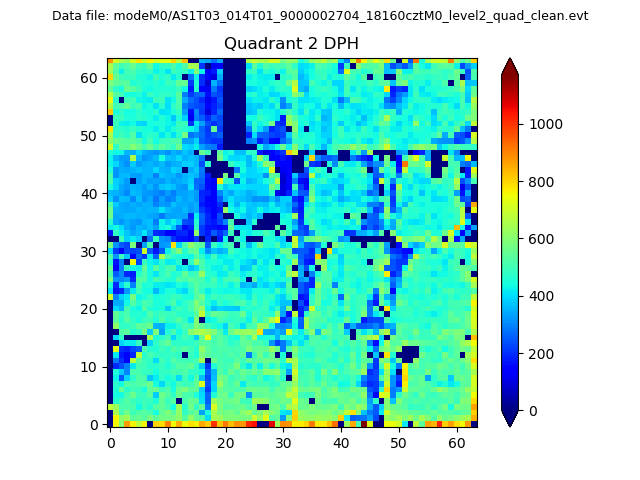
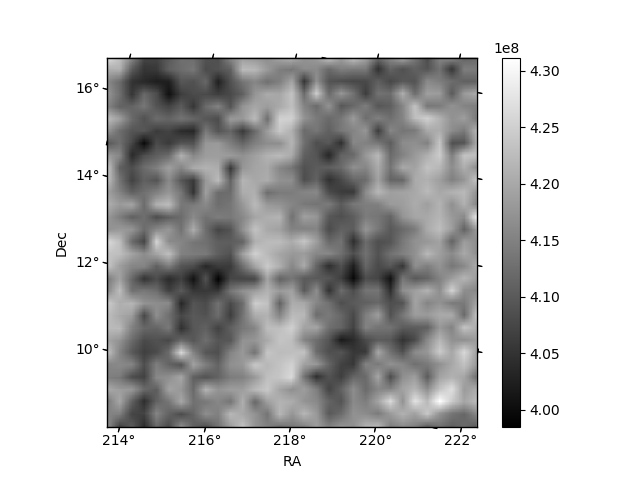
Histogram calculated using DETX and DETY for each event in the final _common_clean file
| Quadrant A | 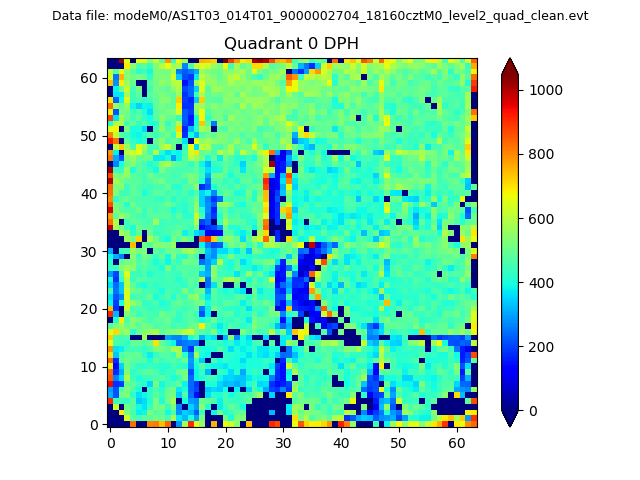 |
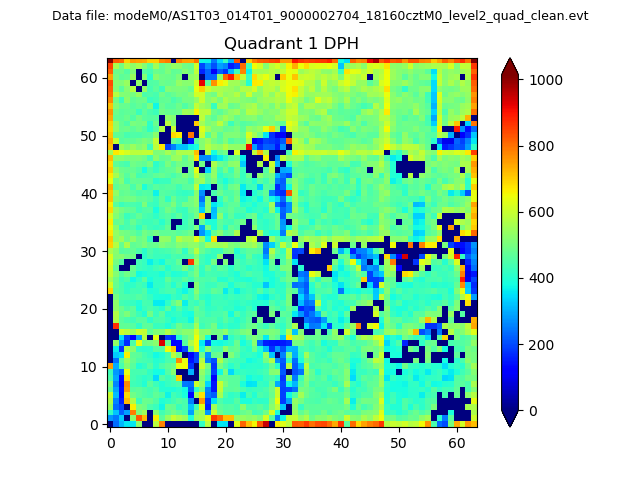 |
Quadrant B |
|---|---|---|---|
| Quadrant D | 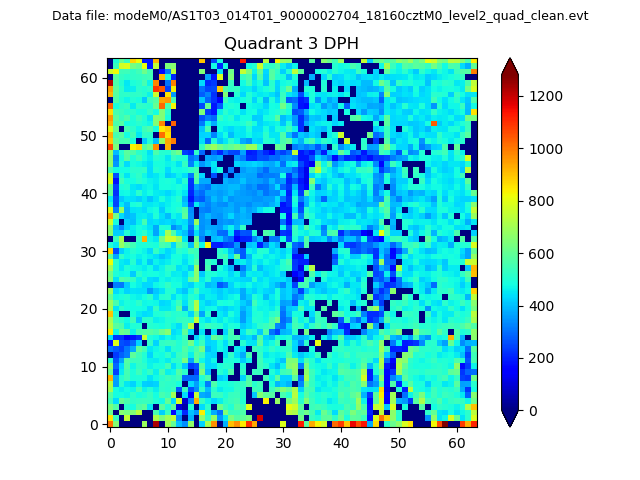 |
 |
Quadrant C |
| Plot type | Count rate plots | Images |
|---|---|---|
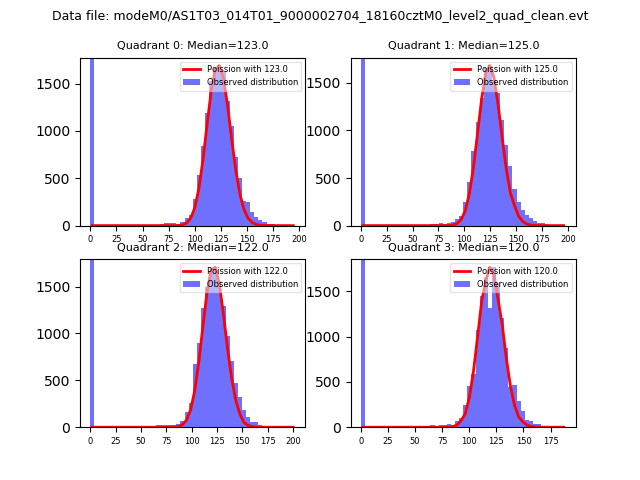
| Comparison with Poisson distribution Blue bars denote a histogram of data divided into 1 sec bins. Red curve is a Poisson curve with rate = median count rate of data. |
 |
 |
| Quadrant-wise count rates Data is divided into 100 sec bins |
 |
|
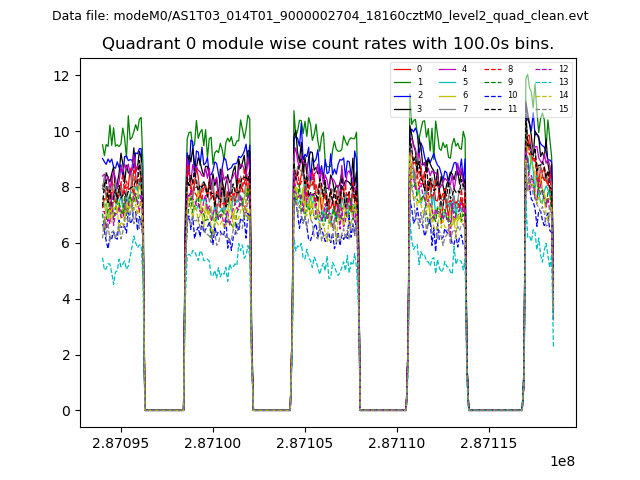
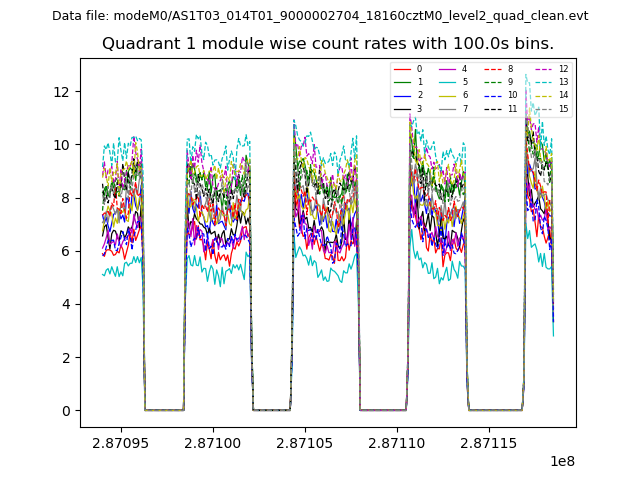
| Module-wise count rates for Quadrant A Data is divided into 100 sec bins |
 |
 |
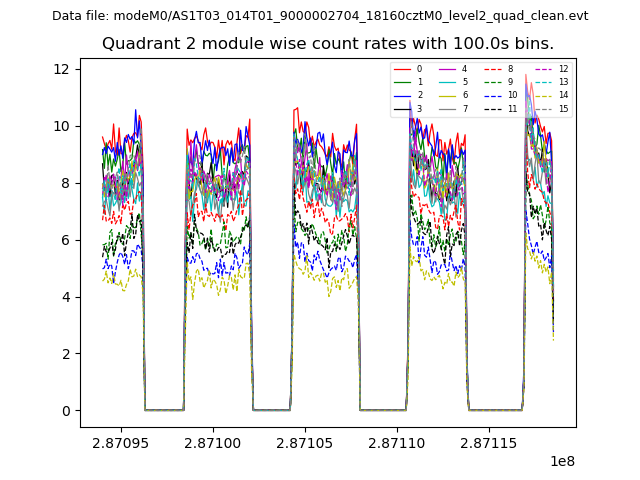
| Module-wise count rates for Quadrant B Data is divided into 100 sec bins |
 |
 |
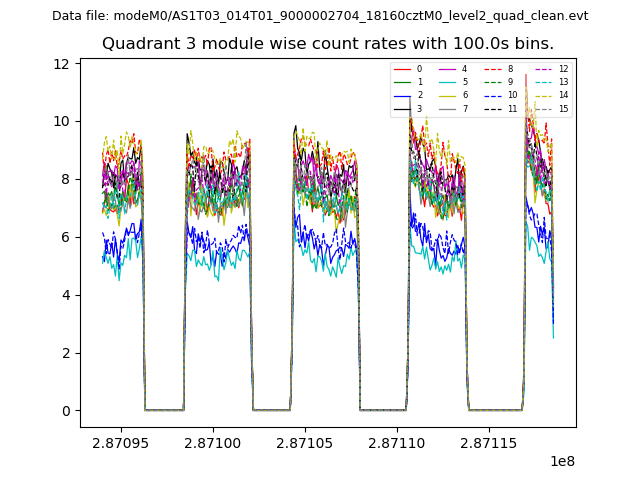
| Module-wise count rates for Quadrant C Data is divided into 100 sec bins |
 |
 |
| Module-wise count rates for Quadrant D Data is divided into 100 sec bins |
 |
 |
| Parameter | Plot |
|---|---|
| CZT HV Monitor | 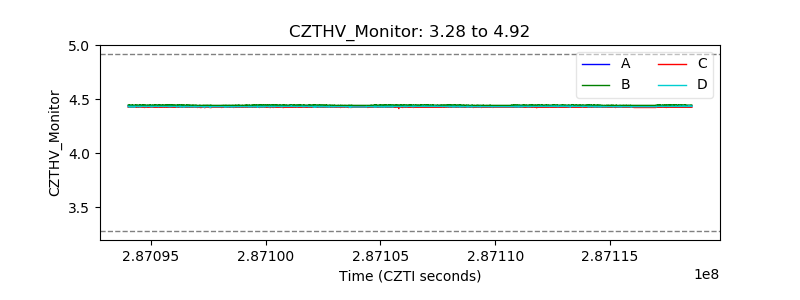 |
| D_VDD | 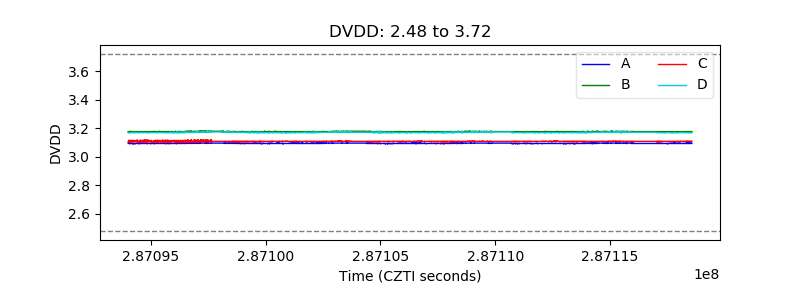 |
| Temperature 1 | 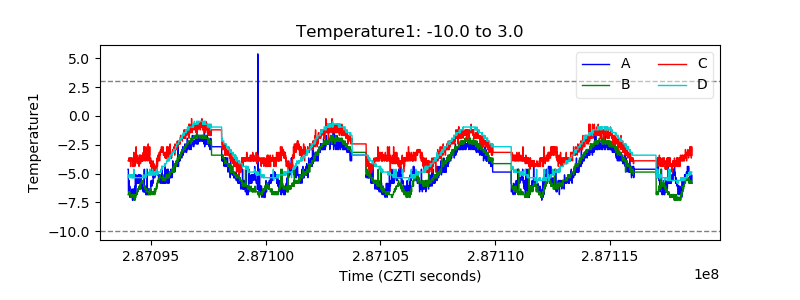 |
| Veto HV Monitor | 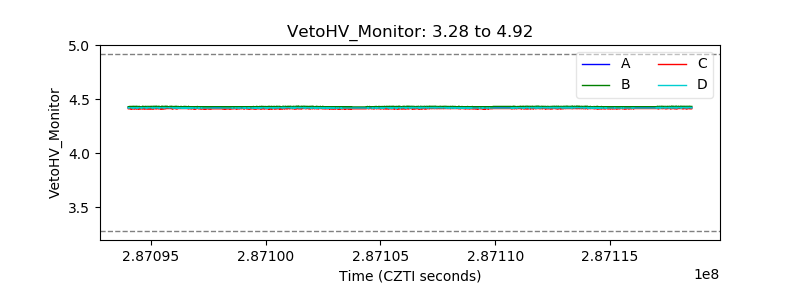 |
| Veto LLD | 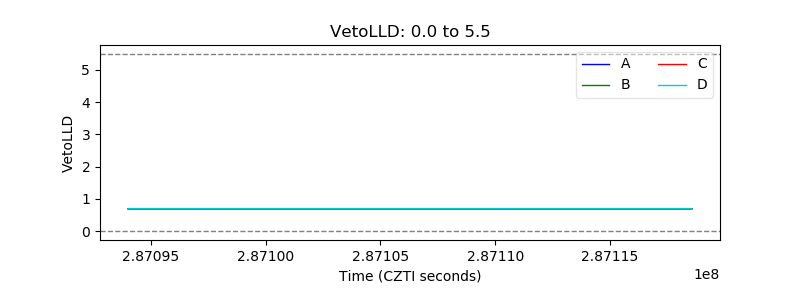 |
| Alpha Counter | 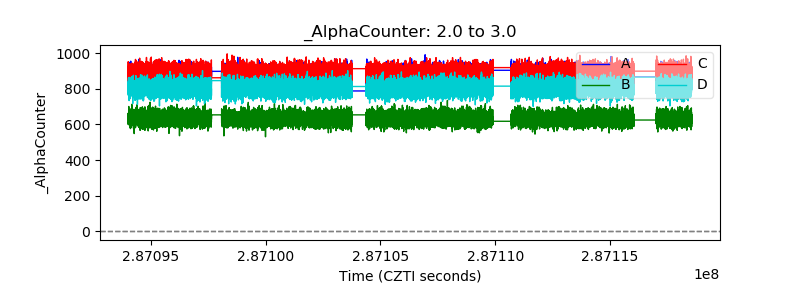 |
| _CPM_Rate | 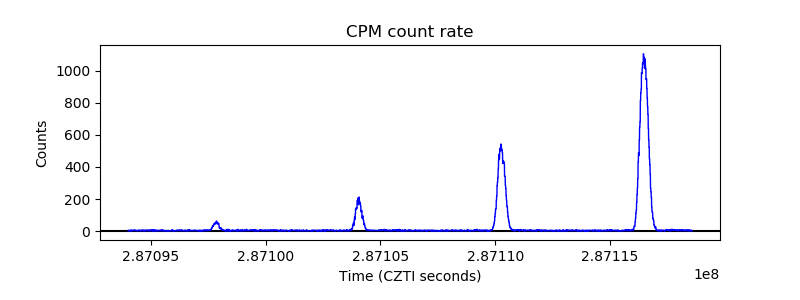 |
| CZT Counter | 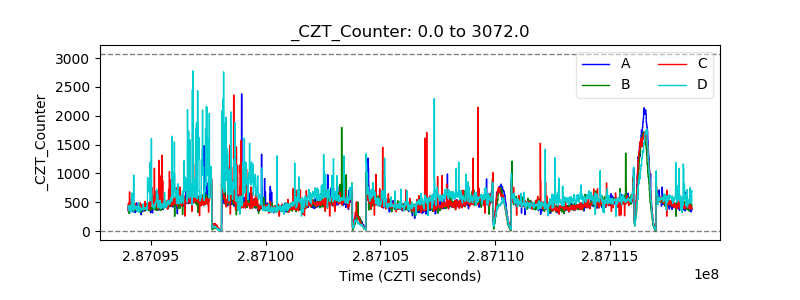 |
| +2.5 Volts monitor |  |
| +5 Volts monitor |  |
| _ROLL_ROT | 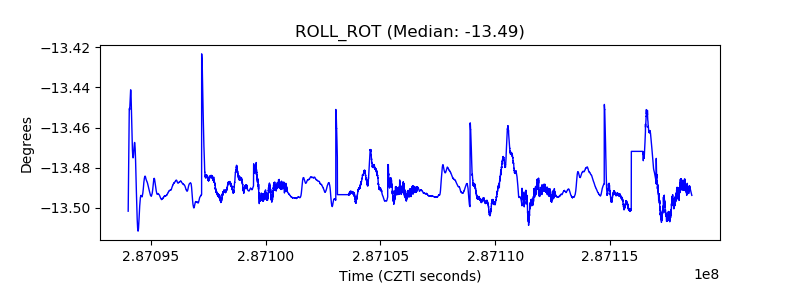 |
| _Roll_DEC | 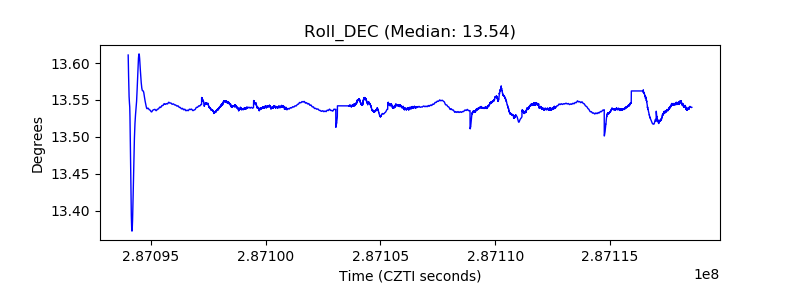 |
| _Roll_RA | 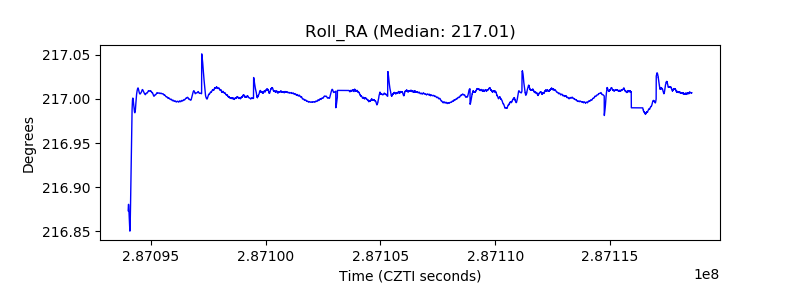 |
| Veto Counter | 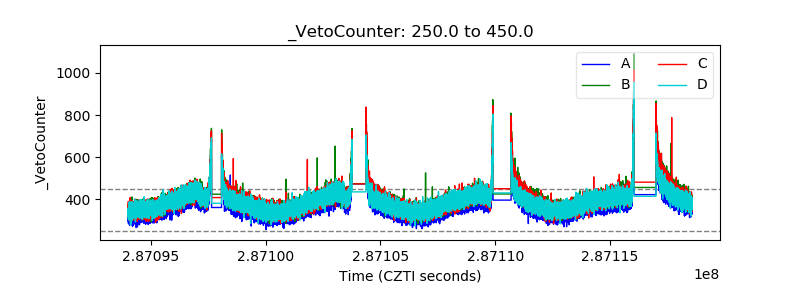 |