| Param | Original file | Final file |
|---|---|---|
| Filename | modeM0/AS1T03_014T01_9000002704_18162cztM0_level2.evt | modeM0/AS1T03_014T01_9000002704_18162cztM0_level2_quad_clean.evt |
| Size (bytes) | 520,804,800 | 95,973,120 |
| Size | 496.7 MB | 91.5 MB |
| Events in quadrant A | 4,280,738 | 610,334 |
| Events in quadrant B | 3,313,129 | 629,360 |
| Events in quadrant C | 3,362,310 | 606,472 |
| Events in quadrant D | 4,359,753 | 590,983 |
| Mode M9 | |||
|---|---|---|---|
| Quadrant | BADHDUFLAG | Total packets | Discarded packets |
| A | 0 | 17 | 0 |
| B | 0 | 18 | 0 |
| C | 0 | 18 | 0 |
| D | 0 | 18 | 0 |
| Mode SS | |||
|---|---|---|---|
| Quadrant | BADHDUFLAG | Total packets | Discarded packets |
| A | 0 | 136 | 0 |
| B | 0 | 136 | 0 |
| C | 0 | 136 | 0 |
| D | 0 | 136 | 0 |
| Mode M0 | |||
|---|---|---|---|
| Quadrant | BADHDUFLAG | Total packets | Discarded packets |
| A | 0 | 17199 | 2 |
| B | 0 | 14098 | 2 |
| C | 0 | 14277 | 2 |
| D | 0 | 17549 | 2 |
| Quadrant | Total seconds | Saturated seconds | Saturation percentage |
|---|---|---|---|
| A | 6735 | 310 | 4.602821% |
| B | 6735 | 50 | 0.742390% |
| C | 6735 | 83 | 1.232368% |
| D | 6735 | 93 | 1.380846% |
Noise dominated data is calculated using 1-second bins in cleaned event files. If a bin has >2000 counts, and if more than 50% of those come from <1% of pixels, then it is considered to be noise-dominated and hence unusable.
| Quadrant | # 1 sec bins | Bins with >0 counts | Bins with >2000 counts | High rate bins dominated by noise | Noise dominated (total time) | Noise dominated (detector-on time) | Marked lightcurve |
|---|---|---|---|---|---|---|---|
| A | 7820 | 6736 | 156 | 156 | 1.99% | 2.32% | 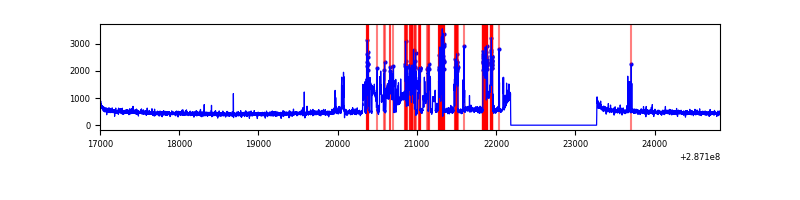 |
| B | 7820 | 6736 | 1 | 1 | 0.01% | 0.01% | 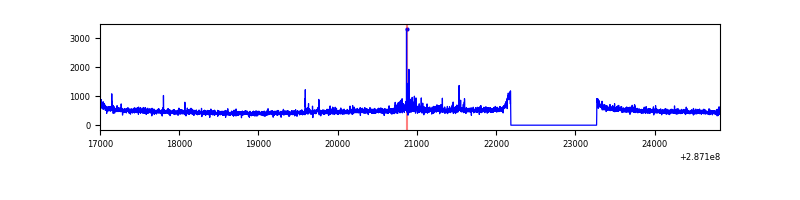 |
| C | 7820 | 6736 | 7 | 7 | 0.09% | 0.10% | 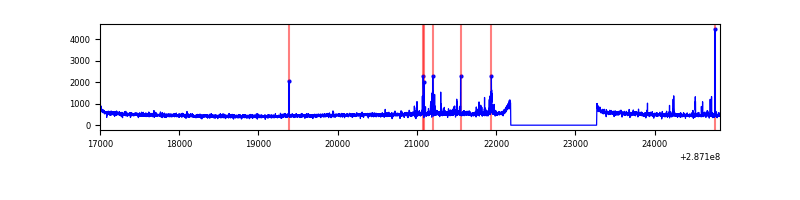 |
| D | 7820 | 6736 | 52 | 52 | 0.66% | 0.77% | 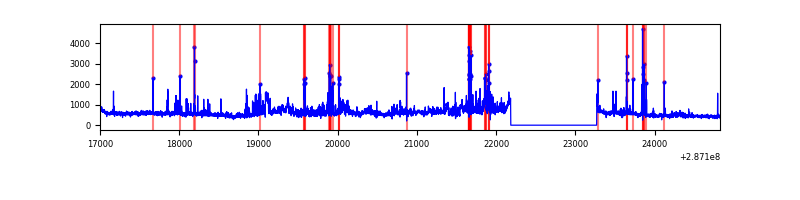 |
Top three noisy pixels from each quadrant. If the there are fewer than three noisy pixels in the level2.evt file, extra rows are filled as -1
| Pixel properties | Quadrant properties | ||||||
|---|---|---|---|---|---|---|---|
| Quadrant | DetID | PixID | Counts | Sigma | Mean | Median | Sigma |
| A | 15 | 174 | 1124283 | 6735.32 | 820 | 803 | 166.8 |
| A | 0 | 226 | 7107 | 37.79 | 820 | 803 | 166.8 |
| A | 3 | 137 | 6029 | 31.33 | 820 | 803 | 166.8 |
| B | 7 | 220 | 33094 | 204.28 | 829 | 808 | 158.0 |
| B | 12 | 111 | 18662 | 112.97 | 829 | 808 | 158.0 |
| B | 0 | 189 | 18511 | 112.01 | 829 | 808 | 158.0 |
| C | 4 | 254 | 128466 | 679.38 | 797 | 802 | 187.9 |
| C | 14 | 238 | 125712 | 664.72 | 797 | 802 | 187.9 |
| C | 13 | 61 | 5620 | 25.64 | 797 | 802 | 187.9 |
| D | 7 | 238 | 946516 | 4809.86 | 803 | 781 | 196.6 |
| D | 11 | 176 | 185883 | 941.4 | 803 | 781 | 196.6 |
| D | 13 | 104 | 94921 | 478.78 | 803 | 781 | 196.6 |
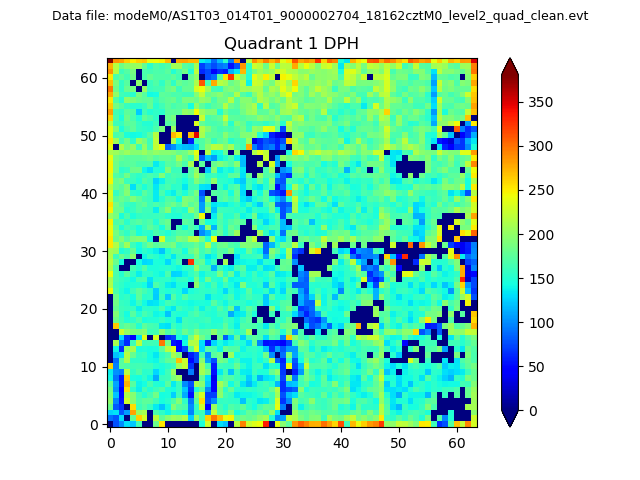
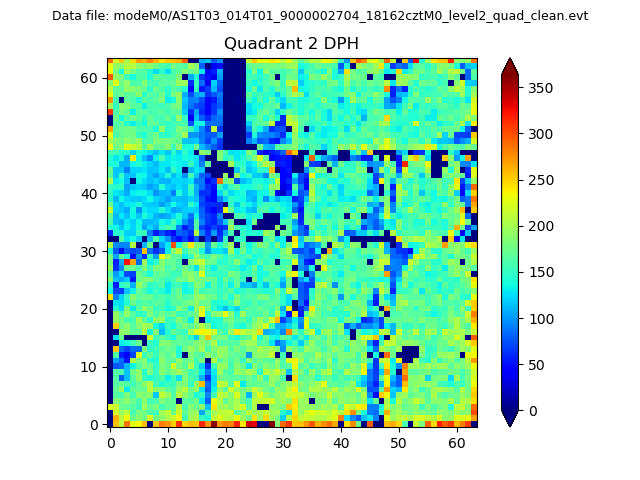
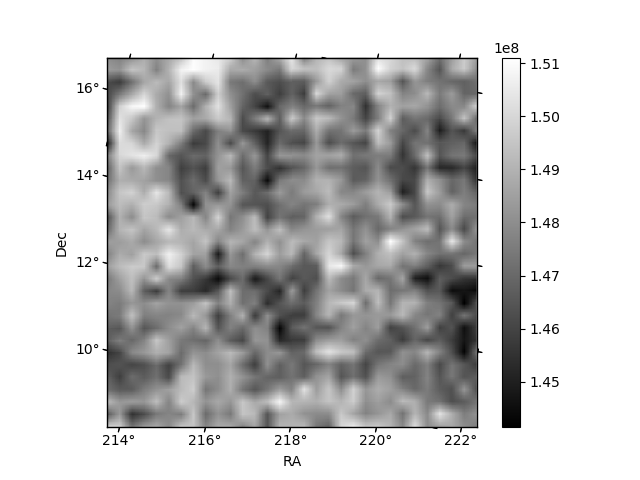
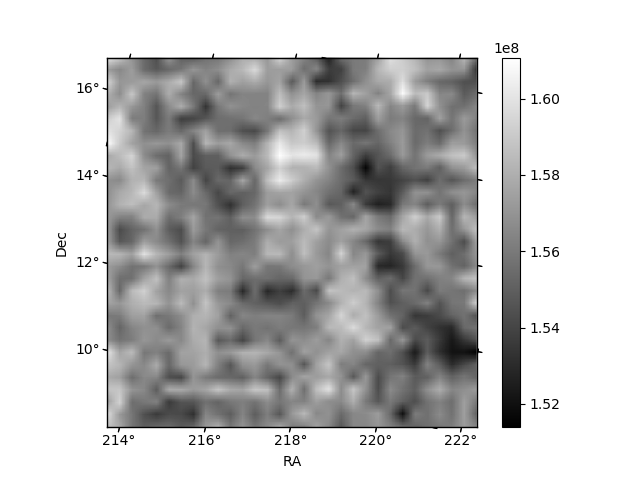
Histogram calculated using DETX and DETY for each event in the final _common_clean file
| Quadrant A |  |
 |
Quadrant B |
|---|---|---|---|
| Quadrant D | 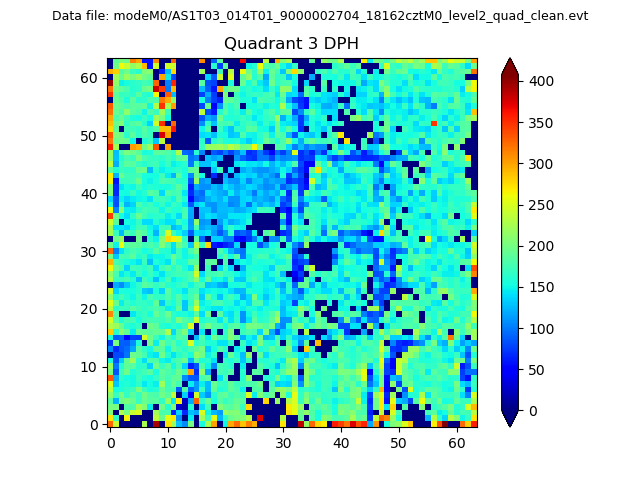 |
 |
Quadrant C |
| Plot type | Count rate plots | Images |
|---|---|---|
| Comparison with Poisson distribution Blue bars denote a histogram of data divided into 1 sec bins. Red curve is a Poisson curve with rate = median count rate of data. |
 |
 |
| Quadrant-wise count rates Data is divided into 100 sec bins |
 |
|
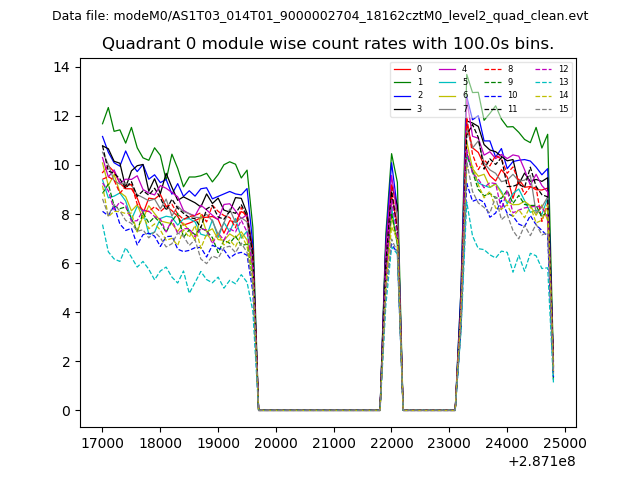
| Module-wise count rates for Quadrant A Data is divided into 100 sec bins |
 |
 |
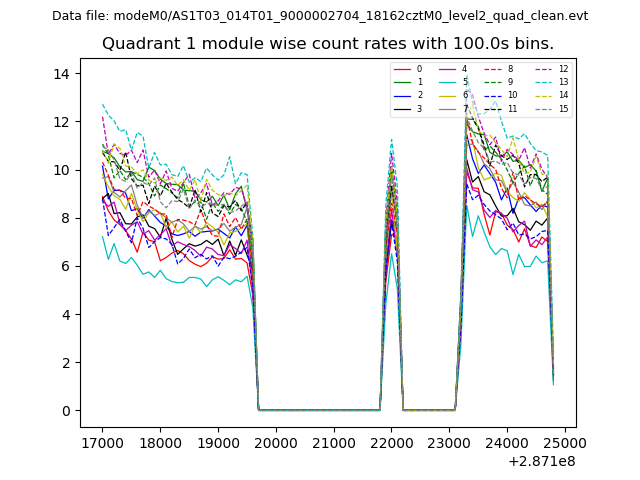
| Module-wise count rates for Quadrant B Data is divided into 100 sec bins |
 |
 |
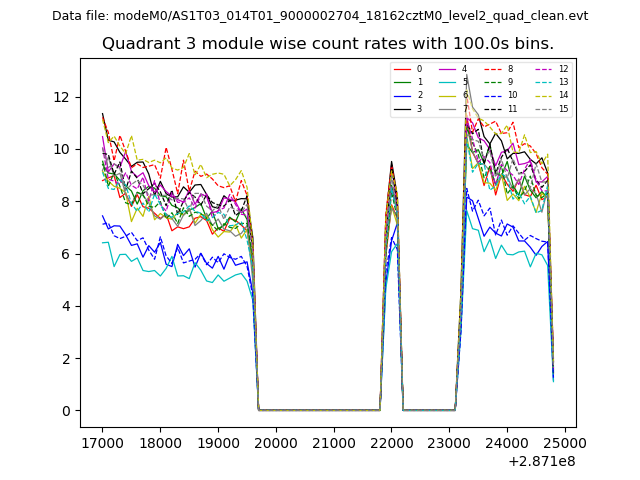
| Module-wise count rates for Quadrant C Data is divided into 100 sec bins |
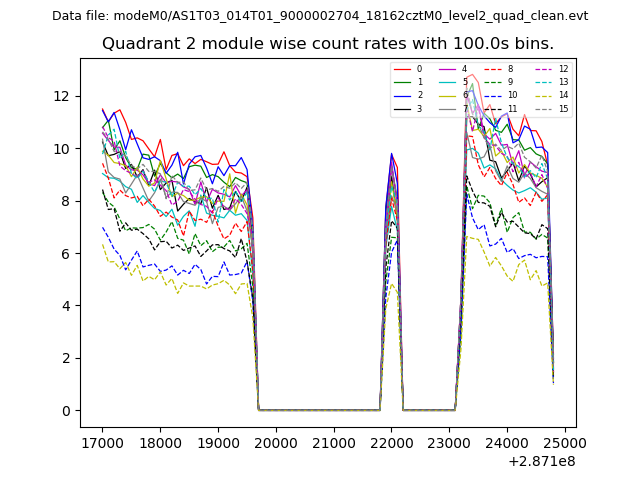 |
 |
| Module-wise count rates for Quadrant D Data is divided into 100 sec bins |
 |
 |
| Parameter | Plot |
|---|---|
| CZT HV Monitor | 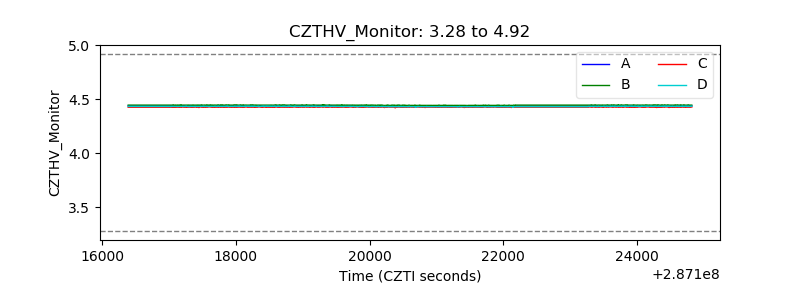 |
| D_VDD | 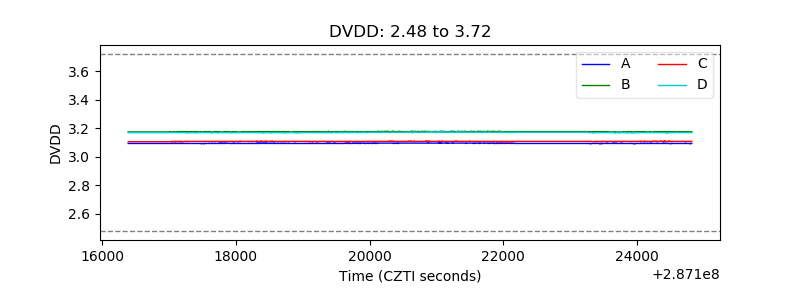 |
| Temperature 1 | 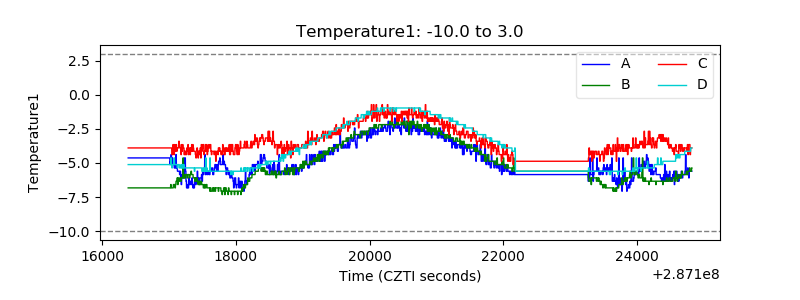 |
| Veto HV Monitor | 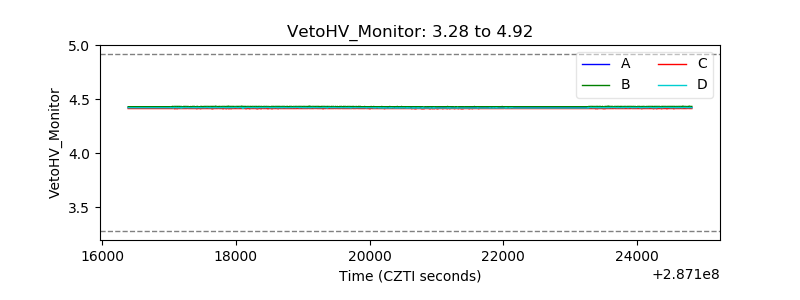 |
| Veto LLD | 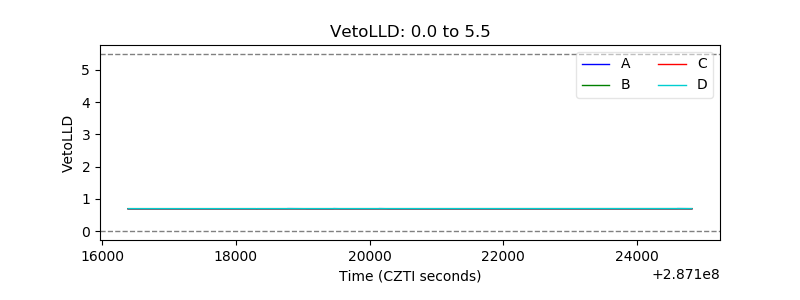 |
| Alpha Counter | 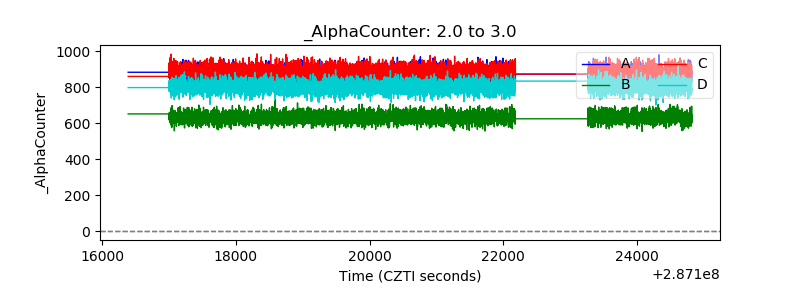 |
| _CPM_Rate |  |
| CZT Counter | 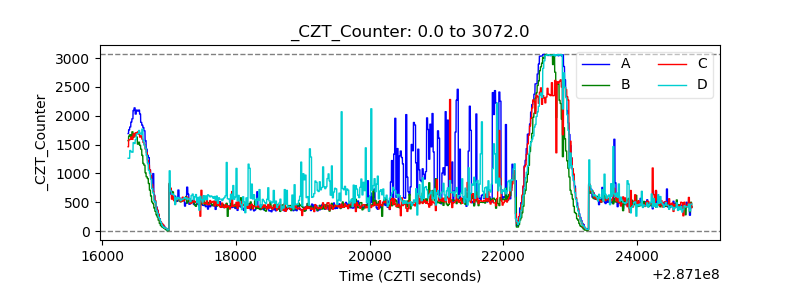 |
| +2.5 Volts monitor | 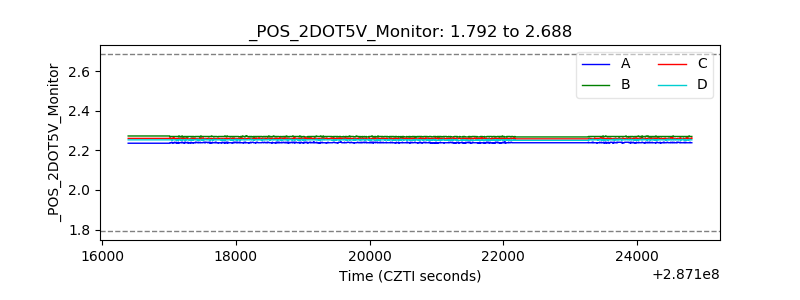 |
| +5 Volts monitor |  |
| _ROLL_ROT | 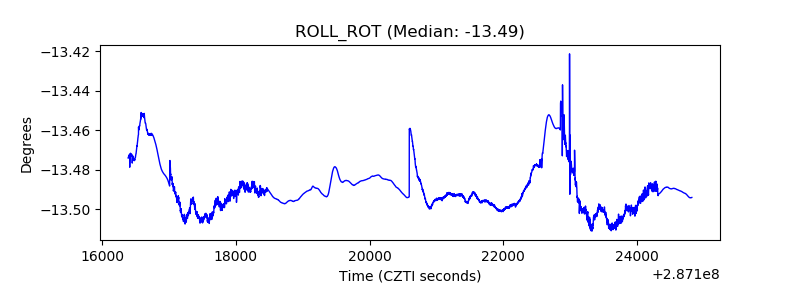 |
| _Roll_DEC | 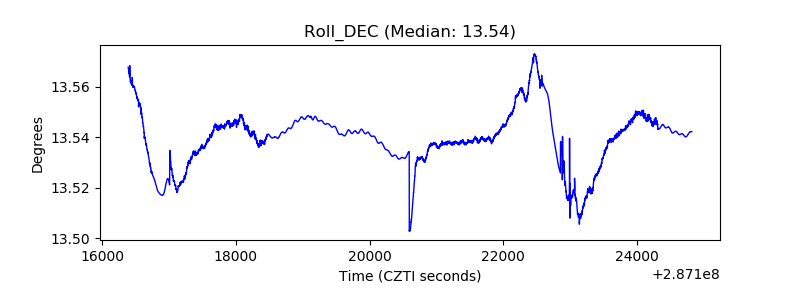 |
| _Roll_RA |  |
| Veto Counter | 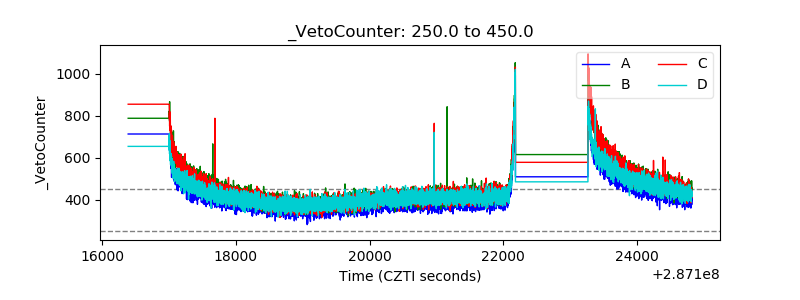 |