| Param | Original file | Final file |
|---|---|---|
| Filename | modeM0/AS1T03_014T01_9000002704_18163cztM0_level2.evt | modeM0/AS1T03_014T01_9000002704_18163cztM0_level2_quad_clean.evt |
| Size (bytes) | 528,940,800 | 92,410,560 |
| Size | 504.4 MB | 88.1 MB |
| Events in quadrant A | 3,959,737 | 595,875 |
| Events in quadrant B | 3,165,454 | 613,257 |
| Events in quadrant C | 3,937,436 | 573,785 |
| Events in quadrant D | 4,529,645 | 576,188 |
| Mode M9 | |||
|---|---|---|---|
| Quadrant | BADHDUFLAG | Total packets | Discarded packets |
| A | 0 | 12 | 0 |
| B | 0 | 12 | 0 |
| C | 0 | 12 | 0 |
| D | 0 | 12 | 0 |
| Mode SS | |||
|---|---|---|---|
| Quadrant | BADHDUFLAG | Total packets | Discarded packets |
| A | 0 | 128 | 0 |
| B | 0 | 128 | 0 |
| C | 0 | 128 | 0 |
| D | 0 | 128 | 0 |
| Mode M0 | |||
|---|---|---|---|
| Quadrant | BADHDUFLAG | Total packets | Discarded packets |
| A | 0 | 15688 | 1 |
| B | 0 | 13125 | 1 |
| C | 0 | 15570 | 1 |
| D | 0 | 17623 | 1 |
| Quadrant | Total seconds | Saturated seconds | Saturation percentage |
|---|---|---|---|
| A | 6296 | 253 | 4.018424% |
| B | 6296 | 53 | 0.841804% |
| C | 6296 | 299 | 4.749047% |
| D | 6297 | 132 | 2.096236% |
Noise dominated data is calculated using 1-second bins in cleaned event files. If a bin has >2000 counts, and if more than 50% of those come from <1% of pixels, then it is considered to be noise-dominated and hence unusable.
| Quadrant | # 1 sec bins | Bins with >0 counts | Bins with >2000 counts | High rate bins dominated by noise | Noise dominated (total time) | Noise dominated (detector-on time) | Marked lightcurve |
|---|---|---|---|---|---|---|---|
| A | 7506 | 6297 | 146 | 146 | 1.95% | 2.32% | 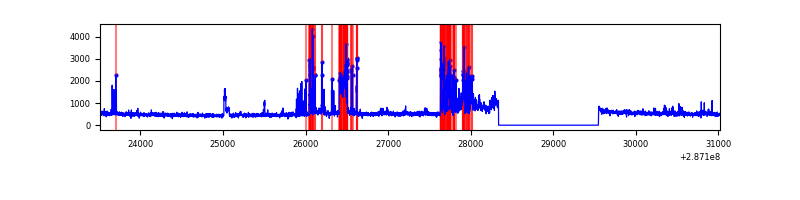 |
| B | 7506 | 6297 | 1 | 1 | 0.01% | 0.02% | 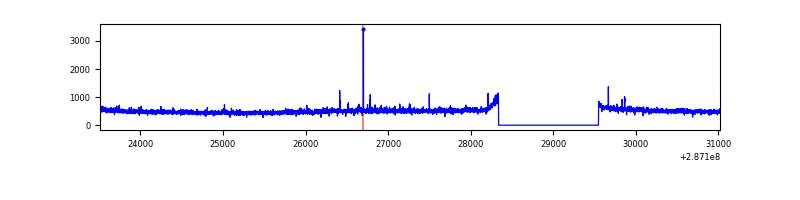 |
| C | 7506 | 6297 | 157 | 157 | 2.09% | 2.49% | 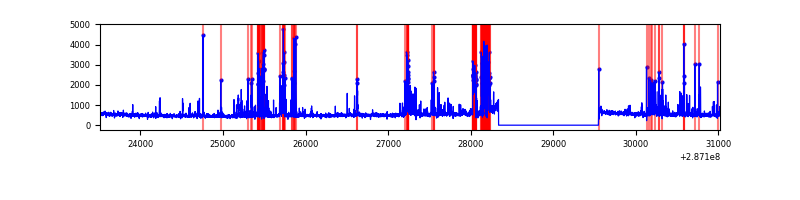 |
| D | 7507 | 6298 | 69 | 69 | 0.92% | 1.10% | 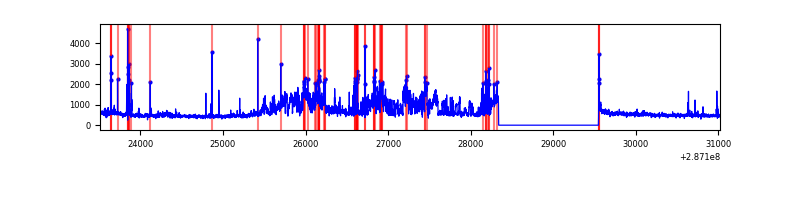 |
Top three noisy pixels from each quadrant. If the there are fewer than three noisy pixels in the level2.evt file, extra rows are filled as -1
| Pixel properties | Quadrant properties | ||||||
|---|---|---|---|---|---|---|---|
| Quadrant | DetID | PixID | Counts | Sigma | Mean | Median | Sigma |
| A | 15 | 174 | 897198 | 5601.9 | 796 | 783 | 160.0 |
| A | 0 | 226 | 6939 | 38.47 | 796 | 783 | 160.0 |
| A | 12 | 194 | 5767 | 31.15 | 796 | 783 | 160.0 |
| B | 0 | 189 | 25604 | 164.38 | 800 | 782 | 151.0 |
| B | 12 | 111 | 17456 | 110.42 | 800 | 782 | 151.0 |
| B | 11 | 111 | 15198 | 95.47 | 800 | 782 | 151.0 |
| C | 4 | 254 | 868699 | 4948.98 | 755 | 762 | 175.4 |
| C | 14 | 238 | 118918 | 673.73 | 755 | 762 | 175.4 |
| C | 13 | 61 | 5297 | 25.86 | 755 | 762 | 175.4 |
| D | 7 | 238 | 1296039 | 6821.15 | 778 | 759 | 189.9 |
| D | 11 | 176 | 161228 | 845.06 | 778 | 759 | 189.9 |
| D | 10 | 70 | 57606 | 299.37 | 778 | 759 | 189.9 |
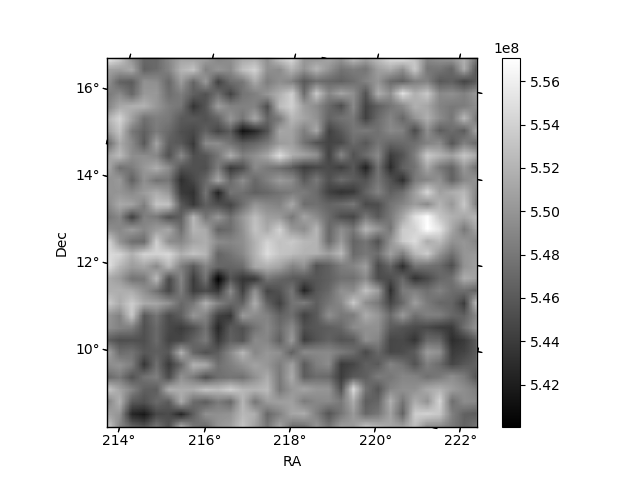
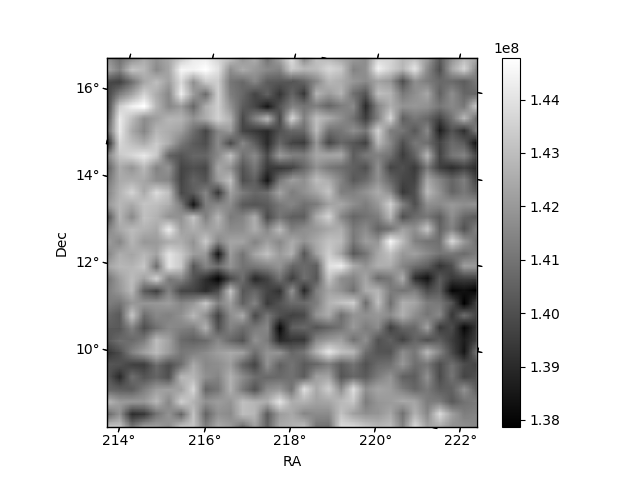
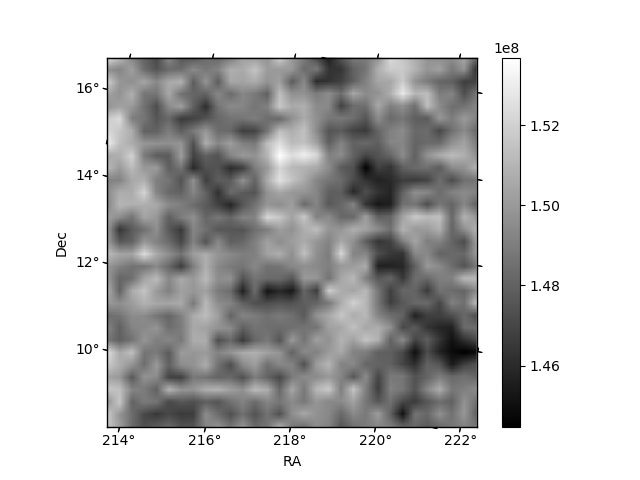
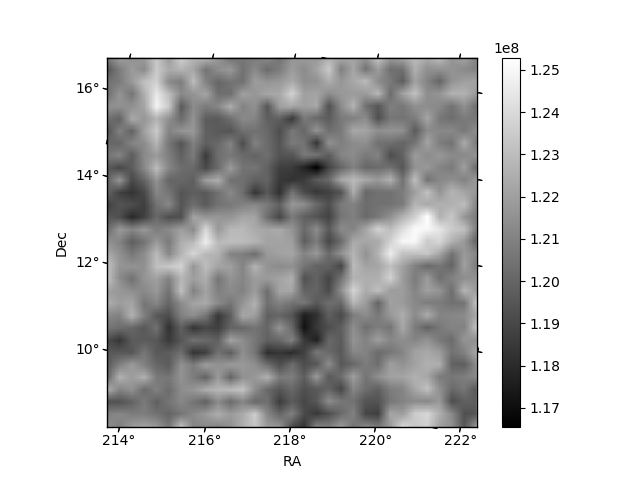
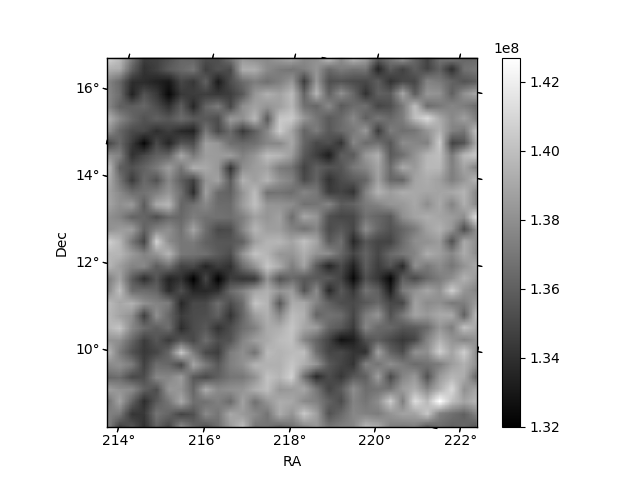
Histogram calculated using DETX and DETY for each event in the final _common_clean file
| Quadrant A | 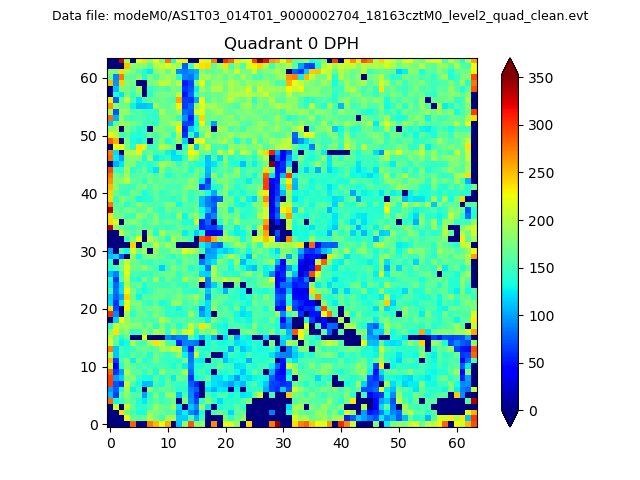 |
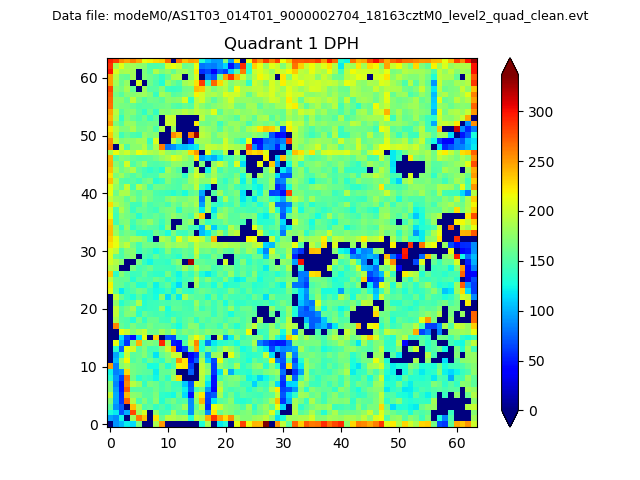 |
Quadrant B |
|---|---|---|---|
| Quadrant D | 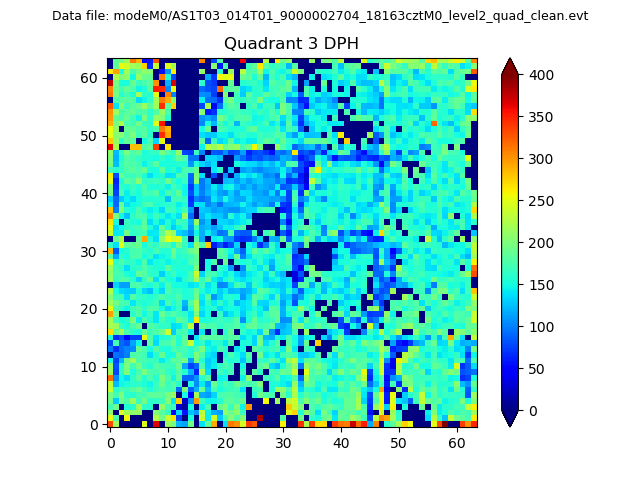 |
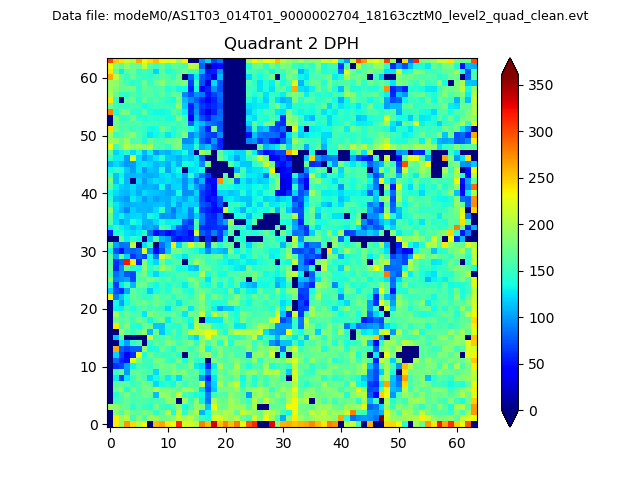 |
Quadrant C |
| Plot type | Count rate plots | Images |
|---|---|---|
| Comparison with Poisson distribution Blue bars denote a histogram of data divided into 1 sec bins. Red curve is a Poisson curve with rate = median count rate of data. |
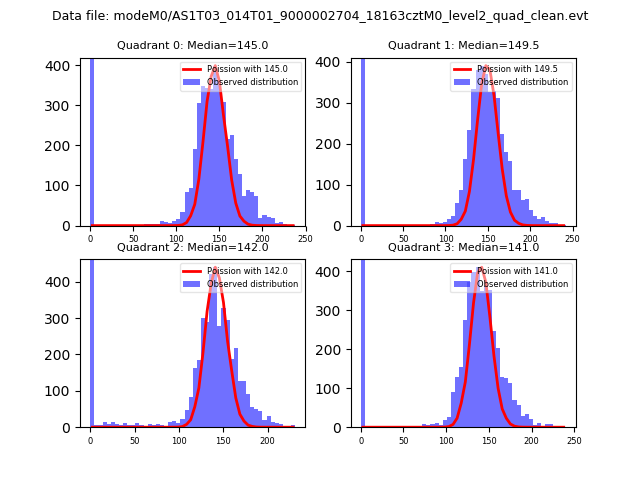 |
 |
| Quadrant-wise count rates Data is divided into 100 sec bins |
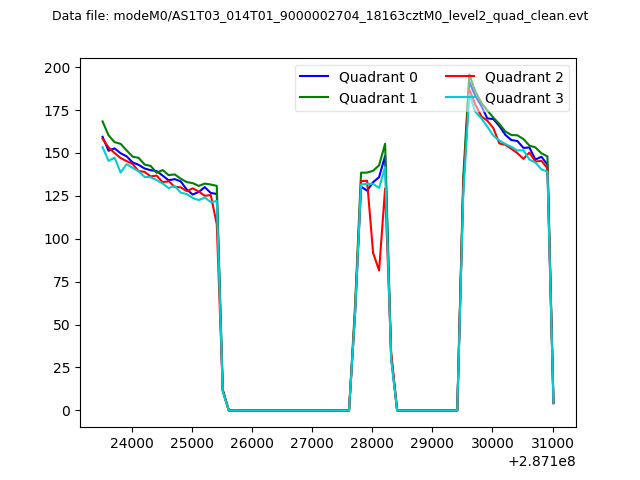 |
|
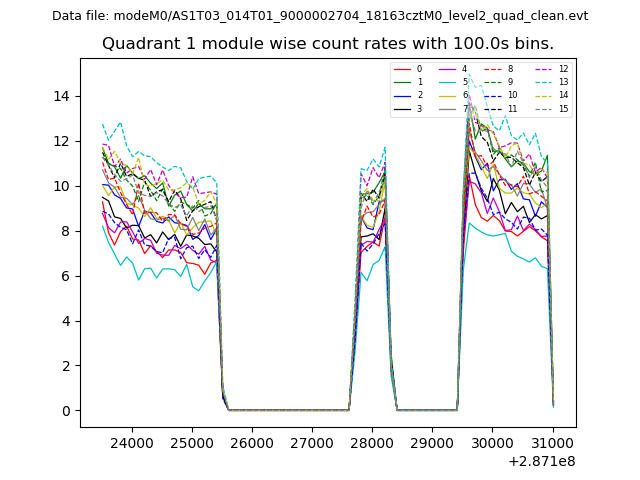
| Module-wise count rates for Quadrant A Data is divided into 100 sec bins |
 |
 |
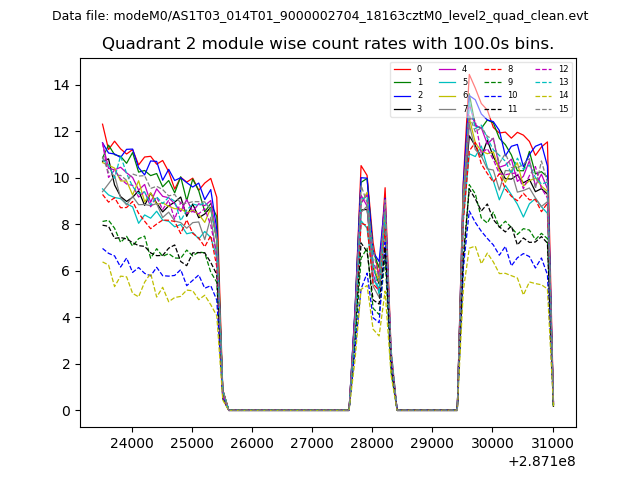
| Module-wise count rates for Quadrant B Data is divided into 100 sec bins |
 |
 |
| Module-wise count rates for Quadrant C Data is divided into 100 sec bins |
 |
 |
| Module-wise count rates for Quadrant D Data is divided into 100 sec bins |
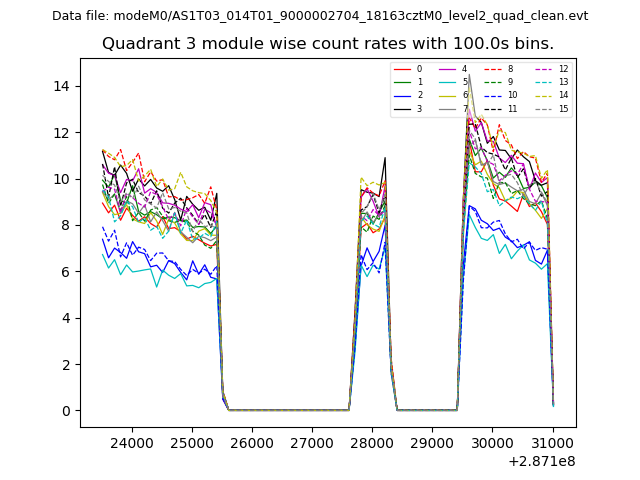 |
 |
| Parameter | Plot |
|---|---|
| CZT HV Monitor | 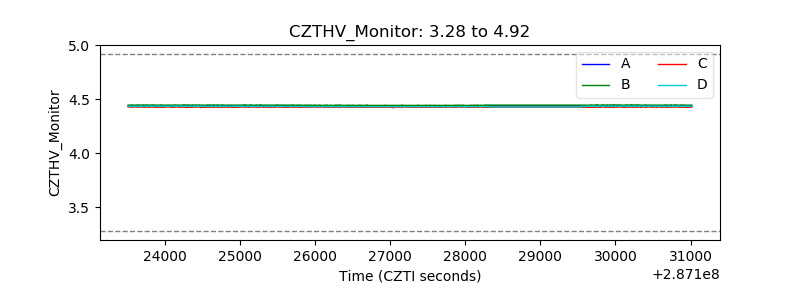 |
| D_VDD | 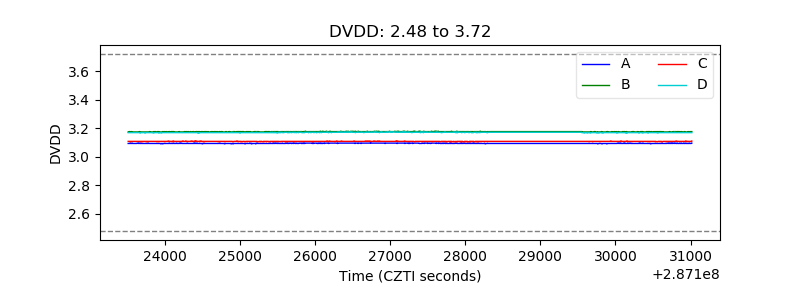 |
| Temperature 1 | 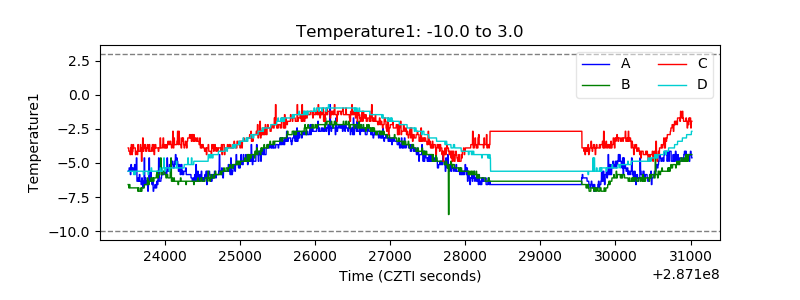 |
| Veto HV Monitor | 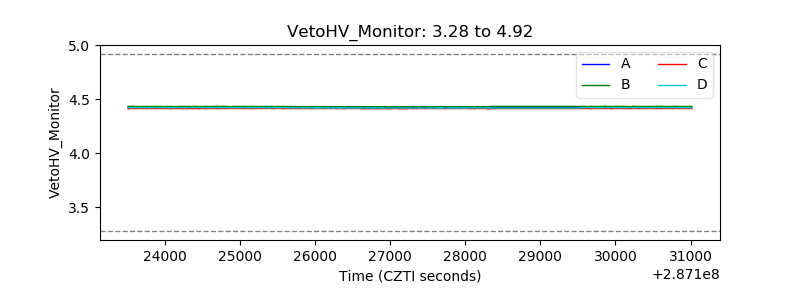 |
| Veto LLD | 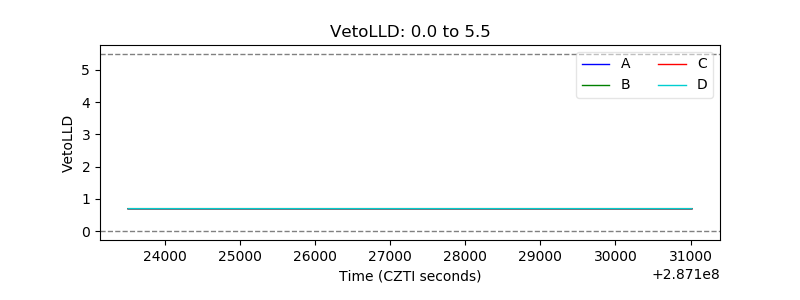 |
| Alpha Counter | 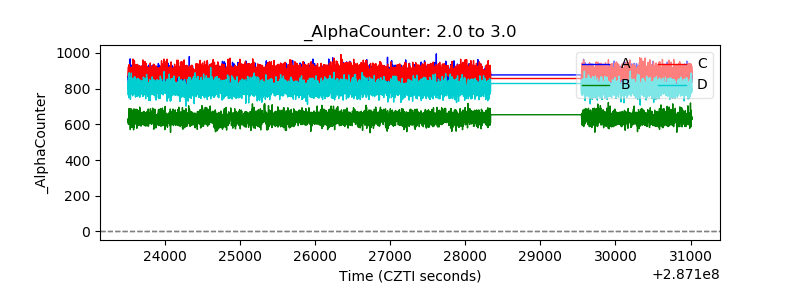 |
| _CPM_Rate | 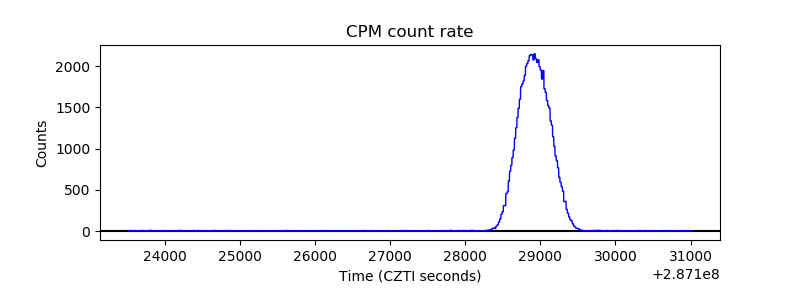 |
| CZT Counter |  |
| +2.5 Volts monitor |  |
| +5 Volts monitor |  |
| _ROLL_ROT | 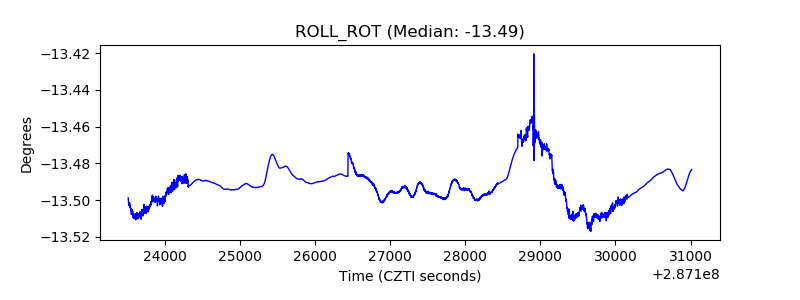 |
| _Roll_DEC | 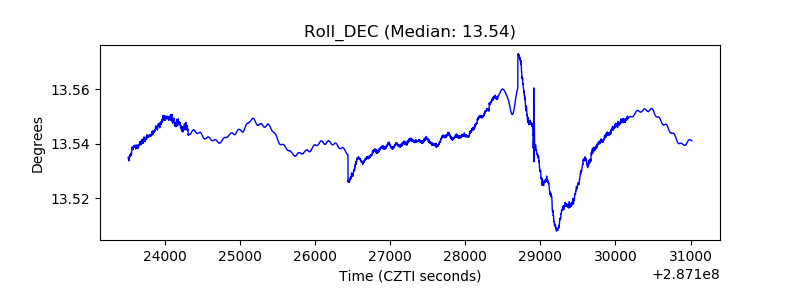 |
| _Roll_RA | 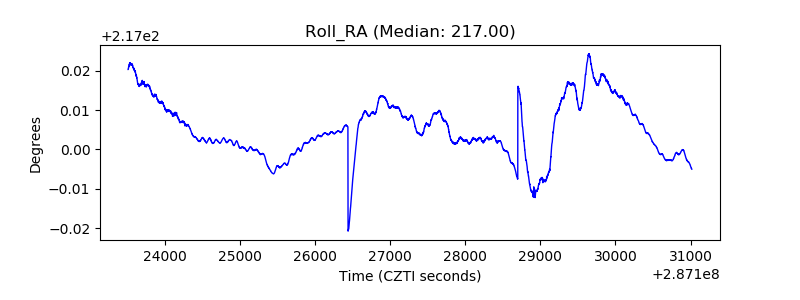 |
| Veto Counter | 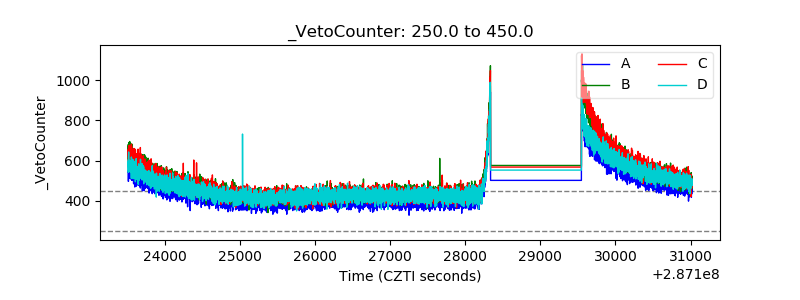 |