| Param | Original file | Final file |
|---|---|---|
| Filename | modeM0/AS1T03_014T01_9000002704_18166cztM0_level2.evt | modeM0/AS1T03_014T01_9000002704_18166cztM0_level2_quad_clean.evt |
| Size (bytes) | 518,232,960 | 82,630,080 |
| Size | 494.2 MB | 78.8 MB |
| Events in quadrant A | 3,359,710 | 525,047 |
| Events in quadrant B | 3,397,621 | 533,827 |
| Events in quadrant C | 3,953,193 | 506,491 |
| Events in quadrant D | 4,568,224 | 508,347 |
| Mode M9 | |||
|---|---|---|---|
| Quadrant | BADHDUFLAG | Total packets | Discarded packets |
| A | 0 | 16 | 0 |
| B | 0 | 17 | 0 |
| C | 0 | 17 | 0 |
| D | 0 | 17 | 0 |
| Mode SS | |||
|---|---|---|---|
| Quadrant | BADHDUFLAG | Total packets | Discarded packets |
| A | 0 | 126 | 0 |
| B | 0 | 126 | 0 |
| C | 0 | 126 | 0 |
| D | 0 | 126 | 0 |
| Mode M0 | |||
|---|---|---|---|
| Quadrant | BADHDUFLAG | Total packets | Discarded packets |
| A | 0 | 13479 | 2 |
| B | 0 | 13551 | 2 |
| C | 0 | 15429 | 2 |
| D | 0 | 17669 | 3 |
| Quadrant | Total seconds | Saturated seconds | Saturation percentage |
|---|---|---|---|
| A | 6133 | 65 | 1.059840% |
| B | 6133 | 73 | 1.190282% |
| C | 6133 | 311 | 5.070928% |
| D | 6132 | 124 | 2.022179% |
Noise dominated data is calculated using 1-second bins in cleaned event files. If a bin has >2000 counts, and if more than 50% of those come from <1% of pixels, then it is considered to be noise-dominated and hence unusable.
| Quadrant | # 1 sec bins | Bins with >0 counts | Bins with >2000 counts | High rate bins dominated by noise | Noise dominated (total time) | Noise dominated (detector-on time) | Marked lightcurve |
|---|---|---|---|---|---|---|---|
| A | 7473 | 6134 | 1 | 1 | 0.01% | 0.02% | 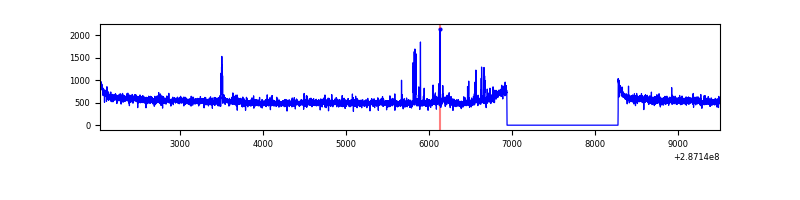 |
| B | 7473 | 6134 | 5 | 5 | 0.07% | 0.08% | 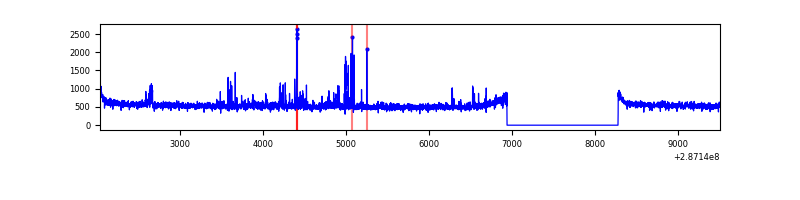 |
| C | 7473 | 6134 | 128 | 128 | 1.71% | 2.09% | 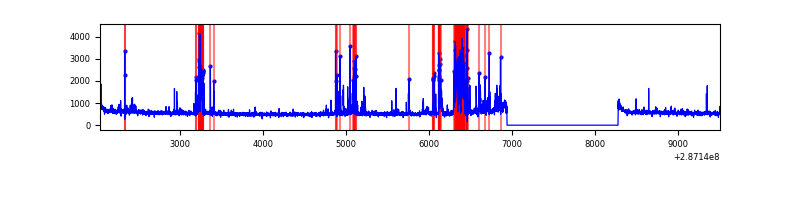 |
| D | 7472 | 6133 | 74 | 74 | 0.99% | 1.21% | 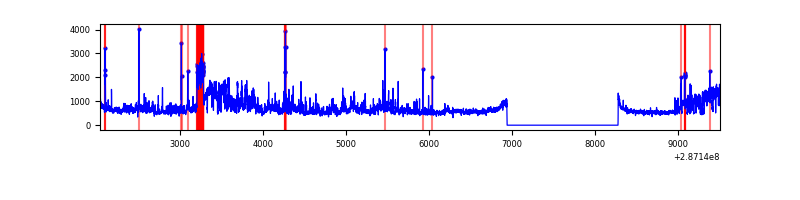 |
Top three noisy pixels from each quadrant. If the there are fewer than three noisy pixels in the level2.evt file, extra rows are filled as -1
| Pixel properties | Quadrant properties | ||||||
|---|---|---|---|---|---|---|---|
| Quadrant | DetID | PixID | Counts | Sigma | Mean | Median | Sigma |
| A | 15 | 174 | 98001 | 576.64 | 847 | 833 | 168.5 |
| A | 0 | 226 | 7643 | 40.41 | 847 | 833 | 168.5 |
| A | 11 | 29 | 7576 | 40.01 | 847 | 833 | 168.5 |
| B | 0 | 189 | 66907 | 421.28 | 832 | 813 | 156.9 |
| B | 7 | 220 | 39154 | 244.38 | 832 | 813 | 156.9 |
| B | 12 | 111 | 17743 | 107.91 | 832 | 813 | 156.9 |
| C | 4 | 254 | 714908 | 3920.19 | 795 | 803 | 182.2 |
| C | 14 | 238 | 124051 | 676.59 | 795 | 803 | 182.2 |
| C | 4 | 238 | 13502 | 69.71 | 795 | 803 | 182.2 |
| D | 7 | 238 | 1004013 | 4956.6 | 827 | 803 | 202.4 |
| D | 13 | 168 | 247142 | 1217.1 | 827 | 803 | 202.4 |
| D | 13 | 104 | 71489 | 349.24 | 827 | 803 | 202.4 |
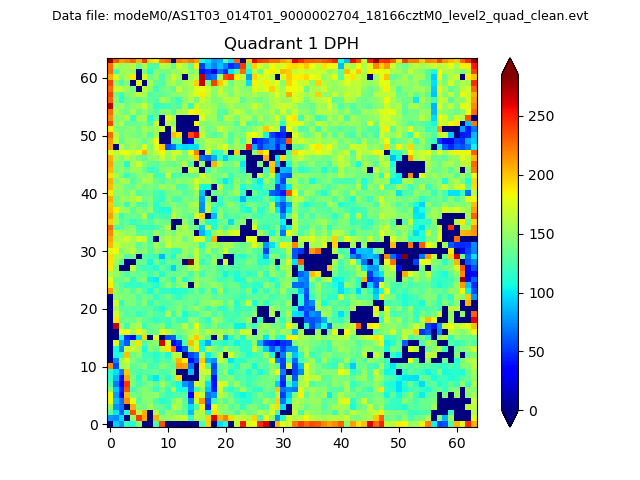
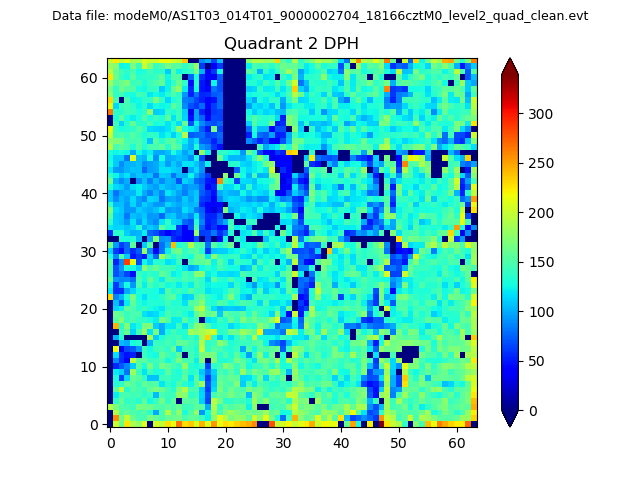
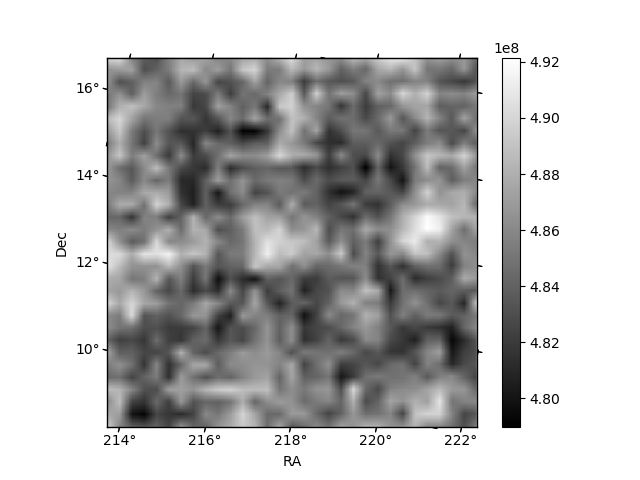
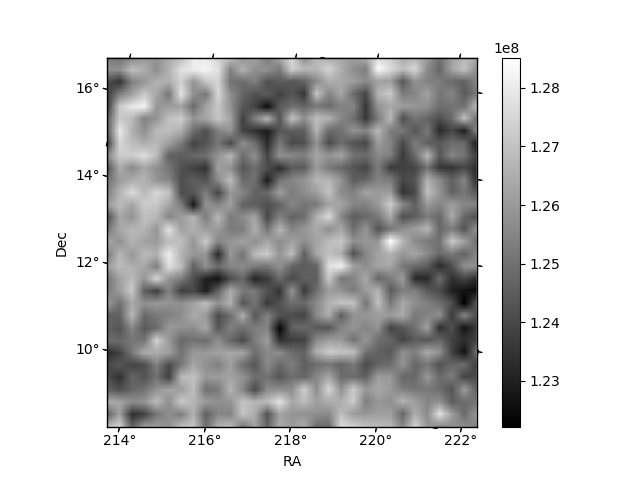
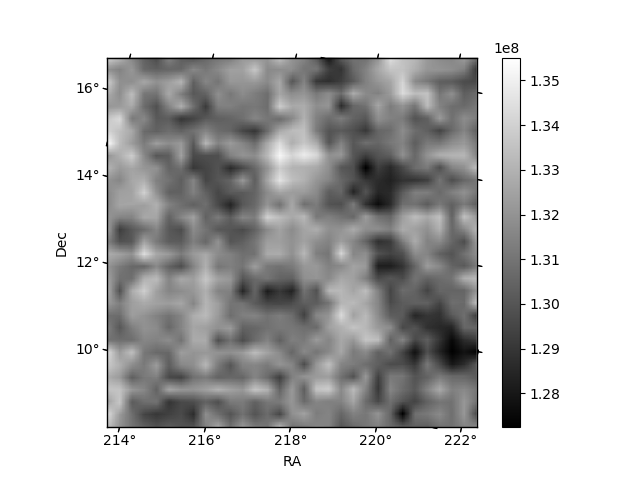
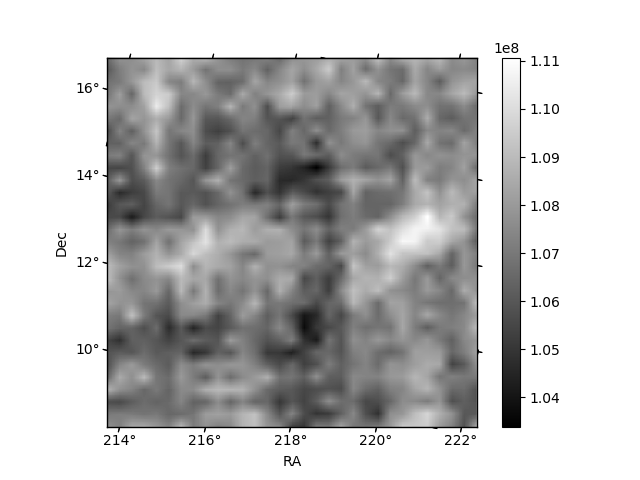
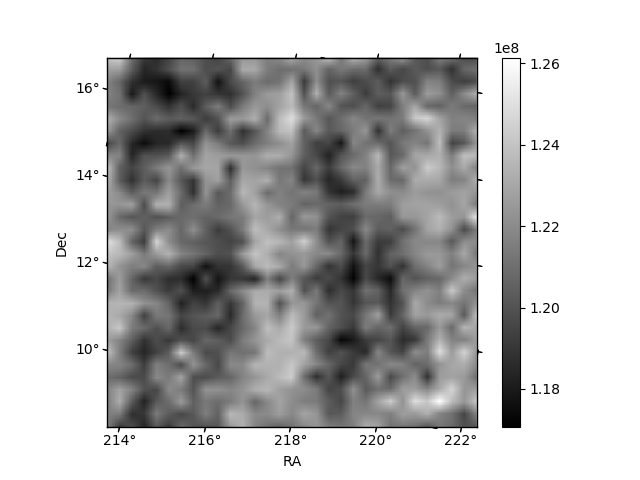
Histogram calculated using DETX and DETY for each event in the final _common_clean file
| Quadrant A |  |
 |
Quadrant B |
|---|---|---|---|
| Quadrant D | 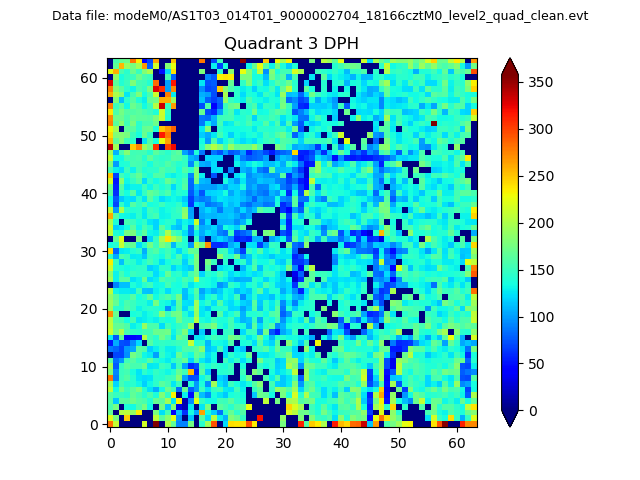 |
 |
Quadrant C |
| Plot type | Count rate plots | Images |
|---|---|---|
| Comparison with Poisson distribution Blue bars denote a histogram of data divided into 1 sec bins. Red curve is a Poisson curve with rate = median count rate of data. |
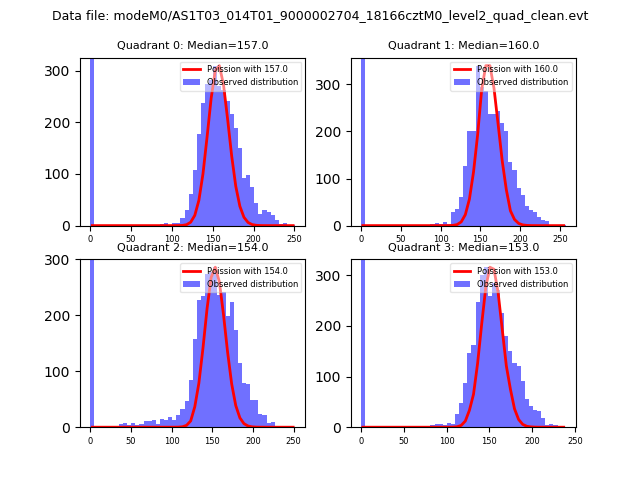 |
 |
| Quadrant-wise count rates Data is divided into 100 sec bins |
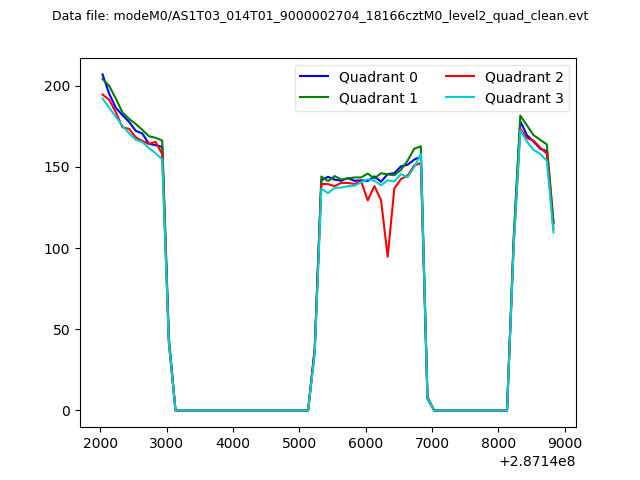 |
|
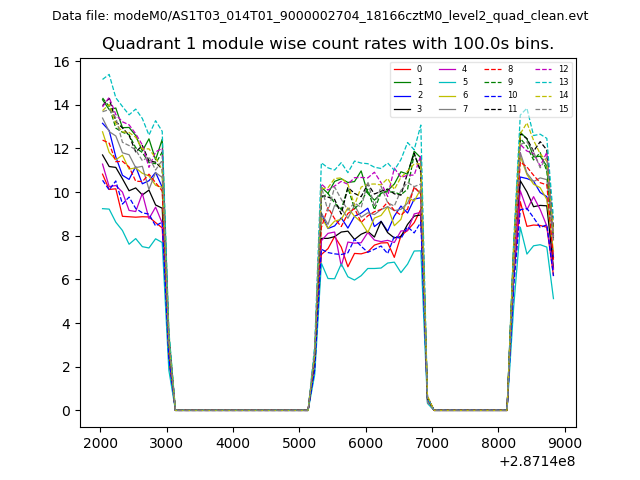
| Module-wise count rates for Quadrant A Data is divided into 100 sec bins |
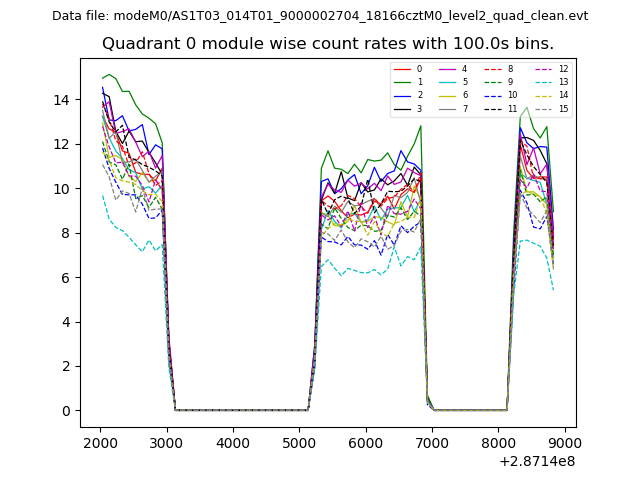 |
 |
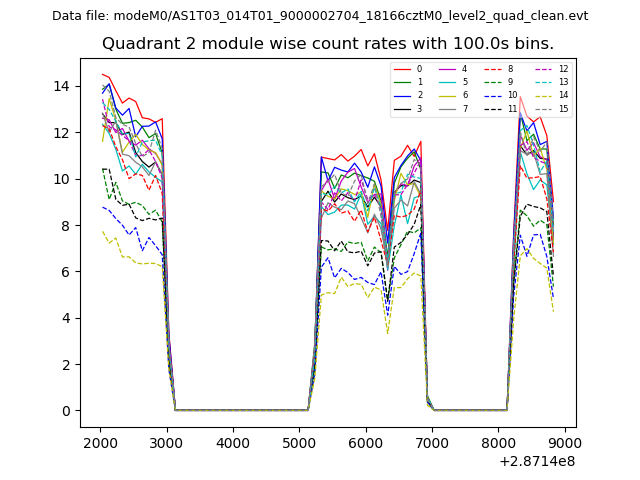
| Module-wise count rates for Quadrant B Data is divided into 100 sec bins |
 |
 |
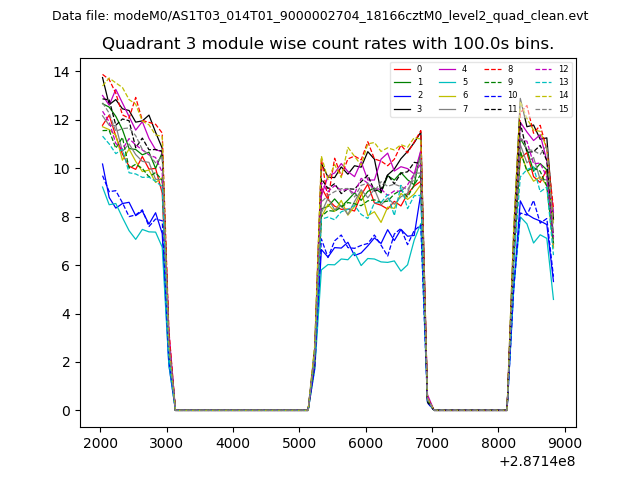
| Module-wise count rates for Quadrant C Data is divided into 100 sec bins |
 |
 |
| Module-wise count rates for Quadrant D Data is divided into 100 sec bins |
 |
 |
| Parameter | Plot |
|---|---|
| CZT HV Monitor | 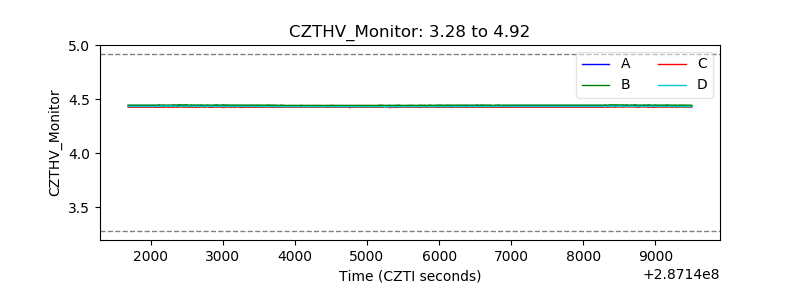 |
| D_VDD | 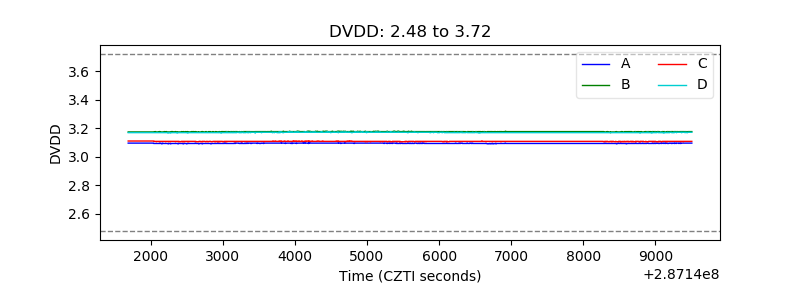 |
| Temperature 1 | 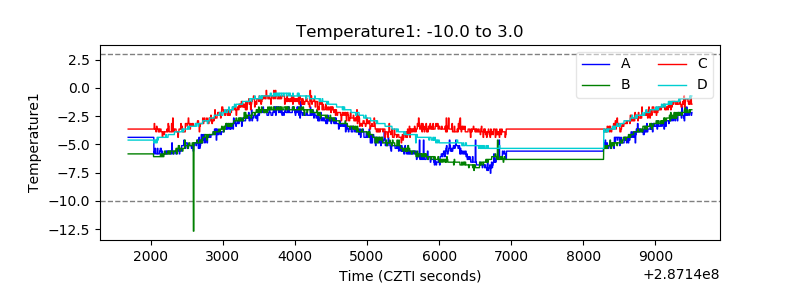 |
| Veto HV Monitor |  |
| Veto LLD | 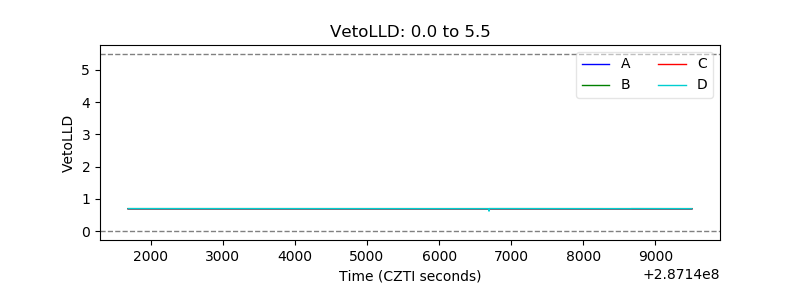 |
| Alpha Counter | 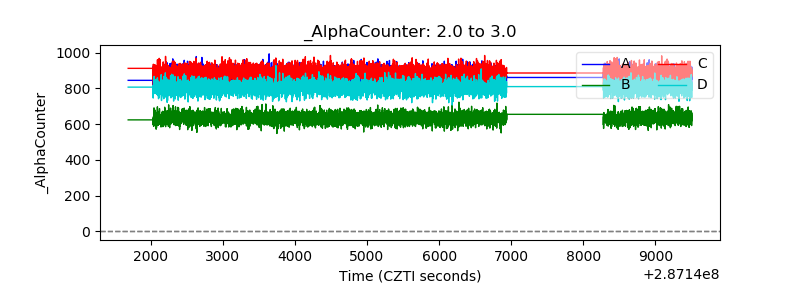 |
| _CPM_Rate | 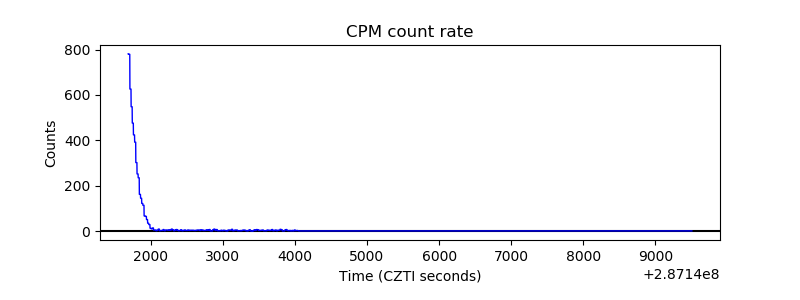 |
| CZT Counter | 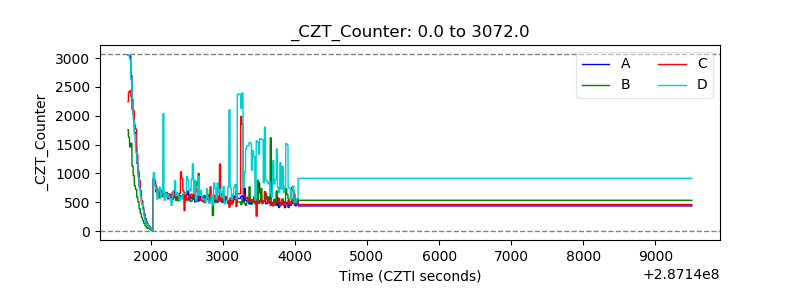 |
| +2.5 Volts monitor | 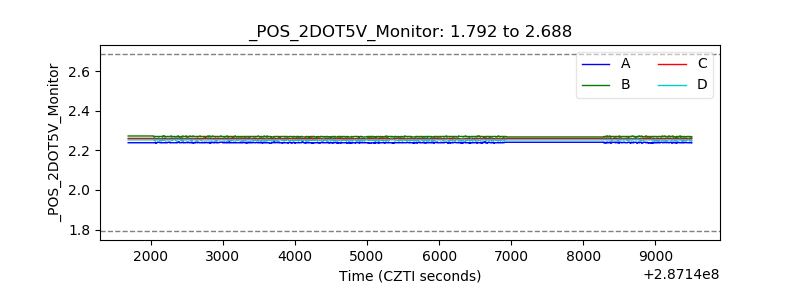 |
| +5 Volts monitor |  |
| _ROLL_ROT | 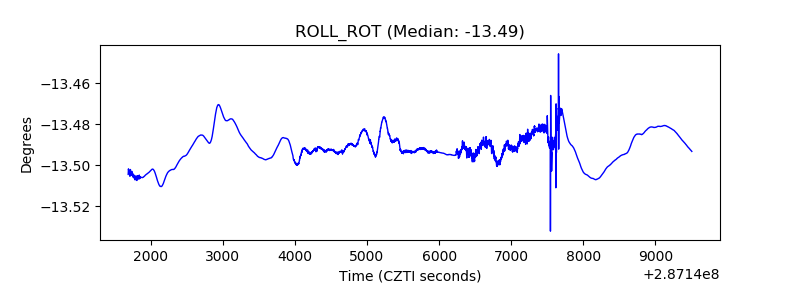 |
| _Roll_DEC | 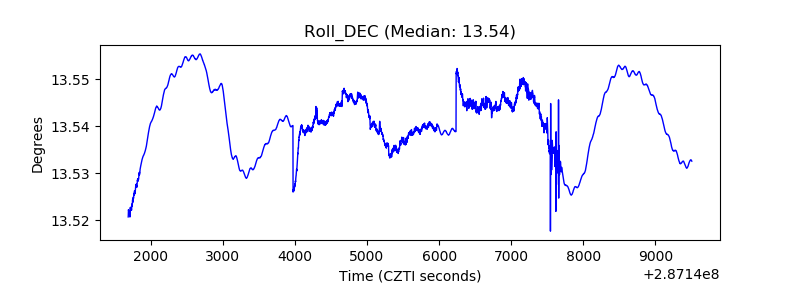 |
| _Roll_RA | 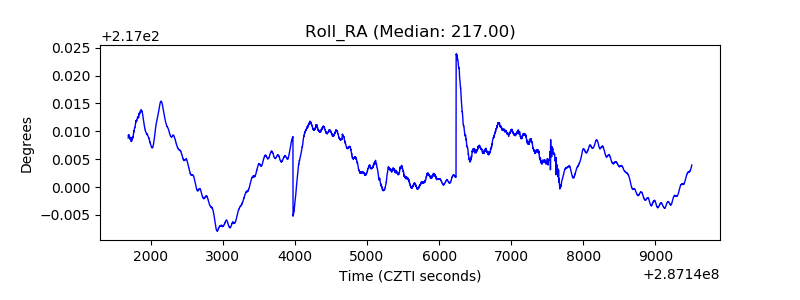 |
| Veto Counter | 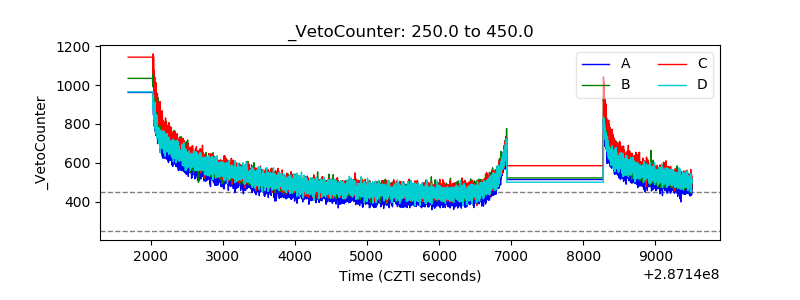 |