| Param | Original file | Final file |
|---|---|---|
| Filename | modeM0/AS1A05_063T02_9000002708_18171cztM0_level2.evt | modeM0/AS1A05_063T02_9000002708_18171cztM0_level2_quad_clean.evt |
| Size (bytes) | 749,174,400 | 100,431,360 |
| Size | 714.5 MB | 95.8 MB |
| Events in quadrant A | 4,176,021 | 630,483 |
| Events in quadrant B | 4,244,089 | 640,849 |
| Events in quadrant C | 5,435,378 | 614,931 |
| Events in quadrant D | 8,277,616 | 583,795 |
| Mode M9 | |||
|---|---|---|---|
| Quadrant | BADHDUFLAG | Total packets | Discarded packets |
| A | 0 | 5 | 0 |
| B | 0 | 5 | 0 |
| C | 0 | 5 | 0 |
| D | 0 | 5 | 0 |
| Mode M0 | |||
|---|---|---|---|
| Quadrant | BADHDUFLAG | Total packets | Discarded packets |
| A | 0 | 17887 | 2 |
| B | 0 | 18028 | 2 |
| C | 0 | 21739 | 2 |
| D | 0 | 30369 | 2 |
| Mode SS | |||
|---|---|---|---|
| Quadrant | BADHDUFLAG | Total packets | Discarded packets |
| A | 0 | 170 | 0 |
| B | 0 | 170 | 0 |
| C | 0 | 170 | 0 |
| D | 0 | 170 | 0 |
| Quadrant | Total seconds | Saturated seconds | Saturation percentage |
|---|---|---|---|
| A | 8212 | 96 | 1.169021% |
| B | 8212 | 207 | 2.520701% |
| C | 8212 | 639 | 7.781296% |
| D | 8212 | 933 | 11.361422% |
Noise dominated data is calculated using 1-second bins in cleaned event files. If a bin has >2000 counts, and if more than 50% of those come from <1% of pixels, then it is considered to be noise-dominated and hence unusable.
| Quadrant | # 1 sec bins | Bins with >0 counts | Bins with >2000 counts | High rate bins dominated by noise | Noise dominated (total time) | Noise dominated (detector-on time) | Marked lightcurve |
|---|---|---|---|---|---|---|---|
| A | 8767 | 8214 | 29 | 29 | 0.33% | 0.35% | 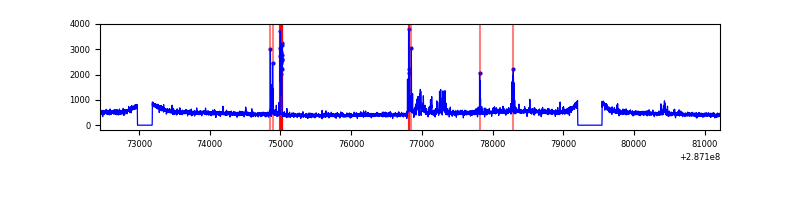 |
| B | 8767 | 8214 | 70 | 70 | 0.80% | 0.85% | 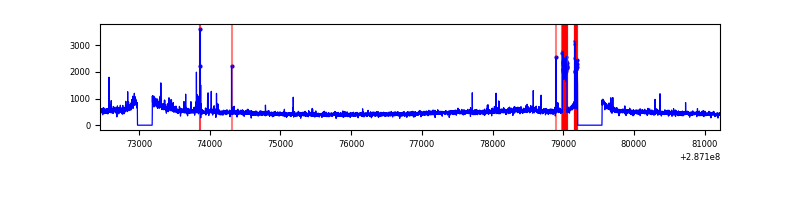 |
| C | 8767 | 8214 | 245 | 245 | 2.79% | 2.98% | 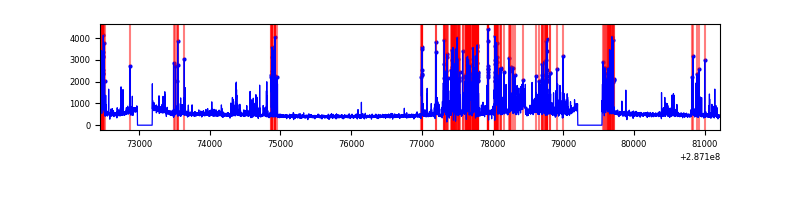 |
| D | 8767 | 8214 | 632 | 632 | 7.21% | 7.69% | 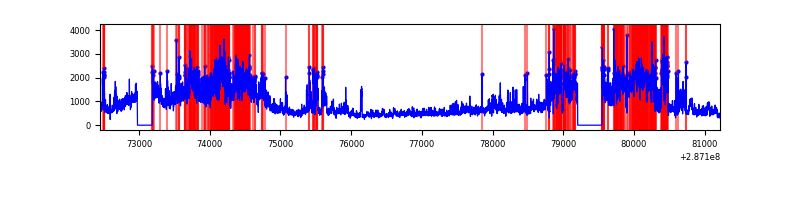 |
Top three noisy pixels from each quadrant. If the there are fewer than three noisy pixels in the level2.evt file, extra rows are filled as -1
| Pixel properties | Quadrant properties | ||||||
|---|---|---|---|---|---|---|---|
| Quadrant | DetID | PixID | Counts | Sigma | Mean | Median | Sigma |
| A | 15 | 174 | 279149 | 1355.53 | 1010 | 988 | 205.2 |
| A | 4 | 2 | 11470 | 51.08 | 1010 | 988 | 205.2 |
| A | 0 | 226 | 8919 | 38.65 | 1010 | 988 | 205.2 |
| B | 4 | 171 | 174003 | 883.05 | 1004 | 976 | 195.9 |
| B | 0 | 189 | 57538 | 288.66 | 1004 | 976 | 195.9 |
| B | 7 | 220 | 31447 | 155.51 | 1004 | 976 | 195.9 |
| C | 4 | 254 | 1578815 | 7113.04 | 945 | 951 | 221.8 |
| C | 14 | 238 | 142691 | 638.97 | 945 | 951 | 221.8 |
| C | 8 | 128 | 11577 | 47.9 | 945 | 951 | 221.8 |
| D | 7 | 238 | 4216327 | 18025.12 | 953 | 924 | 233.9 |
| D | 13 | 168 | 152238 | 647.02 | 953 | 924 | 233.9 |
| D | 10 | 70 | 61641 | 259.63 | 953 | 924 | 233.9 |
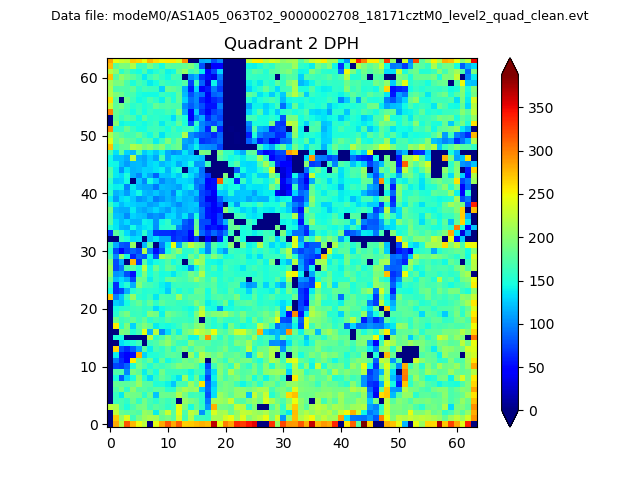
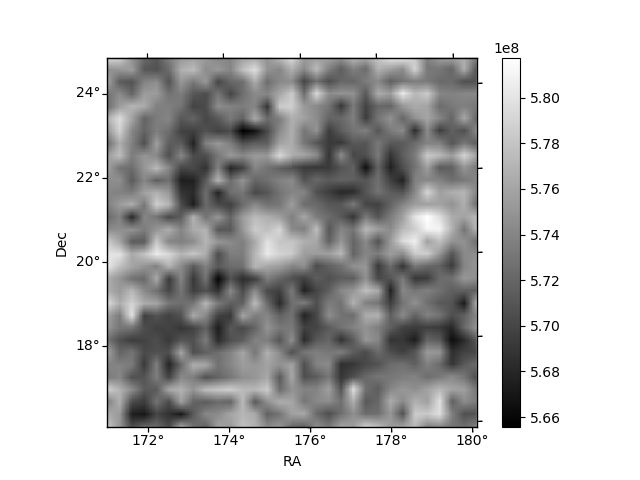
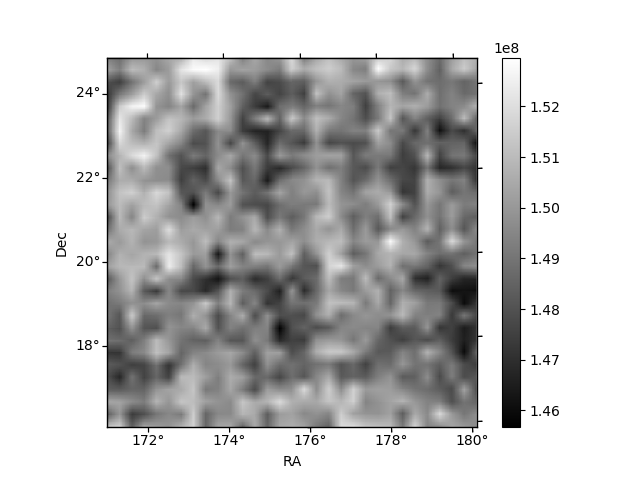
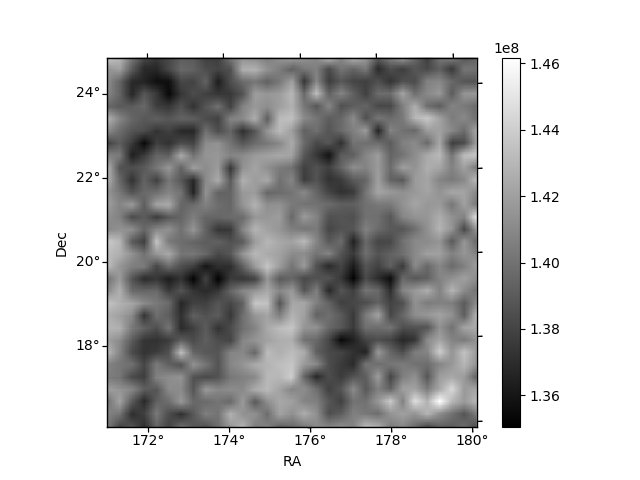
Histogram calculated using DETX and DETY for each event in the final _common_clean file
| Quadrant A | 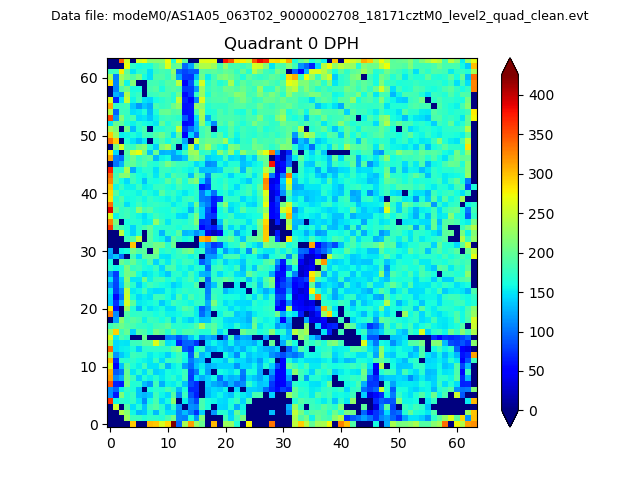 |
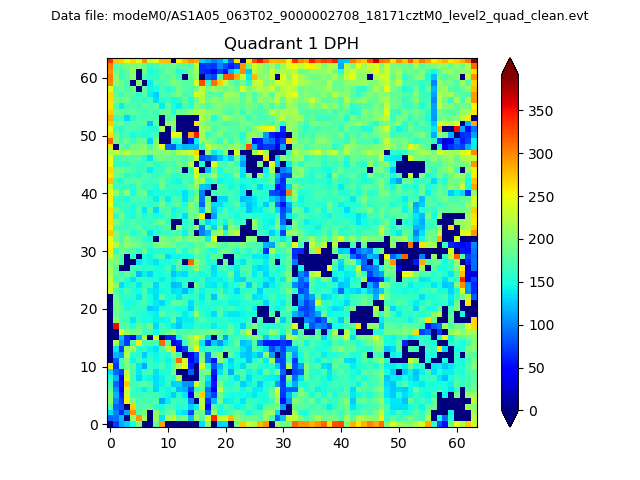 |
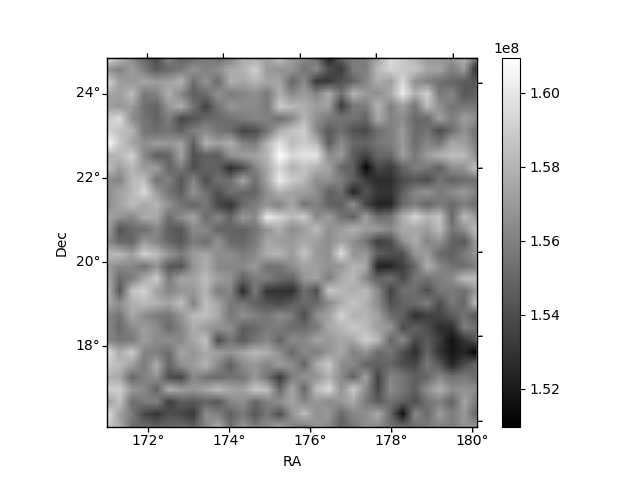
Quadrant B |
|---|---|---|---|
| Quadrant D | 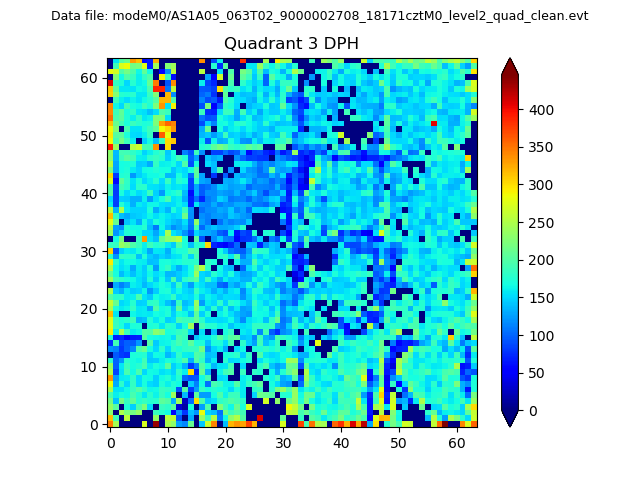 |
 |
Quadrant C |
| Plot type | Count rate plots | Images |
|---|---|---|
| Comparison with Poisson distribution Blue bars denote a histogram of data divided into 1 sec bins. Red curve is a Poisson curve with rate = median count rate of data. |
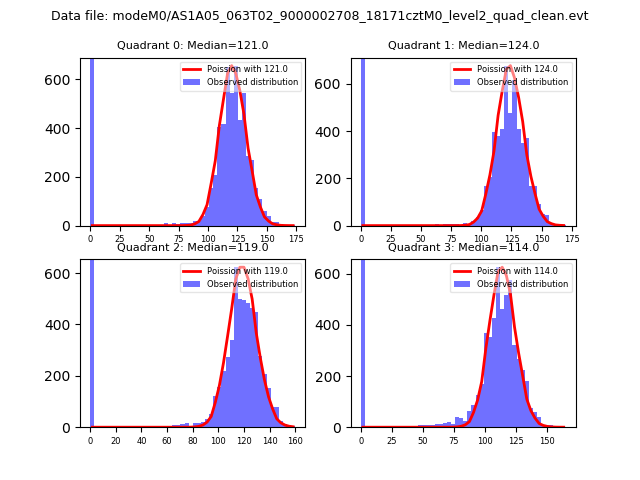 |
 |
| Quadrant-wise count rates Data is divided into 100 sec bins |
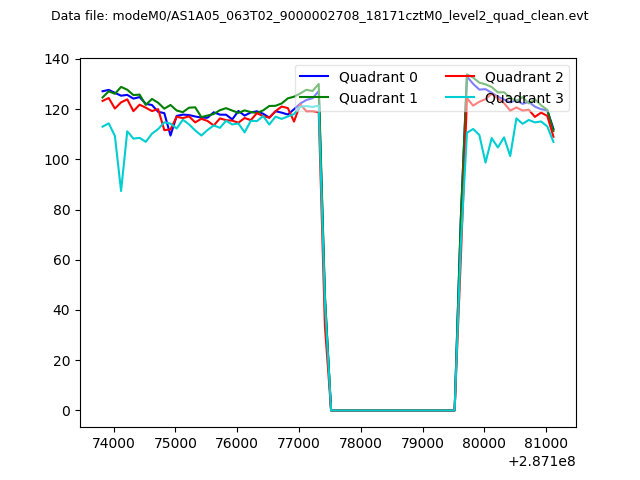 |
|
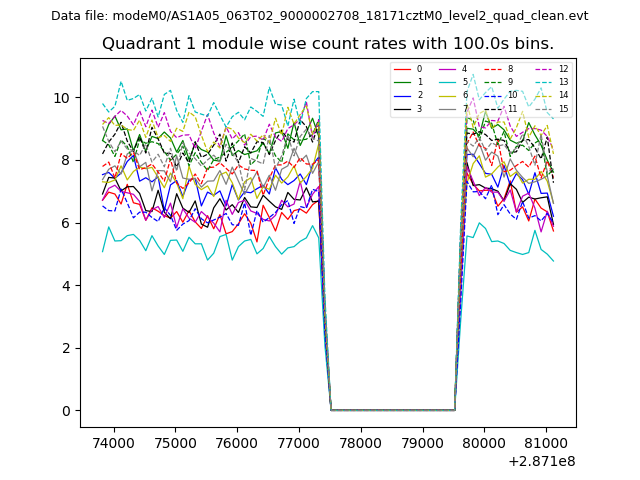
| Module-wise count rates for Quadrant A Data is divided into 100 sec bins |
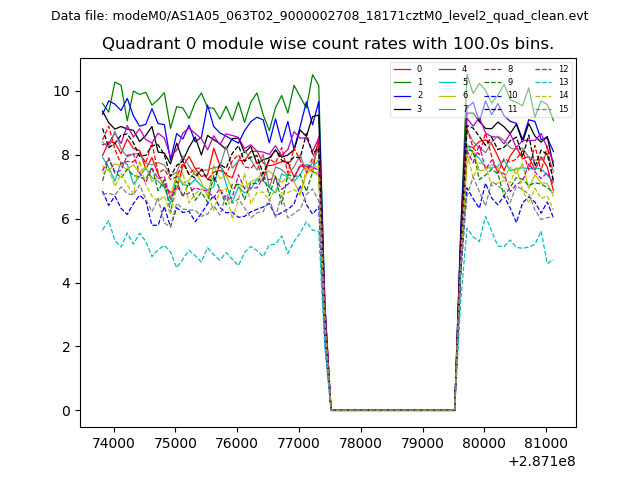 |
 |
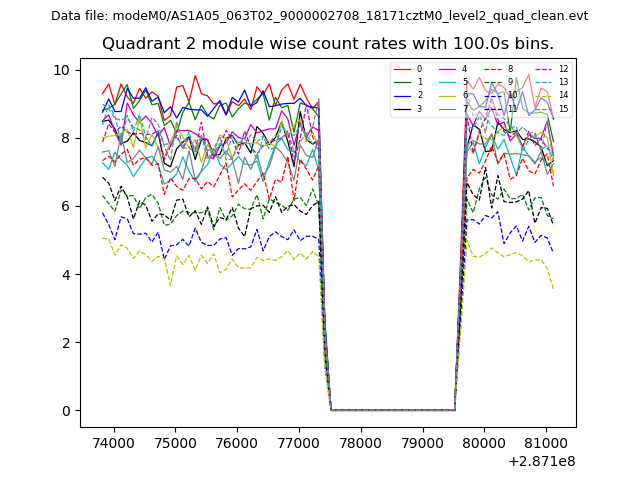
| Module-wise count rates for Quadrant B Data is divided into 100 sec bins |
 |
 |
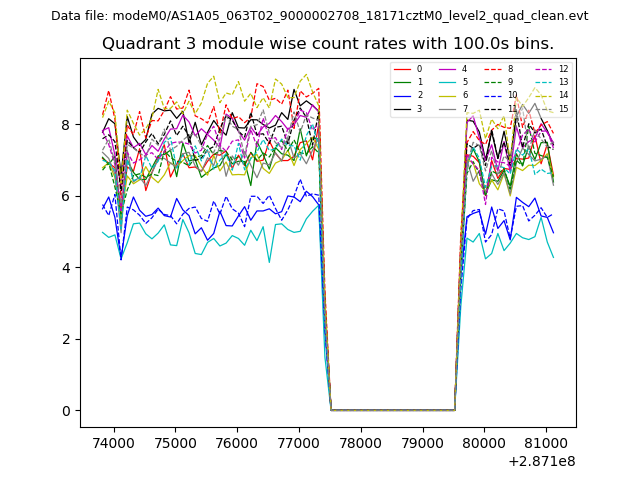
| Module-wise count rates for Quadrant C Data is divided into 100 sec bins |
 |
 |
| Module-wise count rates for Quadrant D Data is divided into 100 sec bins |
 |
 |
| Parameter | Plot |
|---|---|
| CZT HV Monitor | 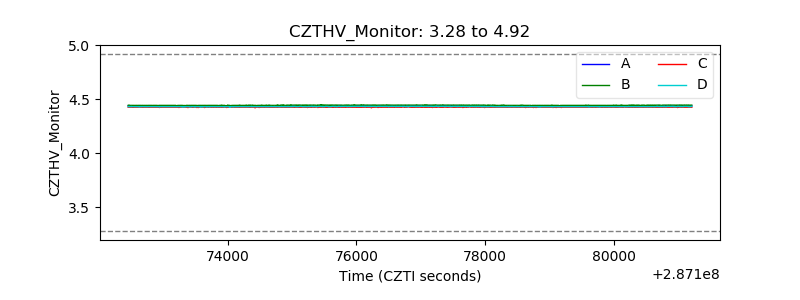 |
| D_VDD | 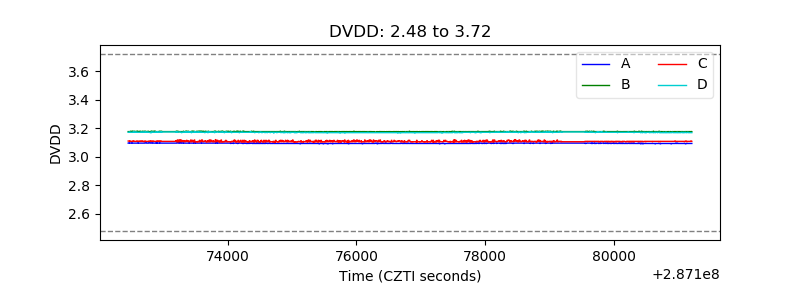 |
| Temperature 1 | 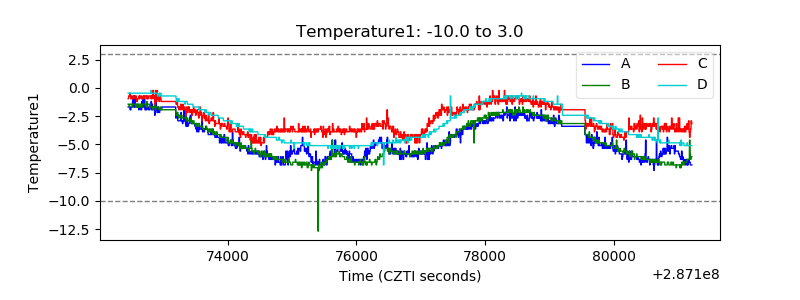 |
| Veto HV Monitor |  |
| Veto LLD | 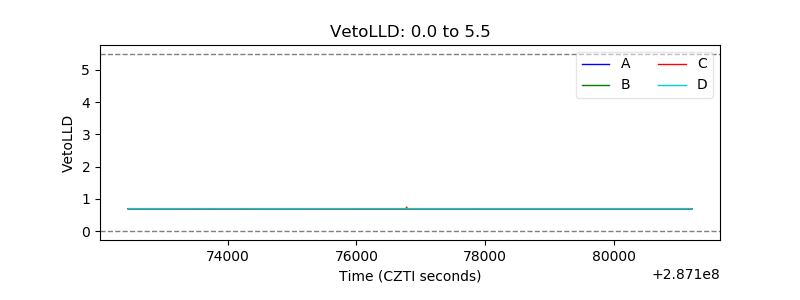 |
| Alpha Counter | 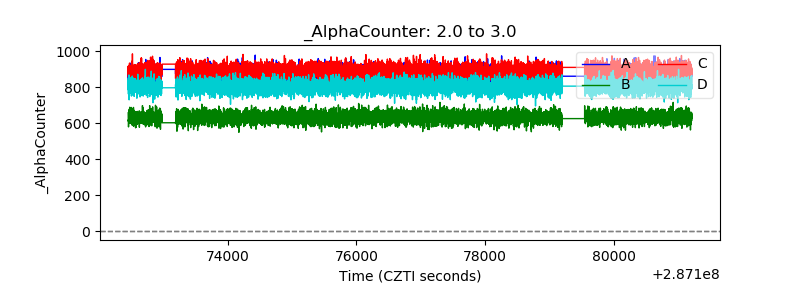 |
| _CPM_Rate | 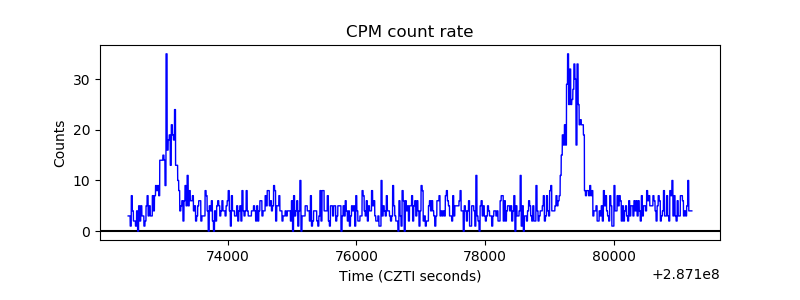 |
| CZT Counter | 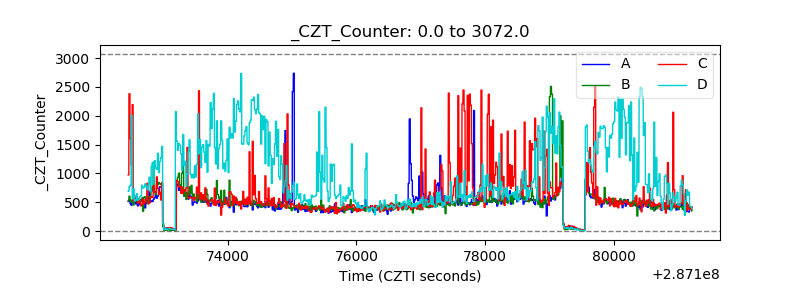 |
| +2.5 Volts monitor |  |
| +5 Volts monitor | 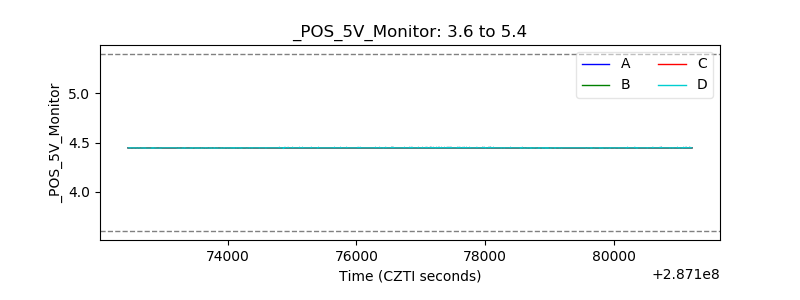 |
| _ROLL_ROT | 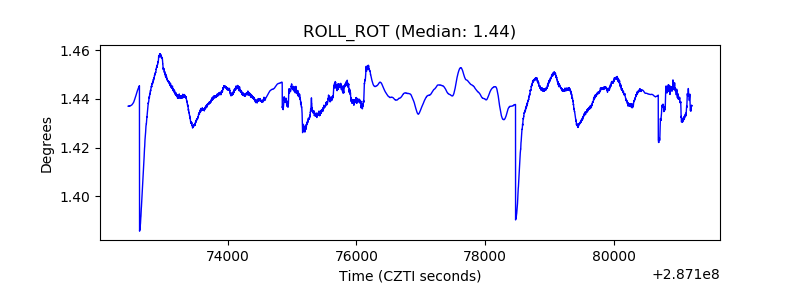 |
| _Roll_DEC | 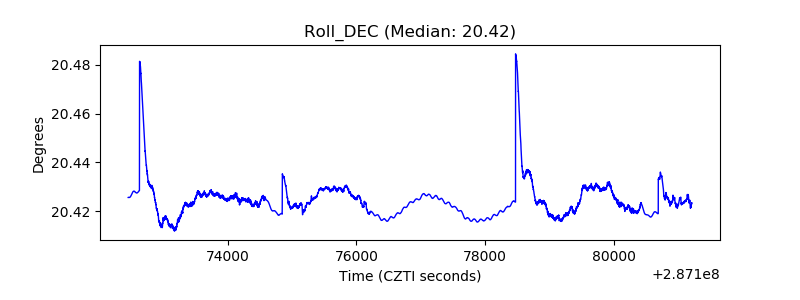 |
| _Roll_RA | 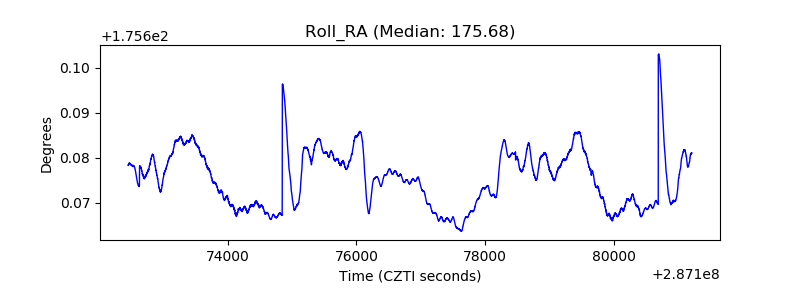 |
| Veto Counter | 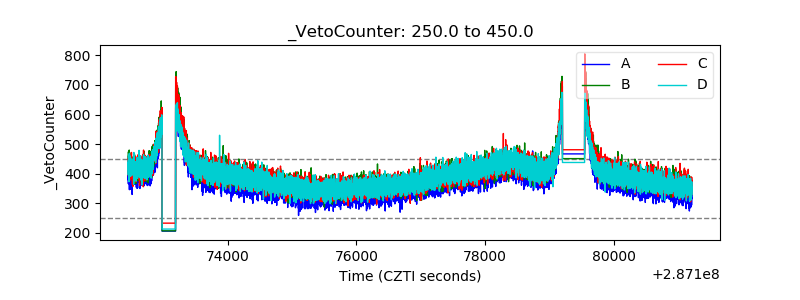 |