| Param | Original file | Final file |
|---|---|---|
| Filename | modeM0/AS1A05_063T02_9000002708_18173cztM0_level2.evt | modeM0/AS1A05_063T02_9000002708_18173cztM0_level2_quad_clean.evt |
| Size (bytes) | 48,372,480 | 6,940,800 |
| Size | 46.1 MB | 6.6 MB |
| Events in quadrant A | 334,259 | 45,843 |
| Events in quadrant B | 332,869 | 46,943 |
| Events in quadrant C | 322,892 | 39,100 |
| Events in quadrant D | 426,829 | 24,400 |
| Mode M9 | |||
|---|---|---|---|
| Quadrant | BADHDUFLAG | Total packets | Discarded packets |
| A | 0 | 8 | 8 |
| B | 0 | 8 | 8 |
| C | 0 | 7 | 7 |
| D | 0 | 11 | 11 |
| Mode M0 | |||
|---|---|---|---|
| Quadrant | BADHDUFLAG | Total packets | Discarded packets |
| A | 0 | 13379 | 11951 |
| B | 0 | 13760 | 12335 |
| C | 0 | 14182 | 12797 |
| D | 0 | 22464 | 20855 |
| Mode SS | |||
|---|---|---|---|
| Quadrant | BADHDUFLAG | Total packets | Discarded packets |
| A | 0 | 140 | 123 |
| B | 0 | 135 | 120 |
| C | 0 | 128 | 112 |
| D | 0 | 137 | 123 |
| Quadrant | Total seconds | Saturated seconds | Saturation percentage |
|---|---|---|---|
| A | 712 | 1 | 0.140449% |
| B | 708 | 0 | 0.000000% |
| C | 669 | 4 | 0.597907% |
| D | 496 | 9 | 1.814516% |
Noise dominated data is calculated using 1-second bins in cleaned event files. If a bin has >2000 counts, and if more than 50% of those come from <1% of pixels, then it is considered to be noise-dominated and hence unusable.
| Quadrant | # 1 sec bins | Bins with >0 counts | Bins with >2000 counts | High rate bins dominated by noise | Noise dominated (total time) | Noise dominated (detector-on time) | Marked lightcurve |
|---|---|---|---|---|---|---|---|
| A | 7509 | 981 | 0 | 0 | 0.00% | 0.00% | 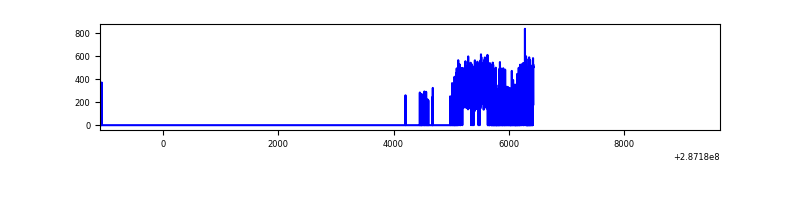 |
| B | 10759 | 971 | 0 | 0 | 0.00% | 0.00% | 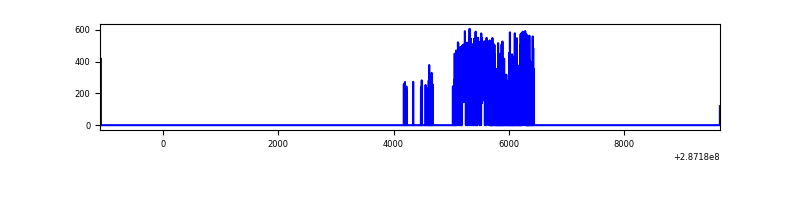 |
| C | 7504 | 926 | 0 | 0 | 0.00% | 0.00% | 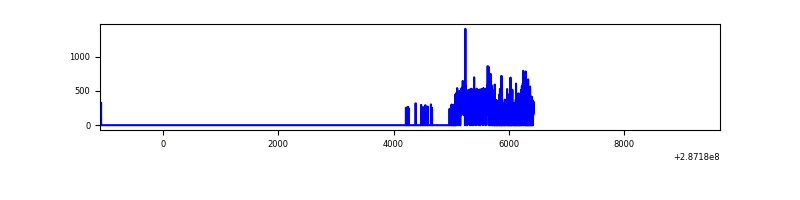 |
| D | 2087 | 708 | 2 | 2 | 0.10% | 0.28% | 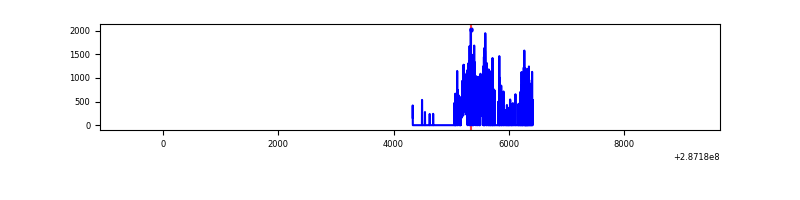 |
Top three noisy pixels from each quadrant. If the there are fewer than three noisy pixels in the level2.evt file, extra rows are filled as -1
| Pixel properties | Quadrant properties | ||||||
|---|---|---|---|---|---|---|---|
| Quadrant | DetID | PixID | Counts | Sigma | Mean | Median | Sigma |
| A | 0 | 226 | 714 | 31.58 | 86 | 84 | 20.0 |
| A | 3 | 137 | 657 | 28.72 | 86 | 84 | 20.0 |
| A | 12 | 194 | 645 | 28.12 | 86 | 84 | 20.0 |
| B | 0 | 189 | 2069 | 107.92 | 84 | 82 | 18.4 |
| B | 12 | 111 | 2051 | 106.94 | 84 | 82 | 18.4 |
| B | 11 | 111 | 1799 | 93.25 | 84 | 82 | 18.4 |
| C | 4 | 254 | 13576 | 687.04 | 76 | 76 | 19.6 |
| C | 14 | 238 | 11924 | 602.96 | 76 | 76 | 19.6 |
| C | 13 | 61 | 508 | 21.99 | 76 | 76 | 19.6 |
| D | 7 | 238 | 177843 | 11094.27 | 57 | 55 | 16.0 |
| D | 9 | 64 | 26926 | 1676.8 | 57 | 55 | 16.0 |
| D | 1 | 52 | 2480 | 151.32 | 57 | 55 | 16.0 |
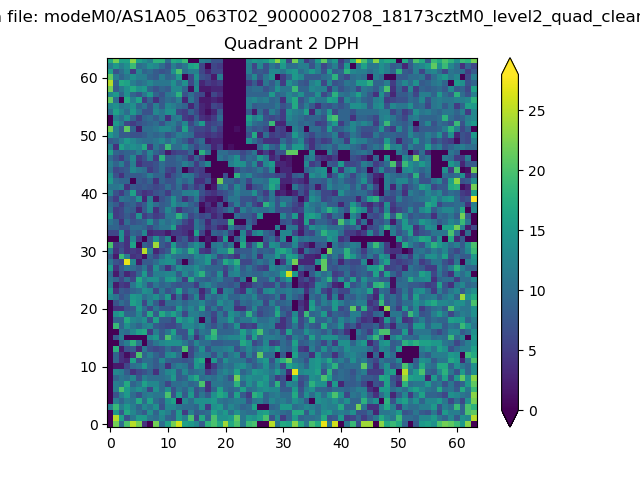
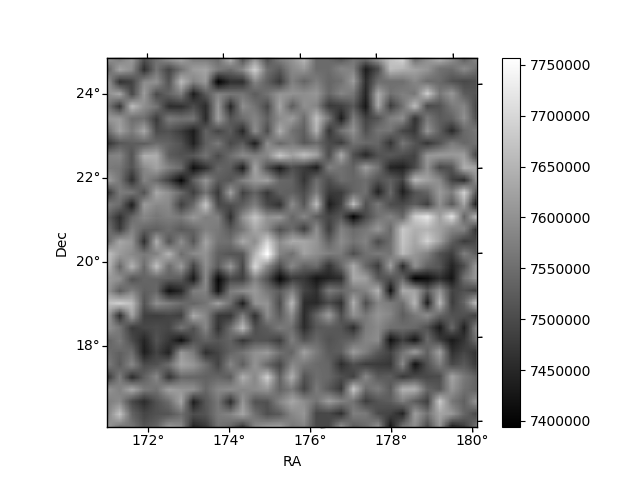
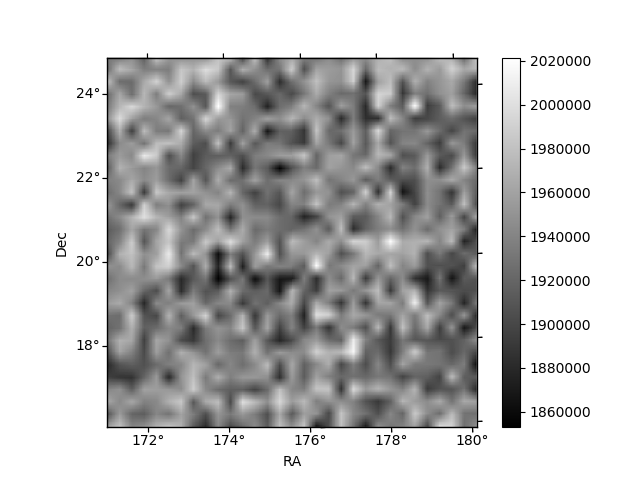
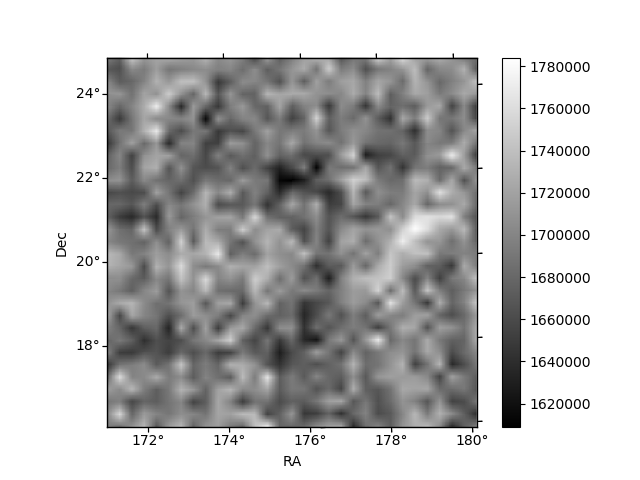
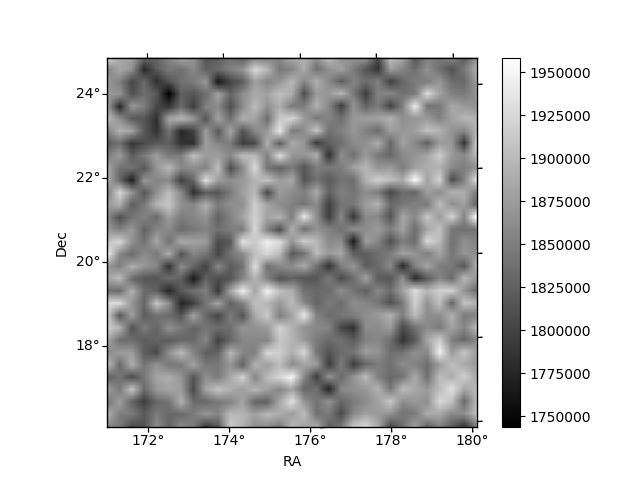
Histogram calculated using DETX and DETY for each event in the final _common_clean file
| Quadrant A | 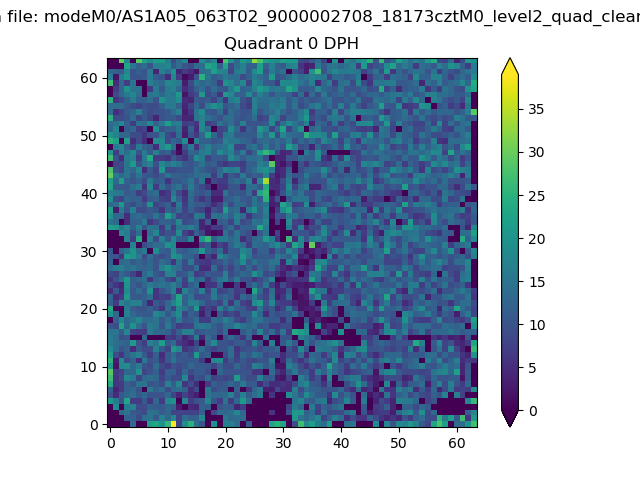 |
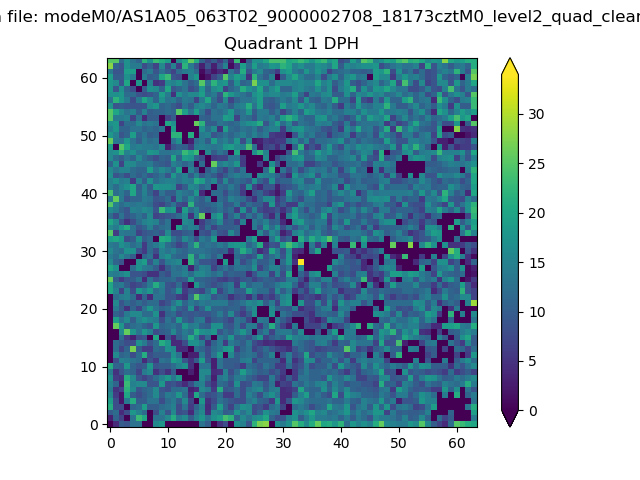 |
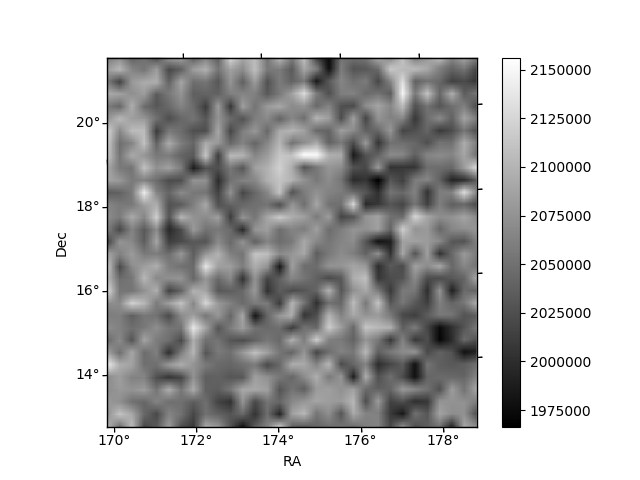
Quadrant B |
|---|---|---|---|
| Quadrant D | 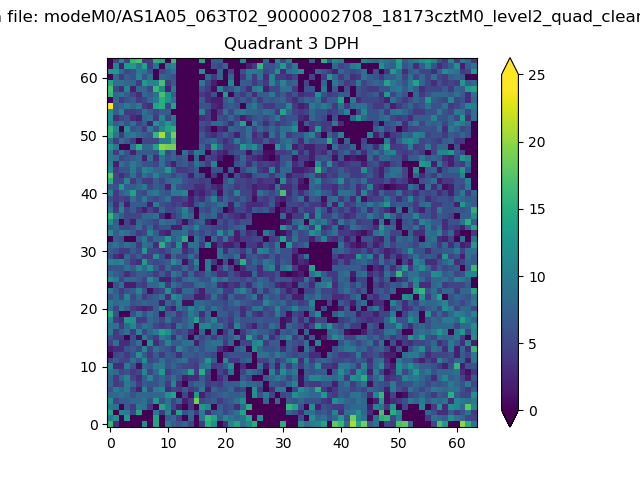 |
 |
Quadrant C |
| Plot type | Count rate plots | Images |
|---|---|---|
| Comparison with Poisson distribution Blue bars denote a histogram of data divided into 1 sec bins. Red curve is a Poisson curve with rate = median count rate of data. |
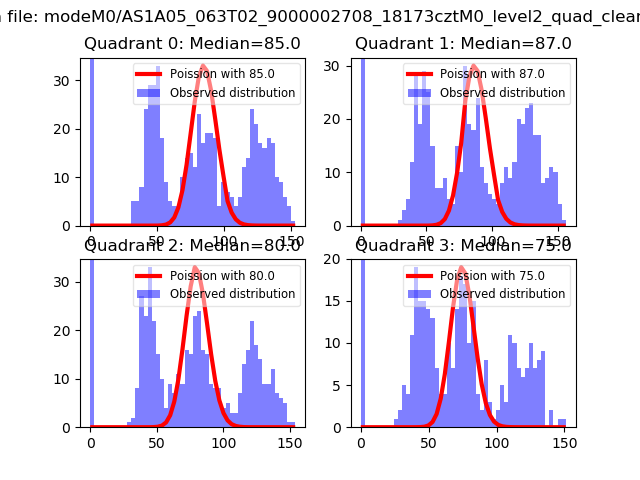 |
 |
| Quadrant-wise count rates Data is divided into 100 sec bins |
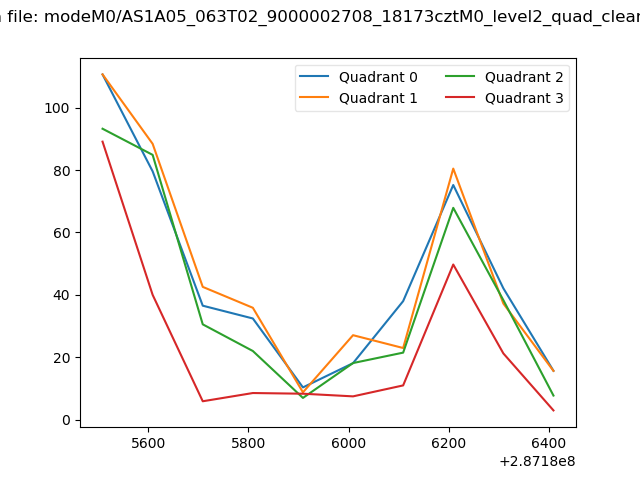 |
|
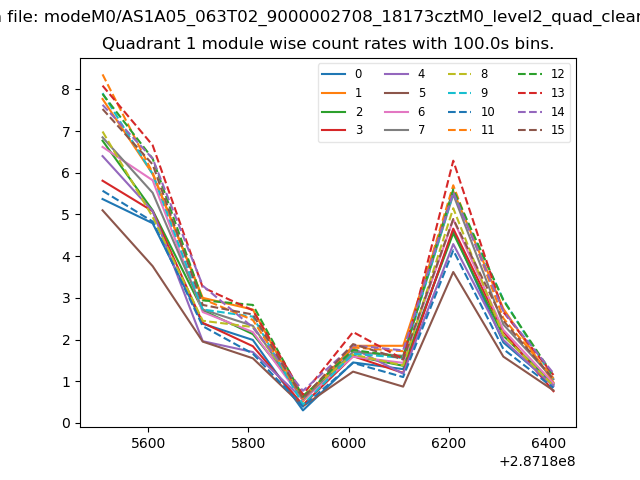
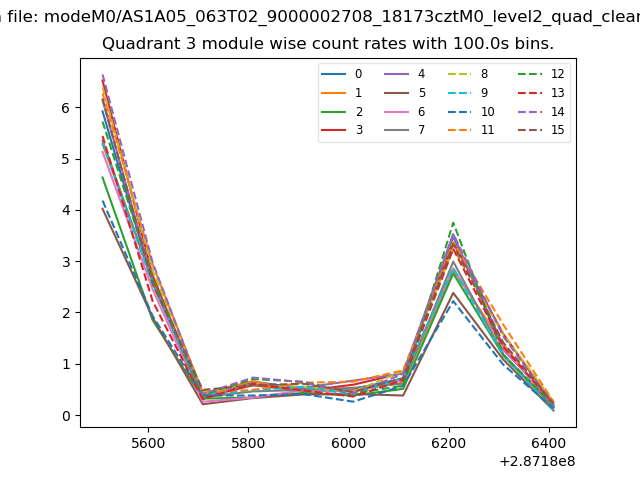
| Module-wise count rates for Quadrant A Data is divided into 100 sec bins |
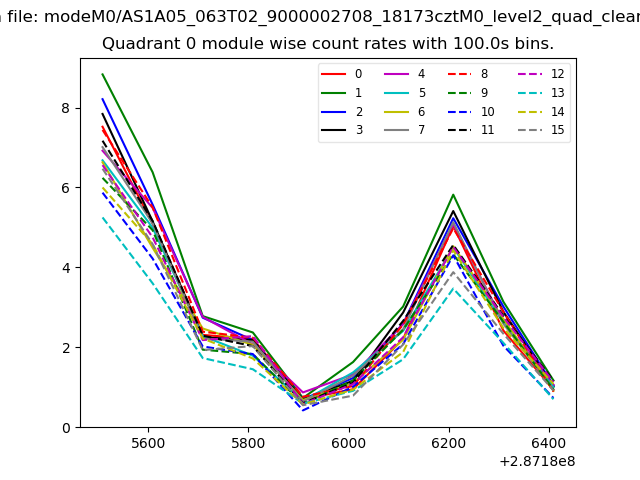 |
 |
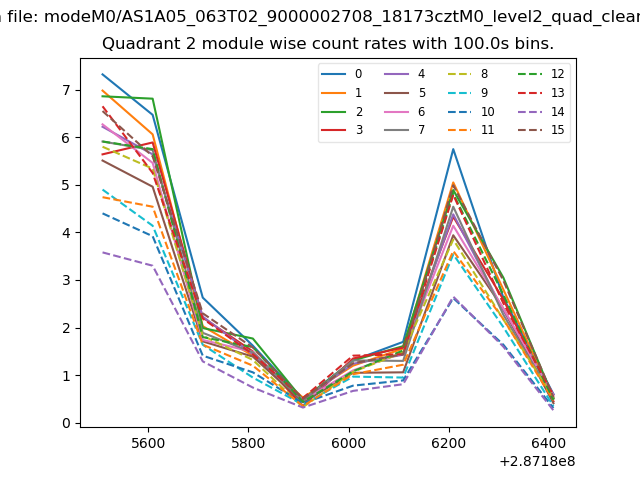
| Module-wise count rates for Quadrant B Data is divided into 100 sec bins |
 |
 |
| Module-wise count rates for Quadrant C Data is divided into 100 sec bins |
 |
 |
| Module-wise count rates for Quadrant D Data is divided into 100 sec bins |
 |
 |
| Parameter | Plot |
|---|---|
| CZT HV Monitor | 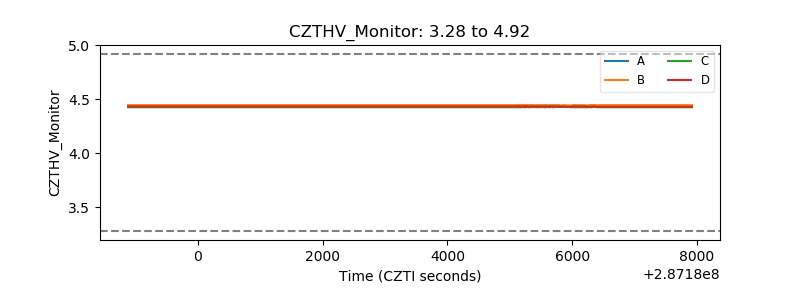 |
| D_VDD | 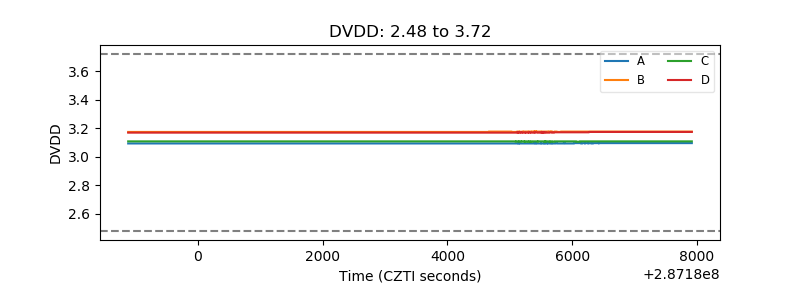 |
| Temperature 1 | 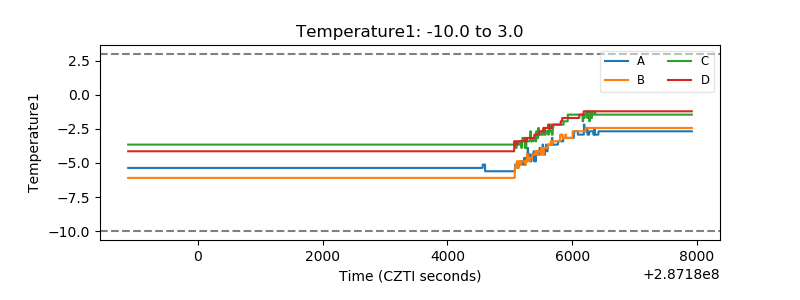 |
| Veto HV Monitor | 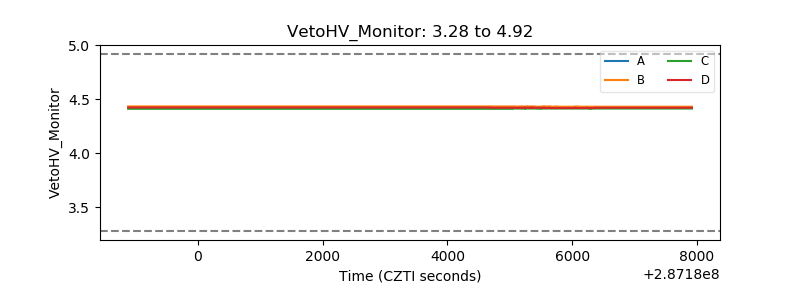 |
| Veto LLD | 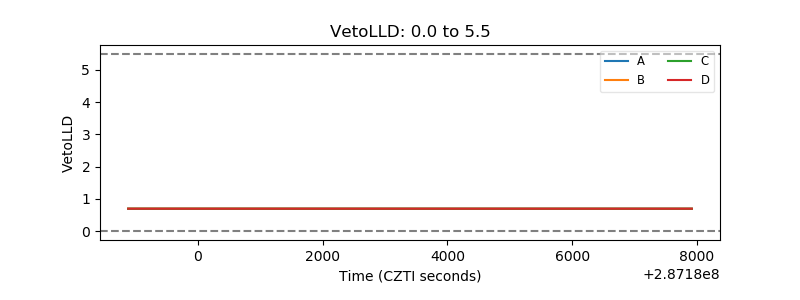 |
| Alpha Counter | 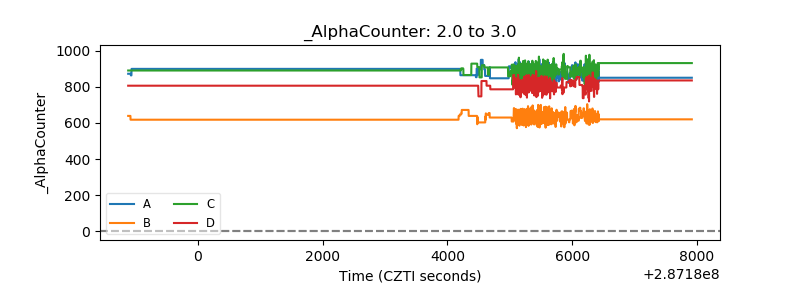 |
| _CPM_Rate | 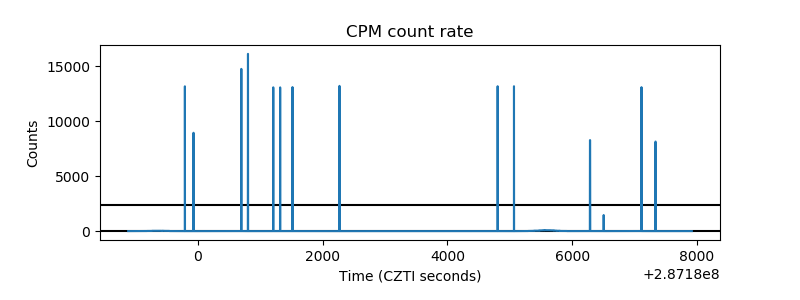 |
| CZT Counter | 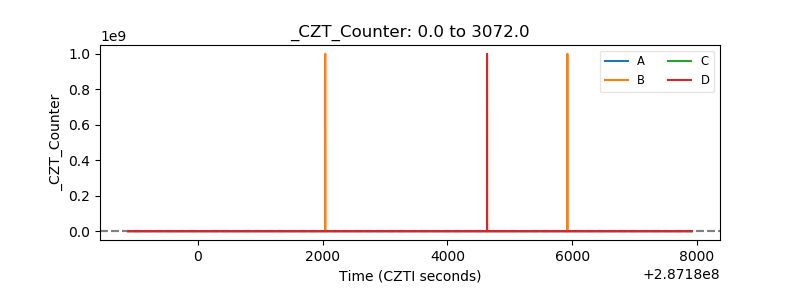 |
| +2.5 Volts monitor |  |
| +5 Volts monitor |  |
| _ROLL_ROT | 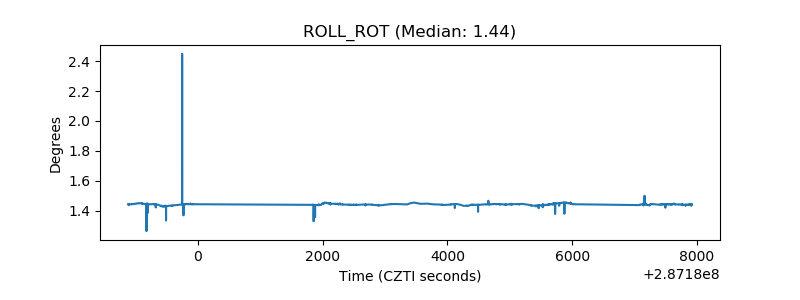 |
| _Roll_DEC | 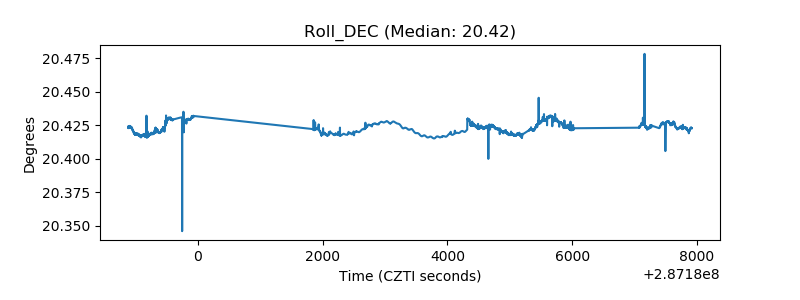 |
| _Roll_RA |  |
| Veto Counter | 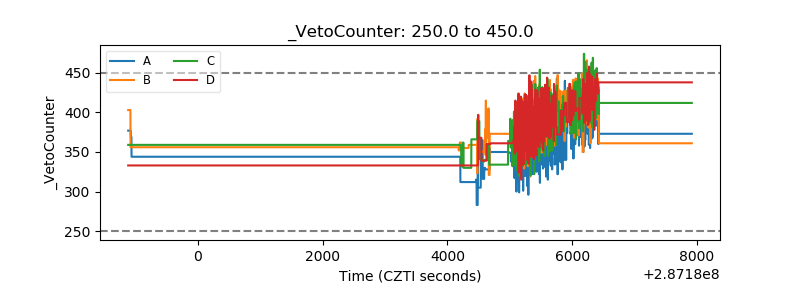 |