| Param | Original file | Final file |
|---|---|---|
| Filename | modeM0/AS1A05_063T02_9000002708_18174cztM0_level2.evt | modeM0/AS1A05_063T02_9000002708_18174cztM0_level2_quad_clean.evt |
| Size (bytes) | 347,771,520 | 64,405,440 |
| Size | 331.7 MB | 61.4 MB |
| Events in quadrant A | 2,560,354 | 399,557 |
| Events in quadrant B | 2,568,877 | 402,706 |
| Events in quadrant C | 2,534,242 | 395,192 |
| Events in quadrant D | 2,509,201 | 383,641 |
| Mode M9 | |||
|---|---|---|---|
| Quadrant | BADHDUFLAG | Total packets | Discarded packets |
| A | 0 | 11 | 5 |
| B | 0 | 11 | 1 |
| C | 0 | 11 | 2 |
| D | 0 | 12 | 4 |
| Mode M0 | |||
|---|---|---|---|
| Quadrant | BADHDUFLAG | Total packets | Discarded packets |
| A | 0 | 15138 | 3826 |
| B | 0 | 14673 | 3583 |
| C | 0 | 14542 | 3516 |
| D | 0 | 14950 | 3798 |
| Mode SS | |||
|---|---|---|---|
| Quadrant | BADHDUFLAG | Total packets | Discarded packets |
| A | 0 | 140 | 34 |
| B | 0 | 142 | 34 |
| C | 0 | 142 | 36 |
| D | 0 | 141 | 39 |
| Quadrant | Total seconds | Saturated seconds | Saturation percentage |
|---|---|---|---|
| A | 5257 | 46 | 0.875024% |
| B | 5258 | 50 | 0.950932% |
| C | 5295 | 52 | 0.982059% |
| D | 5248 | 34 | 0.647866% |
Noise dominated data is calculated using 1-second bins in cleaned event files. If a bin has >2000 counts, and if more than 50% of those come from <1% of pixels, then it is considered to be noise-dominated and hence unusable.
| Quadrant | # 1 sec bins | Bins with >0 counts | Bins with >2000 counts | High rate bins dominated by noise | Noise dominated (total time) | Noise dominated (detector-on time) | Marked lightcurve |
|---|---|---|---|---|---|---|---|
| A | 7856 | 5717 | 6 | 6 | 0.08% | 0.10% |  |
| B | 7853 | 5714 | 29 | 29 | 0.37% | 0.51% |  |
| C | 7858 | 5721 | 5 | 5 | 0.06% | 0.09% |  |
| D | 7858 | 5672 | 17 | 17 | 0.22% | 0.30% |  |
Top three noisy pixels from each quadrant. If the there are fewer than three noisy pixels in the level2.evt file, extra rows are filled as -1
| Pixel properties | Quadrant properties | ||||||
|---|---|---|---|---|---|---|---|
| Quadrant | DetID | PixID | Counts | Sigma | Mean | Median | Sigma |
| A | 15 | 174 | 192007 | 1533.27 | 614 | 599 | 124.8 |
| A | 0 | 226 | 5393 | 38.4 | 614 | 599 | 124.8 |
| A | 3 | 137 | 4888 | 34.36 | 614 | 599 | 124.8 |
| B | 10 | 247 | 133731 | 1123.07 | 614 | 599 | 118.5 |
| B | 12 | 111 | 14418 | 116.57 | 614 | 599 | 118.5 |
| B | 11 | 111 | 12467 | 100.12 | 614 | 599 | 118.5 |
| C | 4 | 254 | 100274 | 704.41 | 595 | 597 | 141.5 |
| C | 14 | 238 | 92296 | 648.03 | 595 | 597 | 141.5 |
| C | 3 | 233 | 19941 | 136.7 | 595 | 597 | 141.5 |
| D | 7 | 238 | 87615 | 602.0 | 596 | 580 | 144.6 |
| D | 9 | 64 | 48660 | 332.56 | 596 | 580 | 144.6 |
| D | 1 | 52 | 48280 | 329.93 | 596 | 580 | 144.6 |
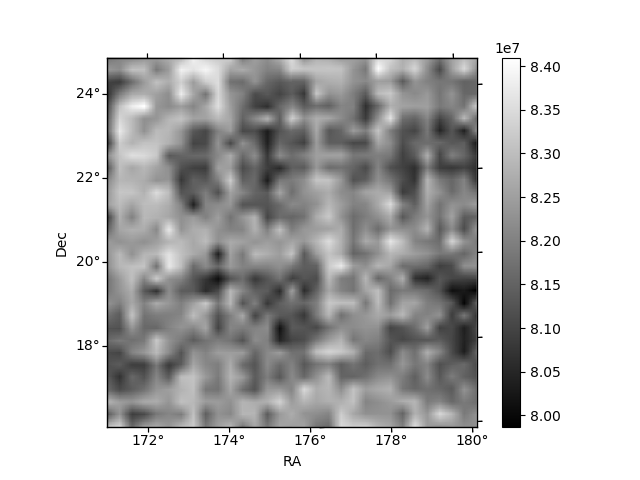
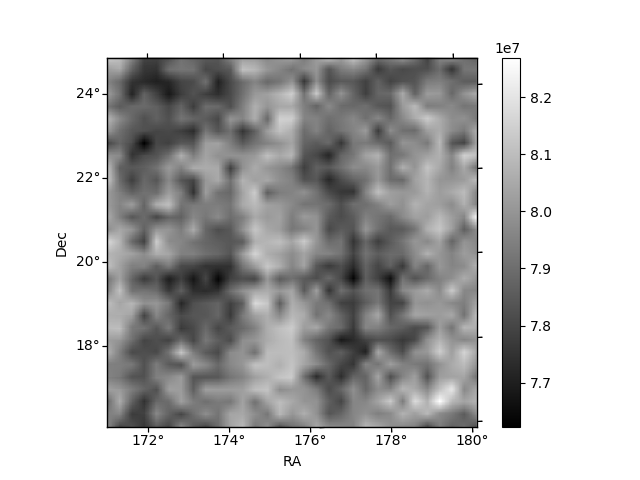
Histogram calculated using DETX and DETY for each event in the final _common_clean file
| Quadrant A | 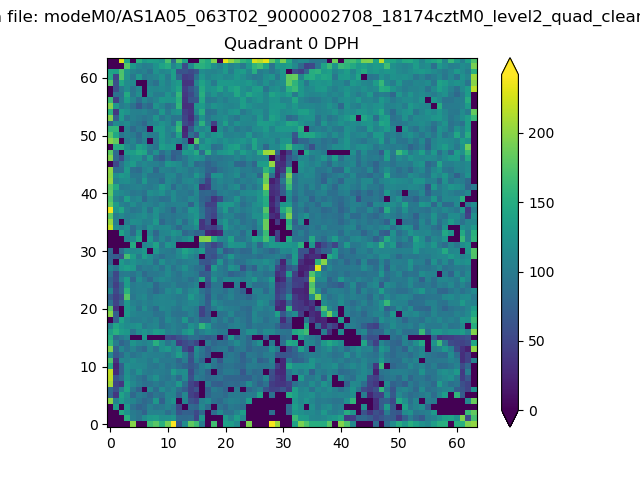 |
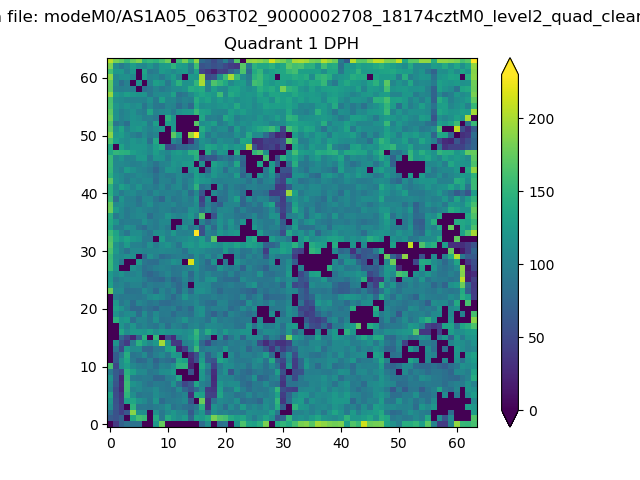 |
Quadrant B |
|---|---|---|---|
| Quadrant D |  |
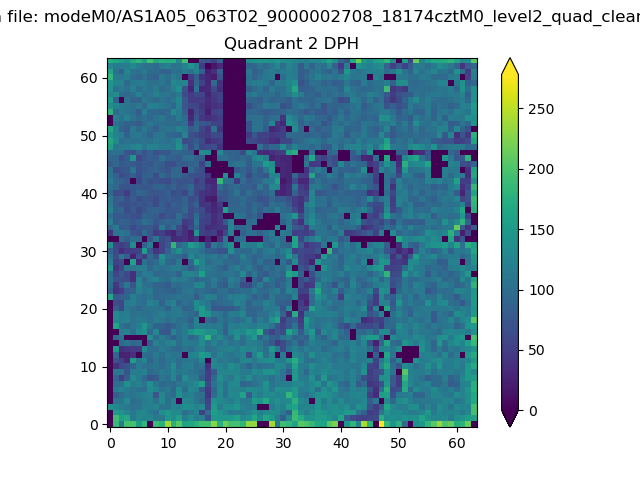 |
Quadrant C |
| Plot type | Count rate plots | Images |
|---|---|---|
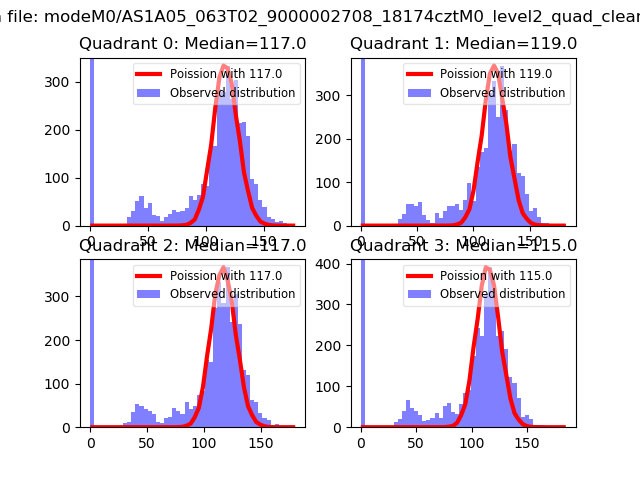
| Comparison with Poisson distribution Blue bars denote a histogram of data divided into 1 sec bins. Red curve is a Poisson curve with rate = median count rate of data. |
 |
 |
| Quadrant-wise count rates Data is divided into 100 sec bins |
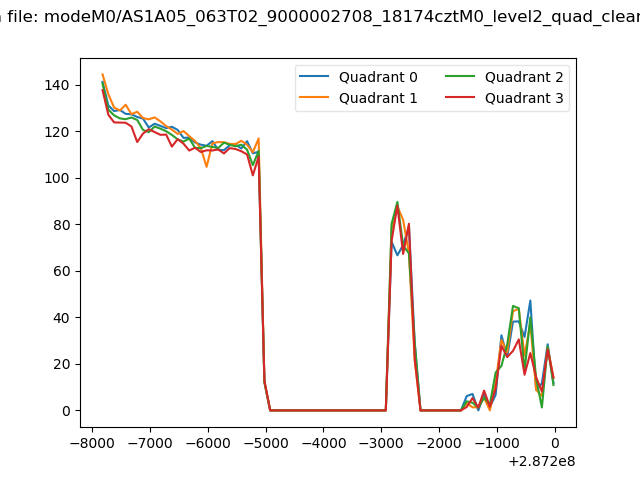 |
|
| Module-wise count rates for Quadrant A Data is divided into 100 sec bins |
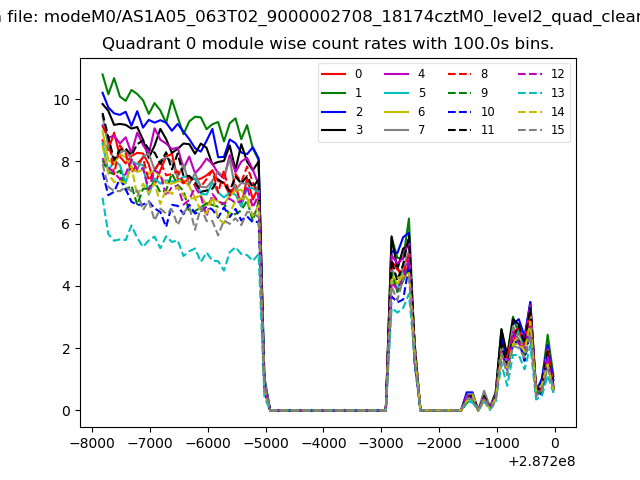 |
 |
| Module-wise count rates for Quadrant B Data is divided into 100 sec bins |
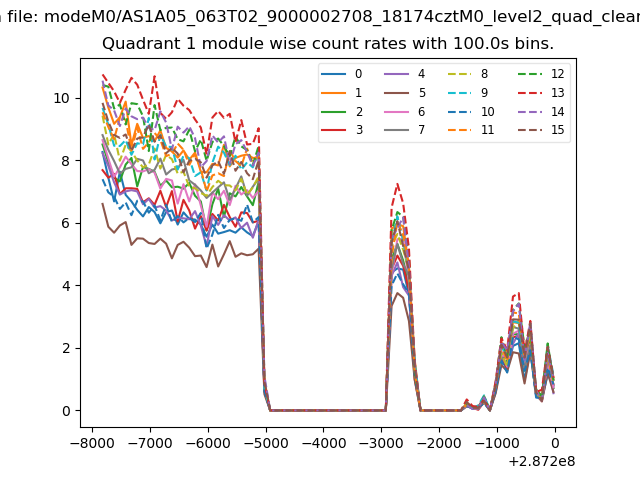 |
 |
| Module-wise count rates for Quadrant C Data is divided into 100 sec bins |
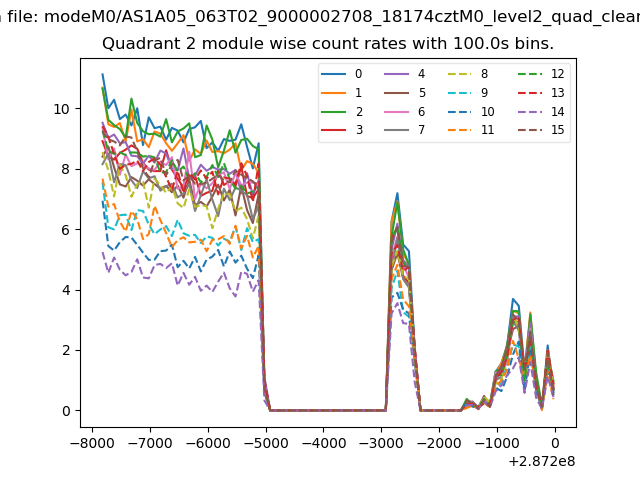 |
 |
| Module-wise count rates for Quadrant D Data is divided into 100 sec bins |
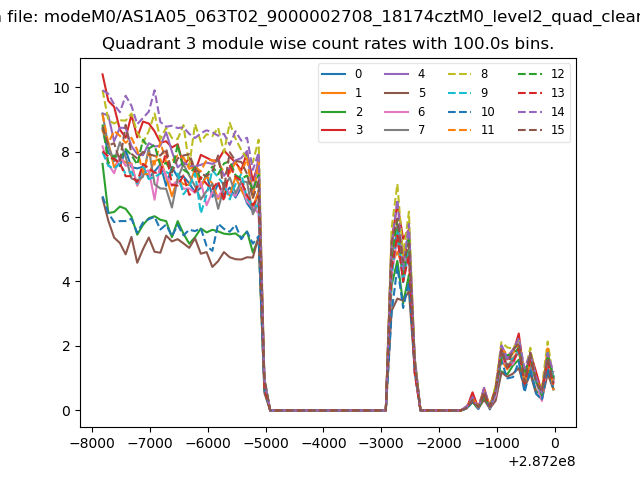 |
 |
| Parameter | Plot |
|---|---|
| CZT HV Monitor | 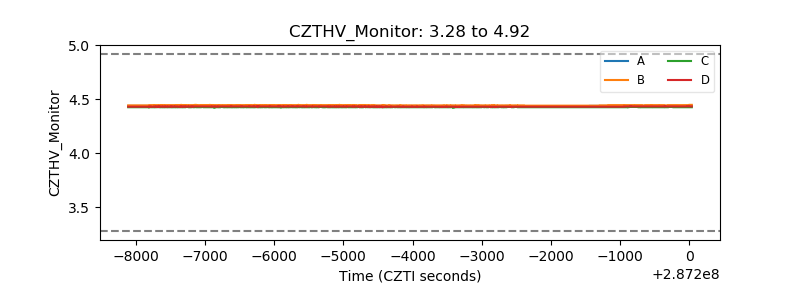 |
| D_VDD | 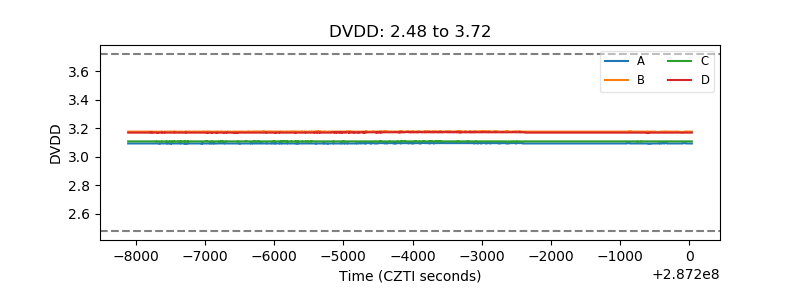 |
| Temperature 1 | 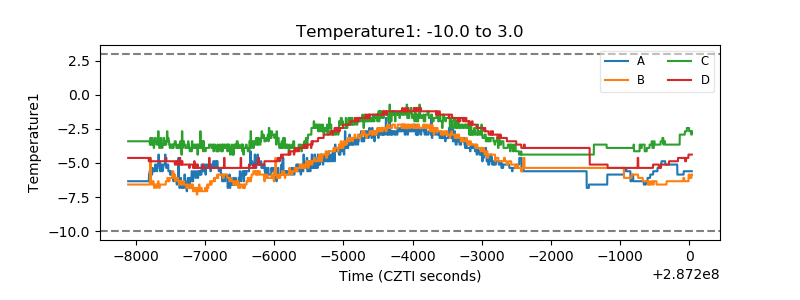 |
| Veto HV Monitor |  |
| Veto LLD | 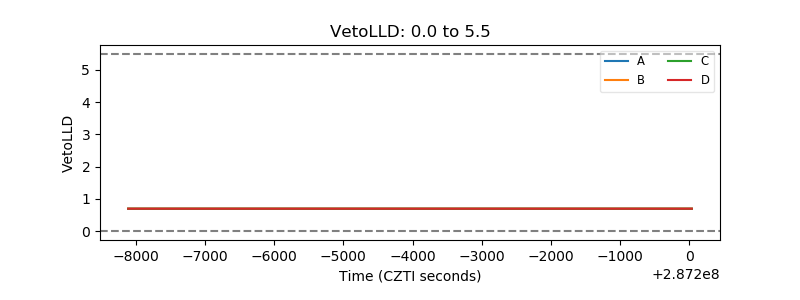 |
| Alpha Counter | 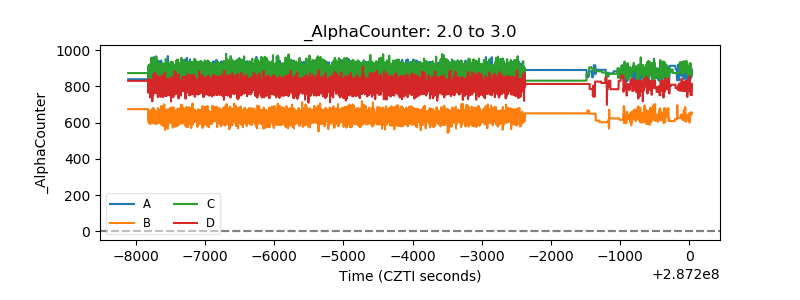 |
| _CPM_Rate | 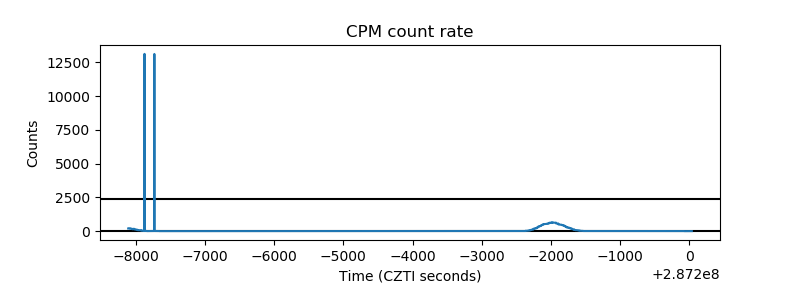 |
| CZT Counter | 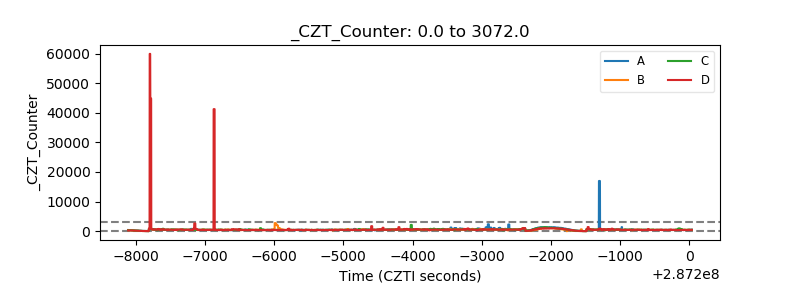 |
| +2.5 Volts monitor |  |
| +5 Volts monitor |  |
| _ROLL_ROT | 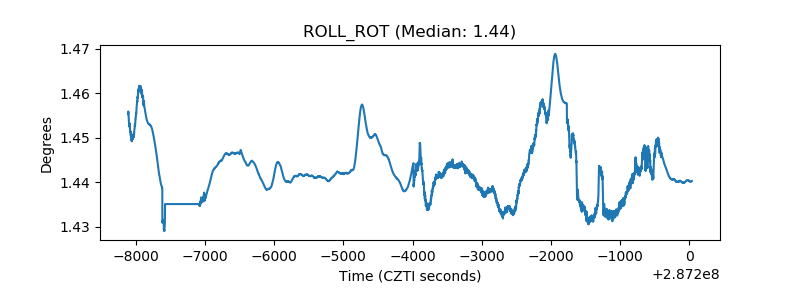 |
| _Roll_DEC |  |
| _Roll_RA |  |
| Veto Counter | 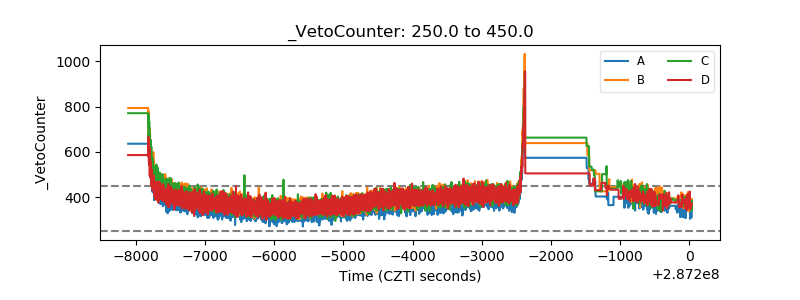 |