| Param | Original file | Final file |
|---|---|---|
| Filename | modeM0/AS1A05_063T02_9000002708_18175cztM0_level2.evt | modeM0/AS1A05_063T02_9000002708_18175cztM0_level2_quad_clean.evt |
| Size (bytes) | 1,673,426,880 | 286,240,320 |
| Size | 1.6 GB | 273.0 MB |
| Events in quadrant A | 11,218,108 | 1,787,030 |
| Events in quadrant B | 11,293,097 | 1,816,838 |
| Events in quadrant C | 11,276,518 | 1,761,226 |
| Events in quadrant D | 15,332,089 | 1,715,074 |
| Mode M9 | |||
|---|---|---|---|
| Quadrant | BADHDUFLAG | Total packets | Discarded packets |
| A | 0 | 31 | 0 |
| B | 0 | 31 | 0 |
| C | 0 | 31 | 0 |
| D | 0 | 31 | 0 |
| Mode M0 | |||
|---|---|---|---|
| Quadrant | BADHDUFLAG | Total packets | Discarded packets |
| A | 0 | 49038 | 4 |
| B | 0 | 48660 | 4 |
| C | 0 | 48547 | 4 |
| D | 0 | 61476 | 4 |
| Mode SS | |||
|---|---|---|---|
| Quadrant | BADHDUFLAG | Total packets | Discarded packets |
| A | 0 | 470 | 0 |
| B | 0 | 470 | 0 |
| C | 0 | 470 | 0 |
| D | 0 | 470 | 0 |
| Quadrant | Total seconds | Saturated seconds | Saturation percentage |
|---|---|---|---|
| A | 23097 | 228 | 0.987141% |
| B | 23097 | 361 | 1.562974% |
| C | 23097 | 319 | 1.381132% |
| D | 23098 | 931 | 4.030652% |
Noise dominated data is calculated using 1-second bins in cleaned event files. If a bin has >2000 counts, and if more than 50% of those come from <1% of pixels, then it is considered to be noise-dominated and hence unusable.
| Quadrant | # 1 sec bins | Bins with >0 counts | Bins with >2000 counts | High rate bins dominated by noise | Noise dominated (total time) | Noise dominated (detector-on time) | Marked lightcurve |
|---|---|---|---|---|---|---|---|
| A | 26193 | 23101 | 30 | 30 | 0.11% | 0.13% | 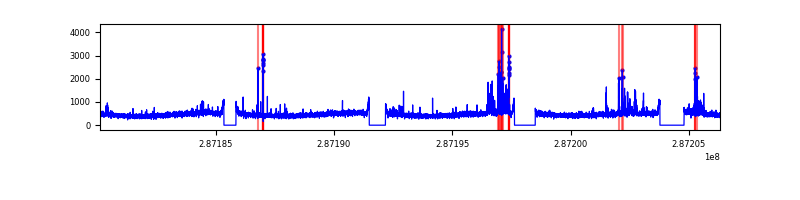 |
| B | 26193 | 23101 | 127 | 127 | 0.48% | 0.55% | 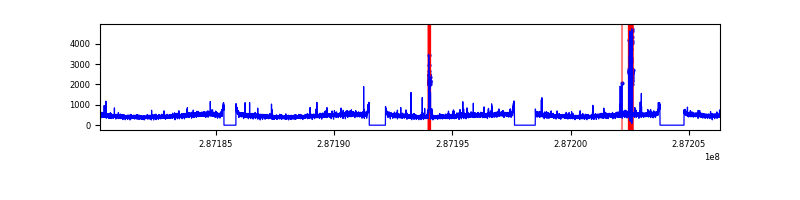 |
| C | 26193 | 23101 | 31 | 31 | 0.12% | 0.13% | 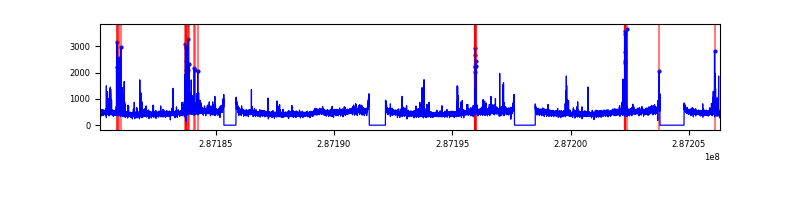 |
| D | 26194 | 23102 | 570 | 570 | 2.18% | 2.47% | 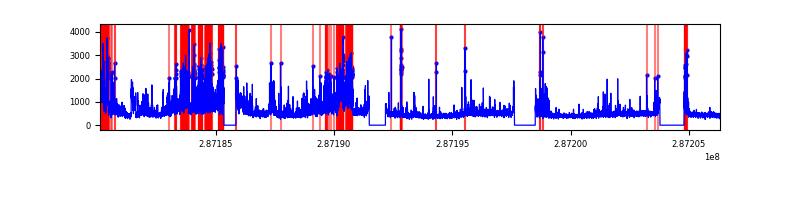 |
Top three noisy pixels from each quadrant. If the there are fewer than three noisy pixels in the level2.evt file, extra rows are filled as -1
| Pixel properties | Quadrant properties | ||||||
|---|---|---|---|---|---|---|---|
| Quadrant | DetID | PixID | Counts | Sigma | Mean | Median | Sigma |
| A | 15 | 174 | 556732 | 991.97 | 2760 | 2702 | 558.5 |
| A | 4 | 2 | 40931 | 68.45 | 2760 | 2702 | 558.5 |
| A | 0 | 226 | 24159 | 38.42 | 2760 | 2702 | 558.5 |
| B | 4 | 171 | 323452 | 612.22 | 2744 | 2673 | 524.0 |
| B | 10 | 247 | 148008 | 277.38 | 2744 | 2673 | 524.0 |
| B | 12 | 111 | 63826 | 116.71 | 2744 | 2673 | 524.0 |
| C | 4 | 254 | 514517 | 828.34 | 2639 | 2653 | 617.9 |
| C | 14 | 238 | 408341 | 656.52 | 2639 | 2653 | 617.9 |
| C | 3 | 233 | 43542 | 66.17 | 2639 | 2653 | 617.9 |
| D | 7 | 238 | 4427867 | 6806.46 | 2658 | 2580 | 650.2 |
| D | 1 | 52 | 244091 | 371.46 | 2658 | 2580 | 650.2 |
| D | 10 | 70 | 213593 | 324.55 | 2658 | 2580 | 650.2 |
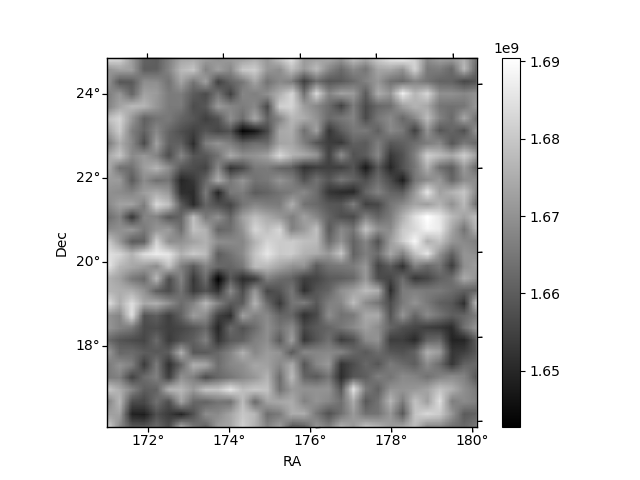
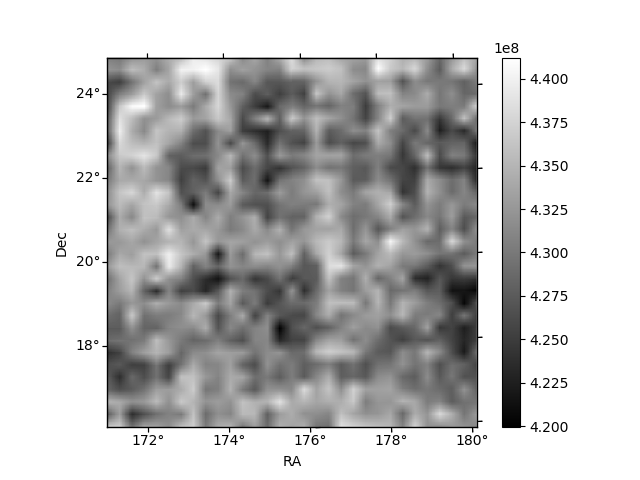
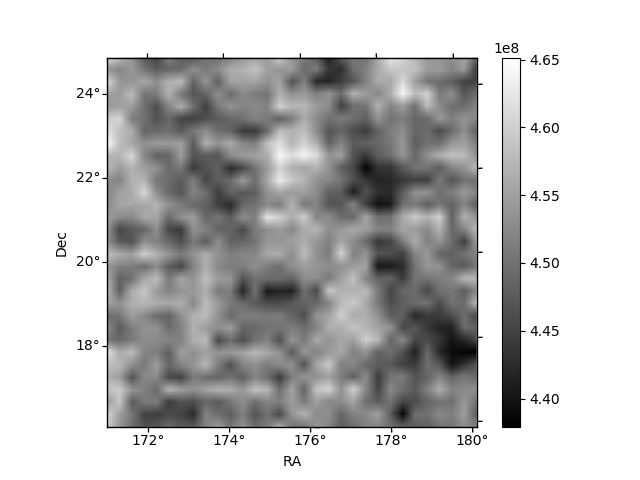
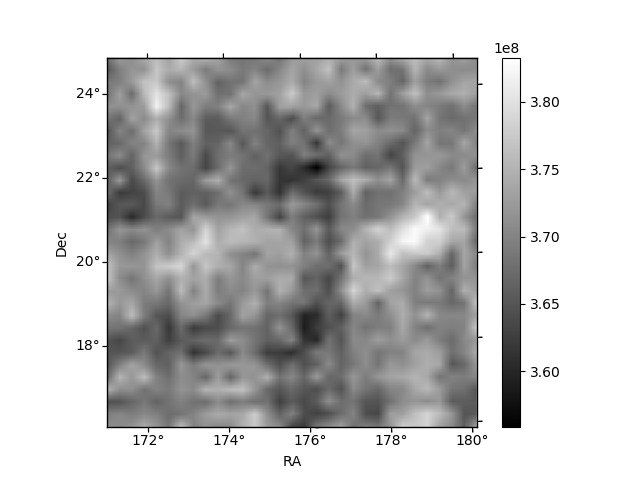
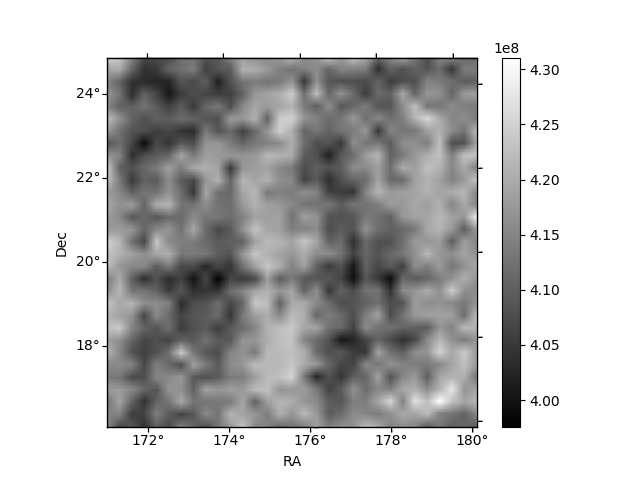
Histogram calculated using DETX and DETY for each event in the final _common_clean file
| Quadrant A | 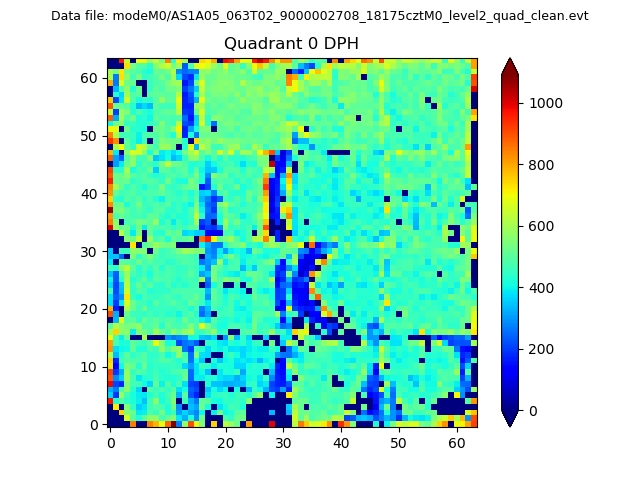 |
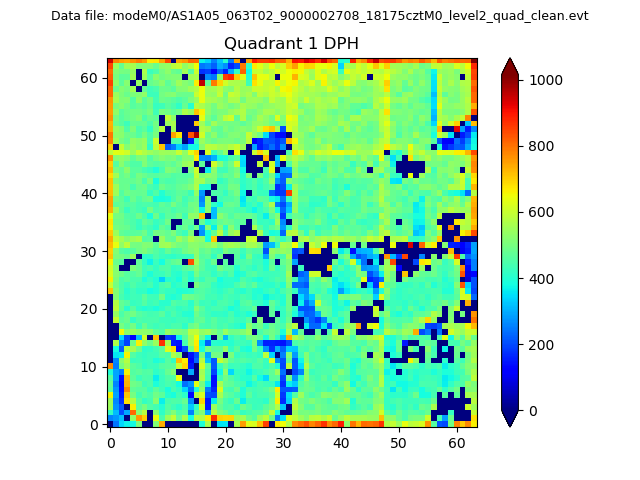 |
Quadrant B |
|---|---|---|---|
| Quadrant D | 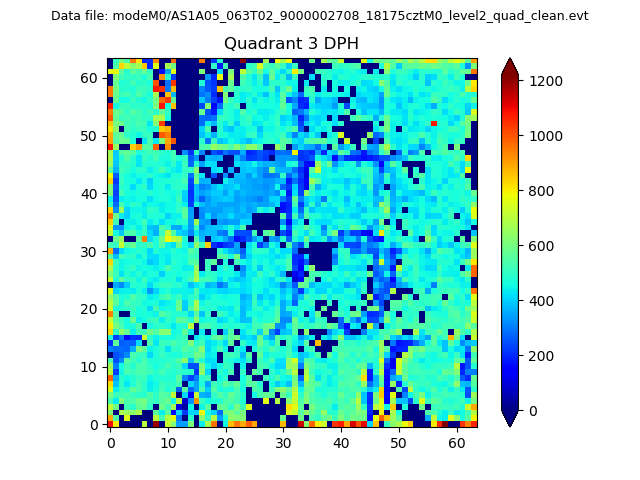 |
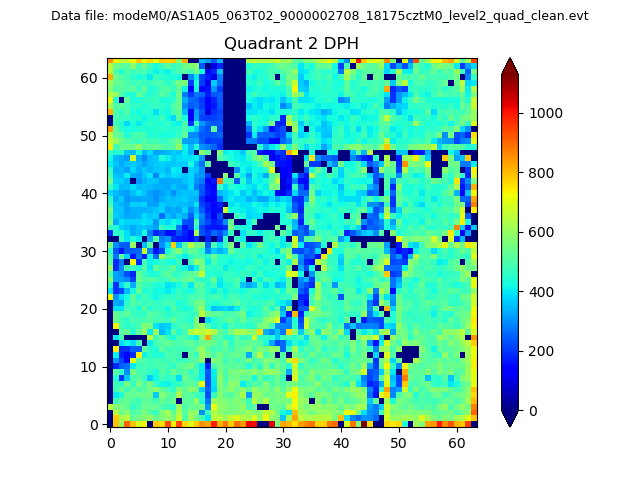 |
Quadrant C |
| Plot type | Count rate plots | Images |
|---|---|---|
| Comparison with Poisson distribution Blue bars denote a histogram of data divided into 1 sec bins. Red curve is a Poisson curve with rate = median count rate of data. |
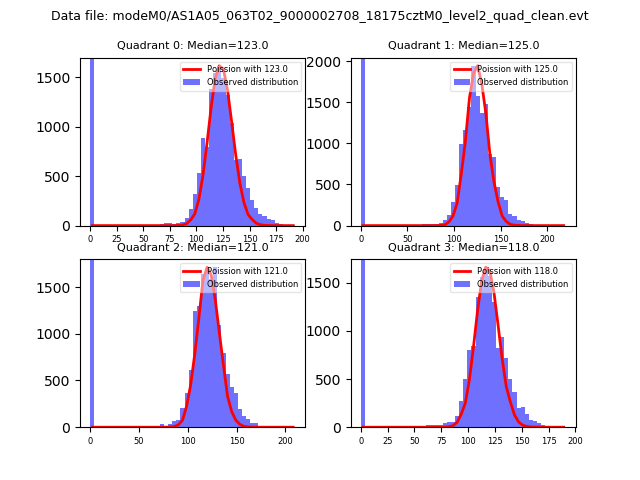 |
 |
| Quadrant-wise count rates Data is divided into 100 sec bins |
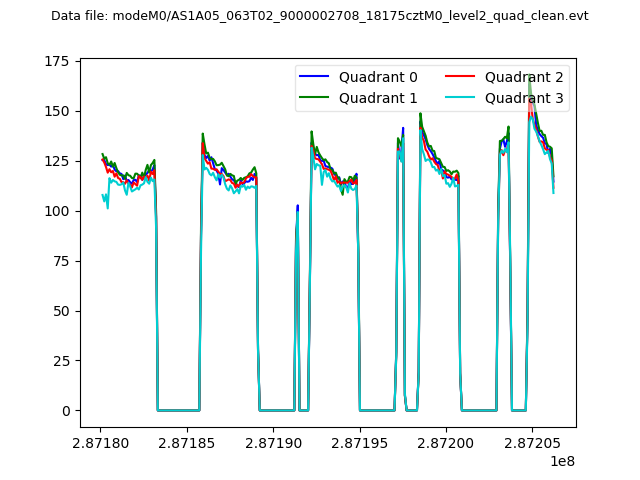 |
|
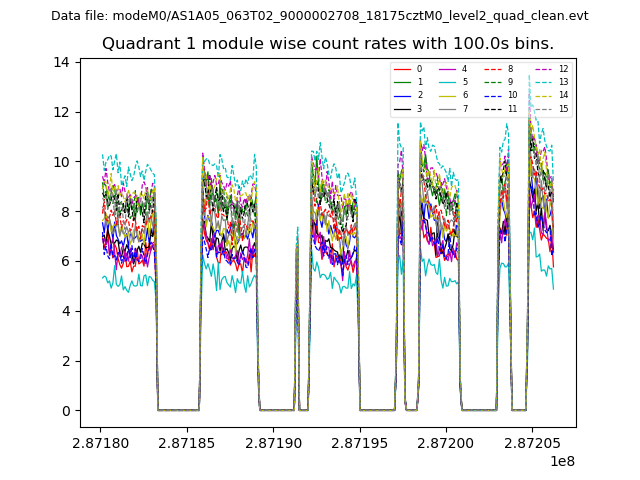
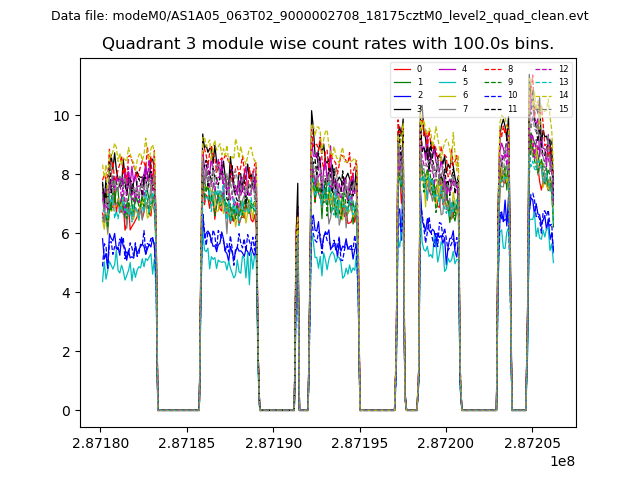
| Module-wise count rates for Quadrant A Data is divided into 100 sec bins |
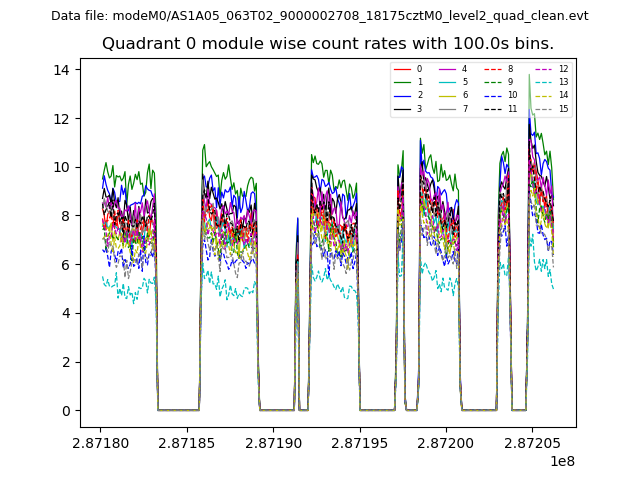 |
 |
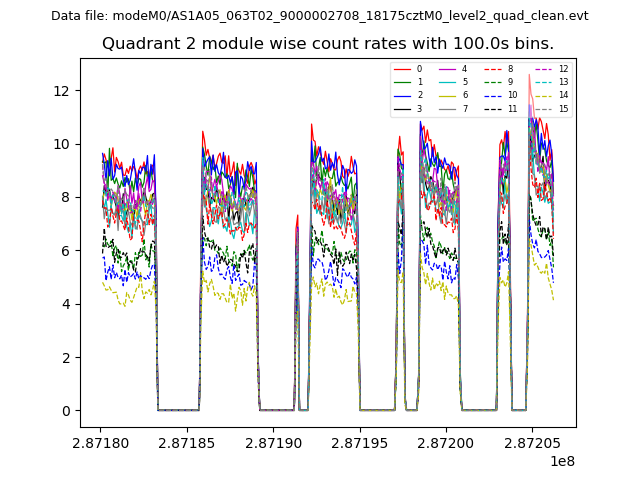
| Module-wise count rates for Quadrant B Data is divided into 100 sec bins |
 |
 |
| Module-wise count rates for Quadrant C Data is divided into 100 sec bins |
 |
 |
| Module-wise count rates for Quadrant D Data is divided into 100 sec bins |
 |
 |
| Parameter | Plot |
|---|---|
| CZT HV Monitor | 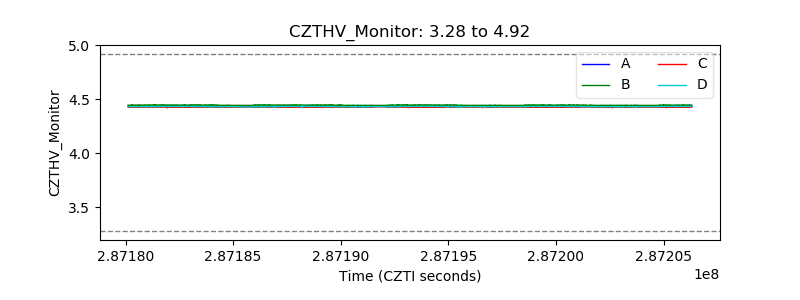 |
| D_VDD | 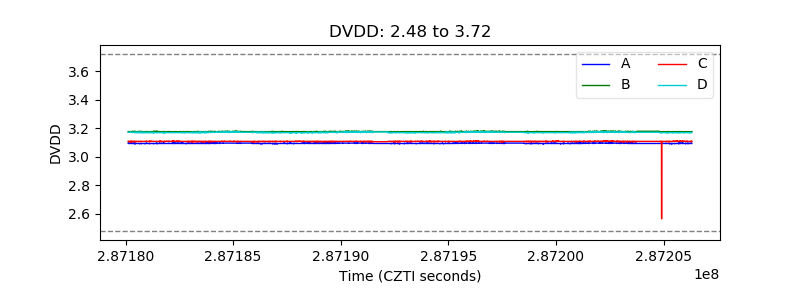 |
| Temperature 1 | 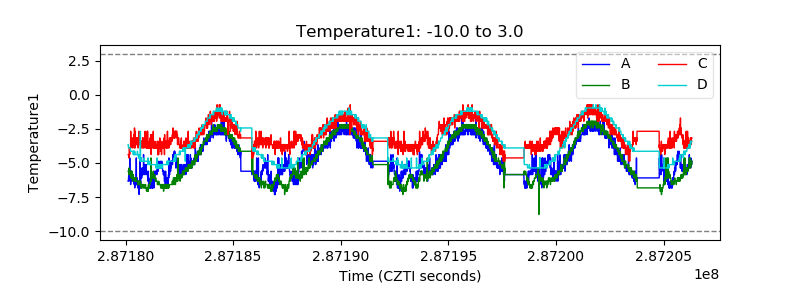 |
| Veto HV Monitor | 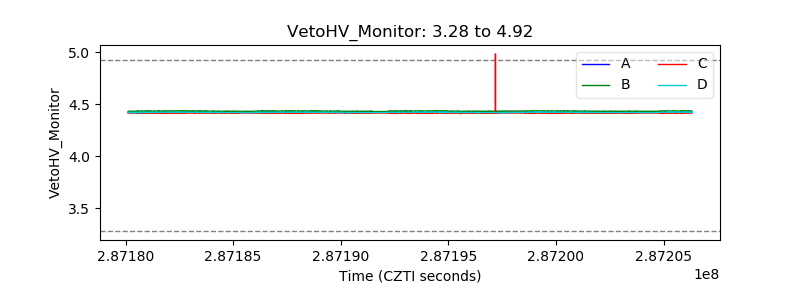 |
| Veto LLD | 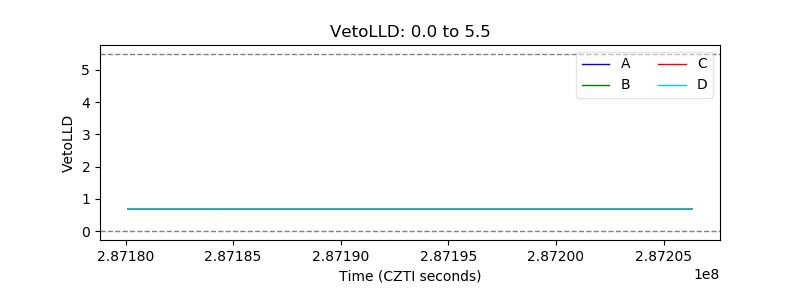 |
| Alpha Counter | 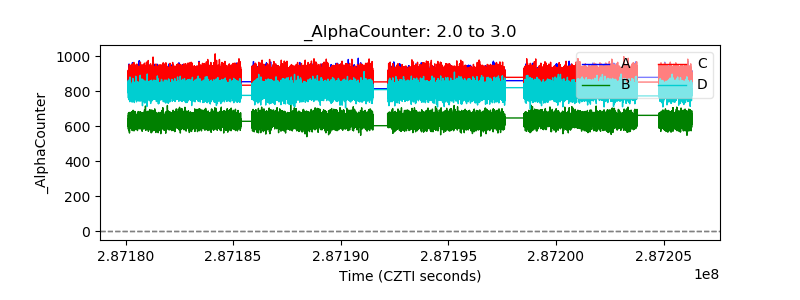 |
| _CPM_Rate | 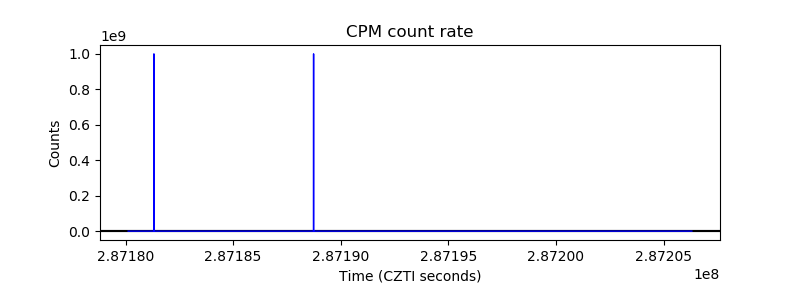 |
| CZT Counter |  |
| +2.5 Volts monitor |  |
| +5 Volts monitor | 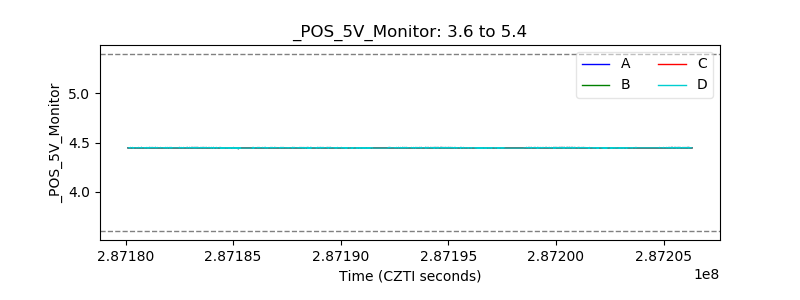 |
| _ROLL_ROT |  |
| _Roll_DEC | 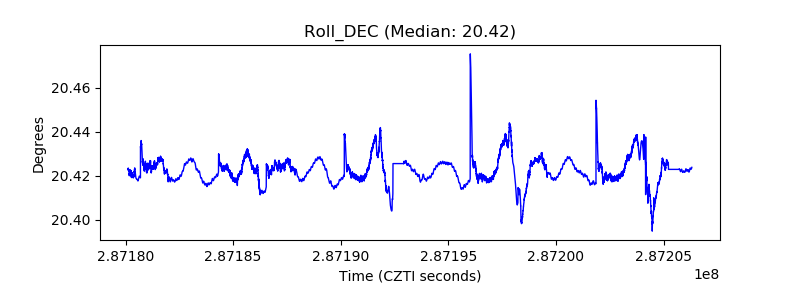 |
| _Roll_RA | 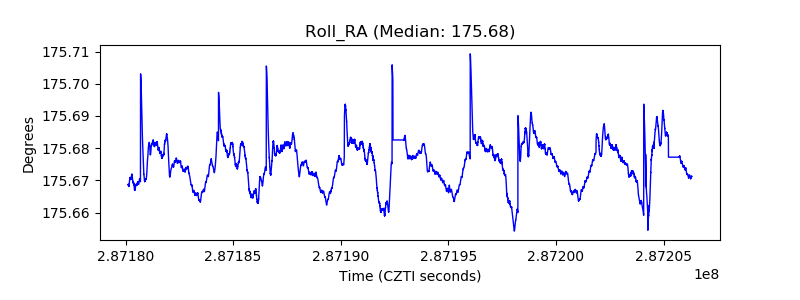 |
| Veto Counter | 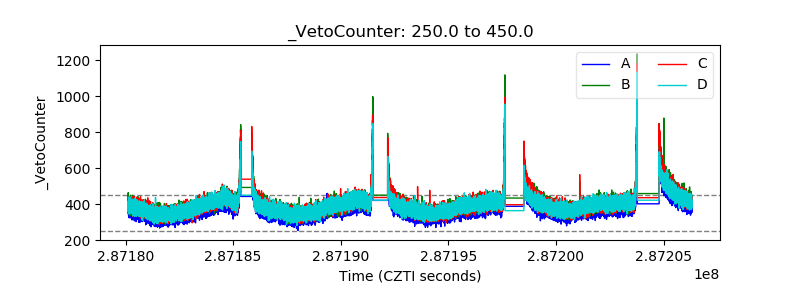 |