| Param | Original file | Final file |
|---|---|---|
| Filename | modeM0/AS1A05_063T02_9000002708_18177cztM0_level2.evt | modeM0/AS1A05_063T02_9000002708_18177cztM0_level2_quad_clean.evt |
| Size (bytes) | 422,568,000 | 86,126,400 |
| Size | 403.0 MB | 82.1 MB |
| Events in quadrant A | 3,122,856 | 553,565 |
| Events in quadrant B | 3,070,347 | 559,293 |
| Events in quadrant C | 3,228,237 | 537,453 |
| Events in quadrant D | 2,960,369 | 531,027 |
| Mode M9 | |||
|---|---|---|---|
| Quadrant | BADHDUFLAG | Total packets | Discarded packets |
| A | 0 | 11 | 0 |
| B | 0 | 11 | 0 |
| C | 0 | 11 | 0 |
| D | 0 | 11 | 0 |
| Mode M0 | |||
|---|---|---|---|
| Quadrant | BADHDUFLAG | Total packets | Discarded packets |
| A | 0 | 12993 | 1 |
| B | 0 | 12712 | 1 |
| C | 0 | 13318 | 1 |
| D | 0 | 12731 | 1 |
| Mode SS | |||
|---|---|---|---|
| Quadrant | BADHDUFLAG | Total packets | Discarded packets |
| A | 0 | 126 | 0 |
| B | 0 | 126 | 0 |
| C | 0 | 126 | 0 |
| D | 0 | 126 | 0 |
| Quadrant | Total seconds | Saturated seconds | Saturation percentage |
|---|---|---|---|
| A | 6108 | 48 | 0.785855% |
| B | 6108 | 48 | 0.785855% |
| C | 6107 | 89 | 1.457344% |
| D | 6107 | 42 | 0.687735% |
Noise dominated data is calculated using 1-second bins in cleaned event files. If a bin has >2000 counts, and if more than 50% of those come from <1% of pixels, then it is considered to be noise-dominated and hence unusable.
| Quadrant | # 1 sec bins | Bins with >0 counts | Bins with >2000 counts | High rate bins dominated by noise | Noise dominated (total time) | Noise dominated (detector-on time) | Marked lightcurve |
|---|---|---|---|---|---|---|---|
| A | 7278 | 6109 | 1 | 1 | 0.01% | 0.02% | 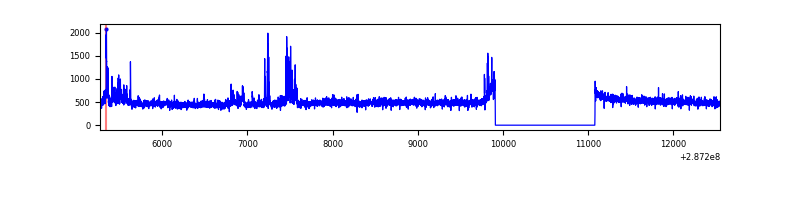 |
| B | 7278 | 6109 | 0 | 0 | 0.00% | 0.00% | 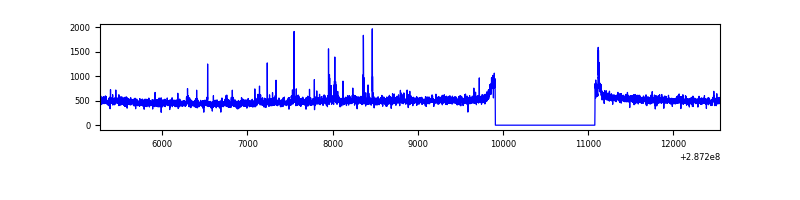 |
| C | 7277 | 6108 | 17 | 17 | 0.23% | 0.28% | 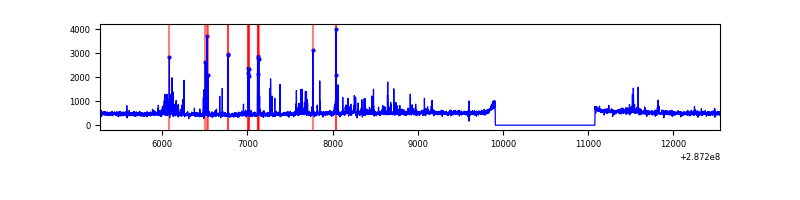 |
| D | 7277 | 6108 | 8 | 8 | 0.11% | 0.13% | 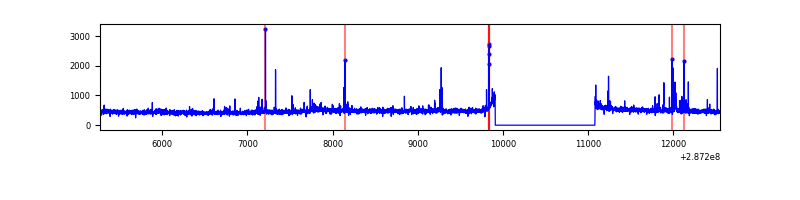 |
Top three noisy pixels from each quadrant. If the there are fewer than three noisy pixels in the level2.evt file, extra rows are filled as -1
| Pixel properties | Quadrant properties | ||||||
|---|---|---|---|---|---|---|---|
| Quadrant | DetID | PixID | Counts | Sigma | Mean | Median | Sigma |
| A | 15 | 174 | 165075 | 1071.18 | 768 | 752 | 153.4 |
| A | 0 | 226 | 6929 | 40.27 | 768 | 752 | 153.4 |
| A | 12 | 194 | 5715 | 32.35 | 768 | 752 | 153.4 |
| B | 0 | 189 | 29625 | 200.69 | 757 | 741 | 143.9 |
| B | 0 | 229 | 20578 | 137.83 | 757 | 741 | 143.9 |
| B | 4 | 171 | 18634 | 124.32 | 757 | 741 | 143.9 |
| C | 4 | 254 | 276174 | 1630.02 | 726 | 733 | 169.0 |
| C | 14 | 238 | 114064 | 670.68 | 726 | 733 | 169.0 |
| C | 13 | 61 | 5126 | 26.0 | 726 | 733 | 169.0 |
| D | 10 | 70 | 68347 | 371.55 | 746 | 724 | 182.0 |
| D | 7 | 238 | 38030 | 204.98 | 746 | 724 | 182.0 |
| D | 2 | 234 | 25753 | 137.52 | 746 | 724 | 182.0 |
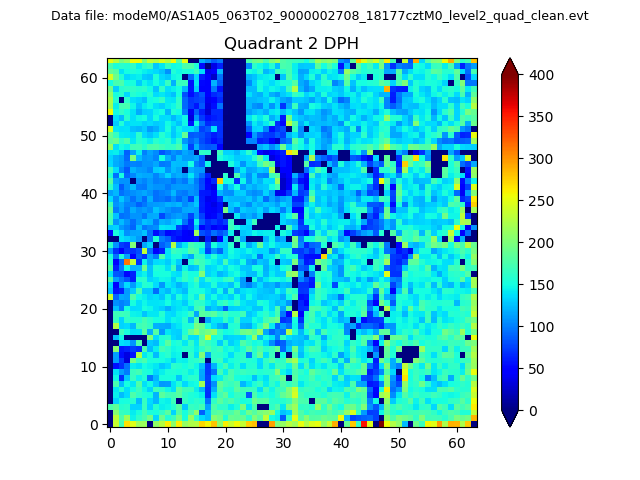
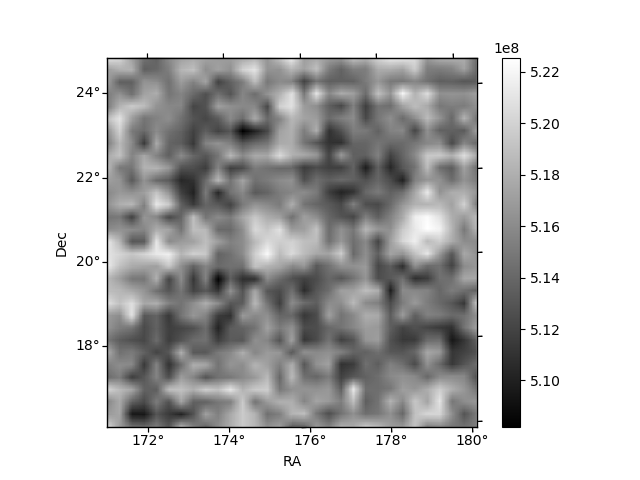
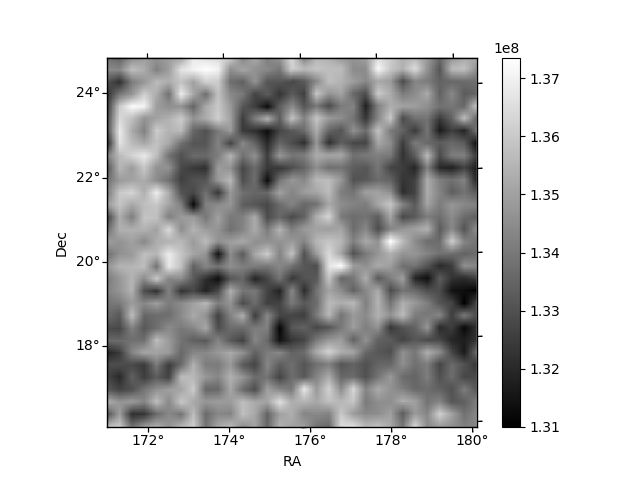
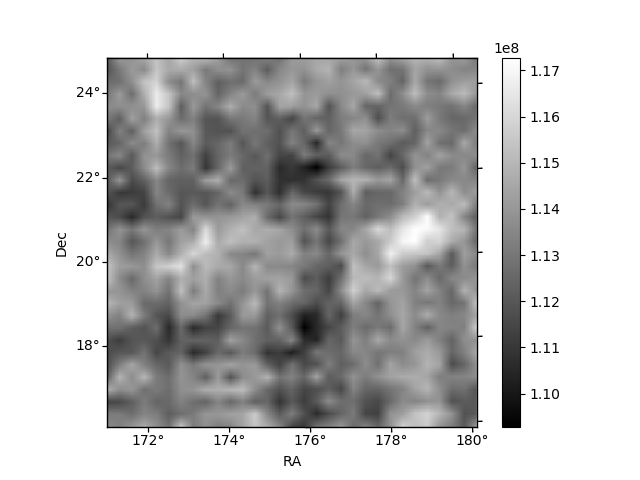
Histogram calculated using DETX and DETY for each event in the final _common_clean file
| Quadrant A | 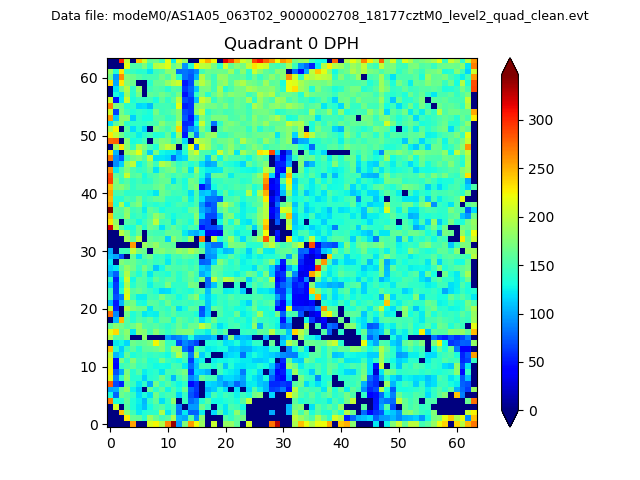 |
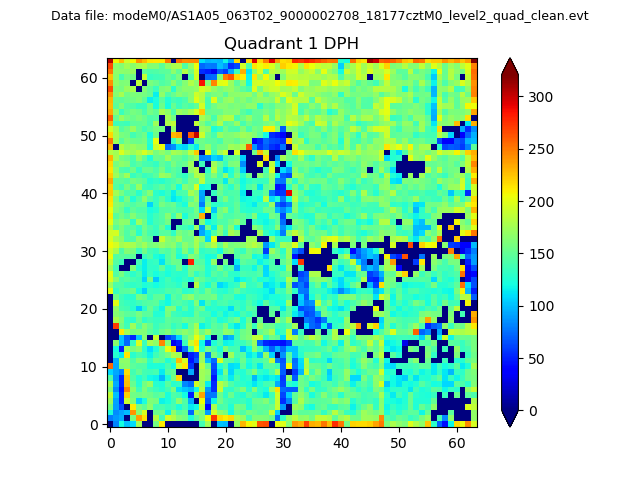 |
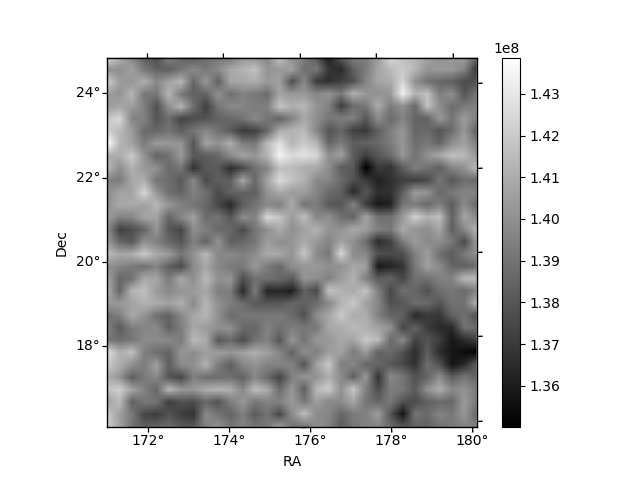
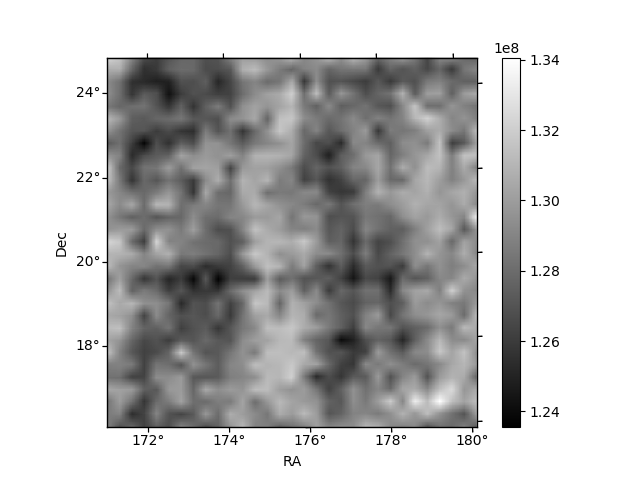
Quadrant B |
|---|---|---|---|
| Quadrant D | 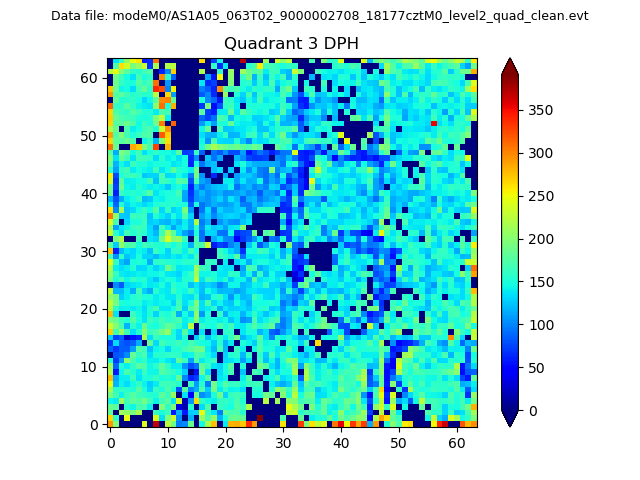 |
 |
Quadrant C |
| Plot type | Count rate plots | Images |
|---|---|---|
| Comparison with Poisson distribution Blue bars denote a histogram of data divided into 1 sec bins. Red curve is a Poisson curve with rate = median count rate of data. |
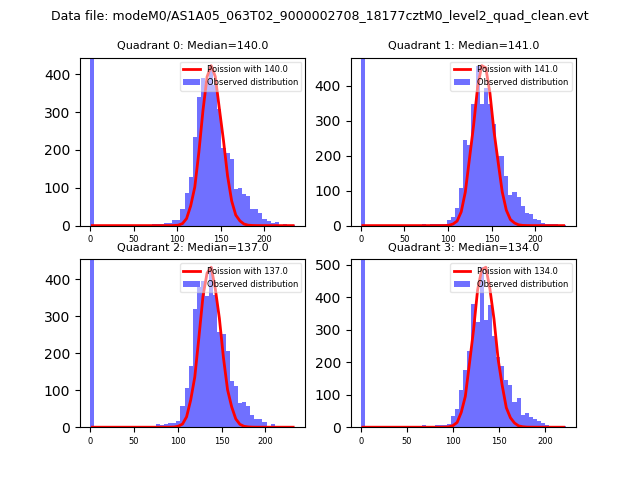 |
 |
| Quadrant-wise count rates Data is divided into 100 sec bins |
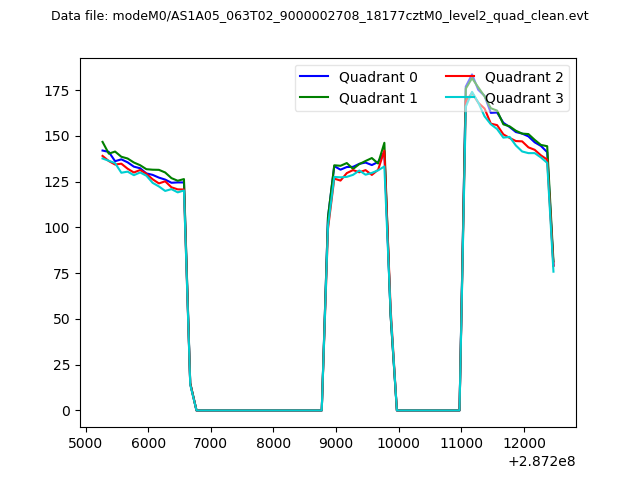 |
|
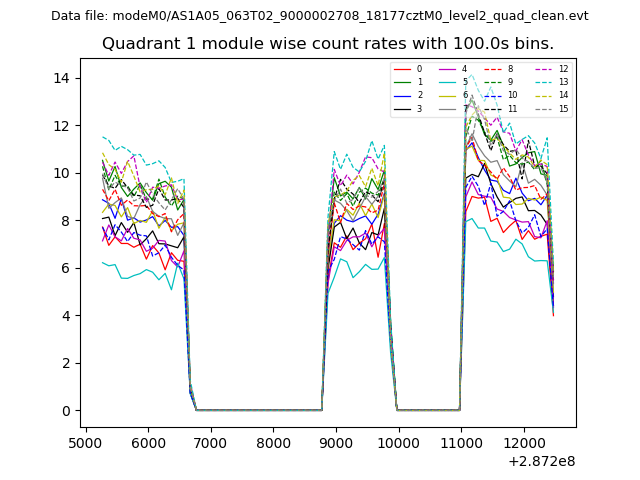
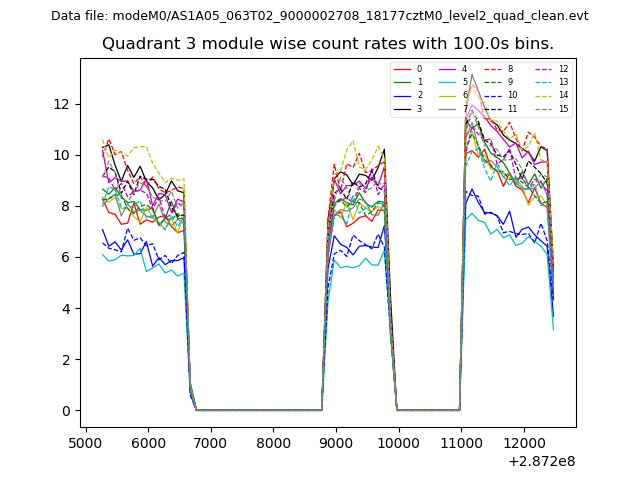
| Module-wise count rates for Quadrant A Data is divided into 100 sec bins |
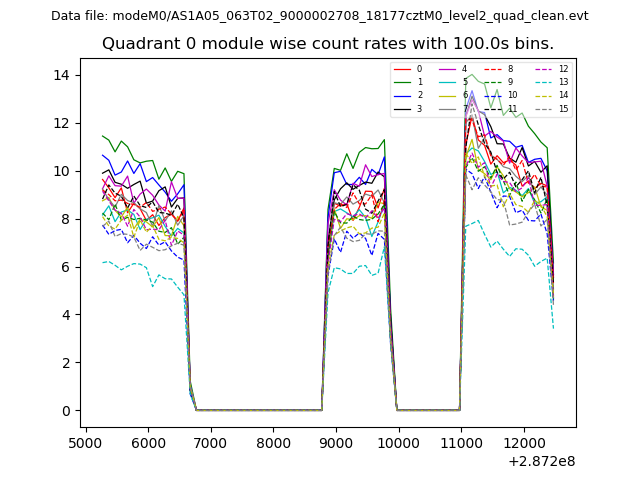 |
 |
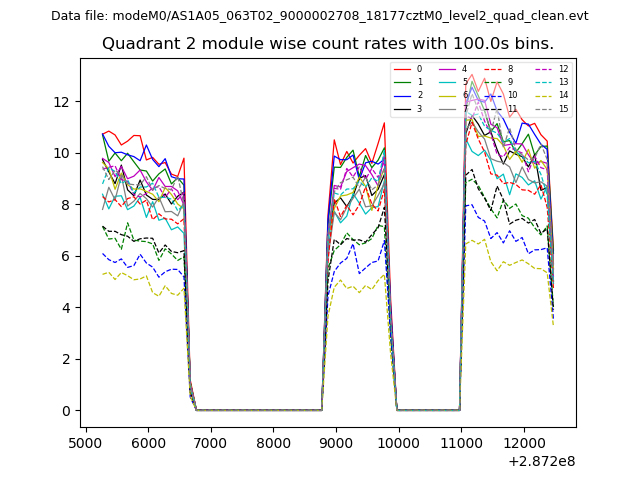
| Module-wise count rates for Quadrant B Data is divided into 100 sec bins |
 |
 |
| Module-wise count rates for Quadrant C Data is divided into 100 sec bins |
 |
 |
| Module-wise count rates for Quadrant D Data is divided into 100 sec bins |
 |
 |
| Parameter | Plot |
|---|---|
| CZT HV Monitor | 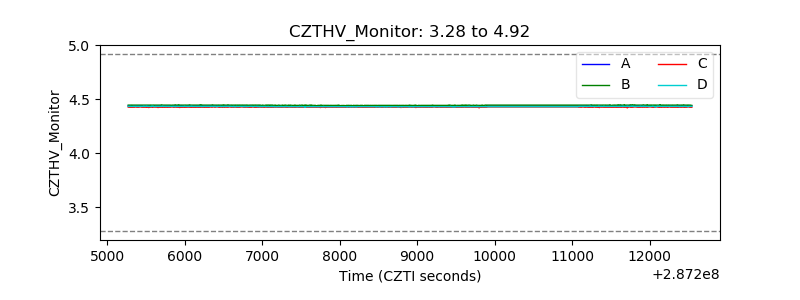 |
| D_VDD | 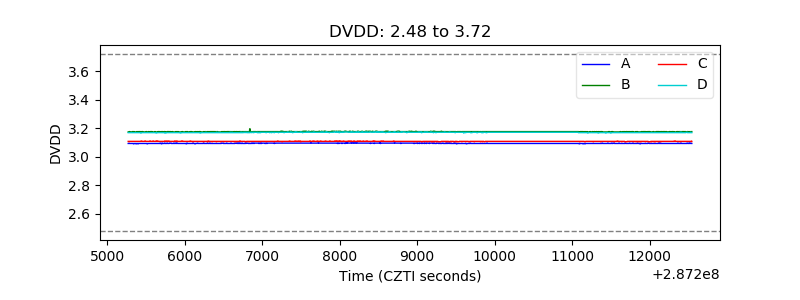 |
| Temperature 1 | 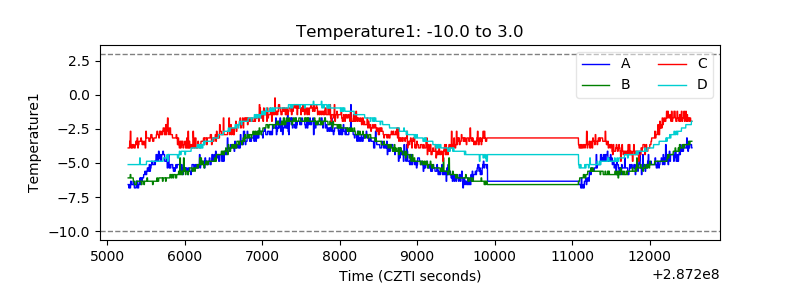 |
| Veto HV Monitor | 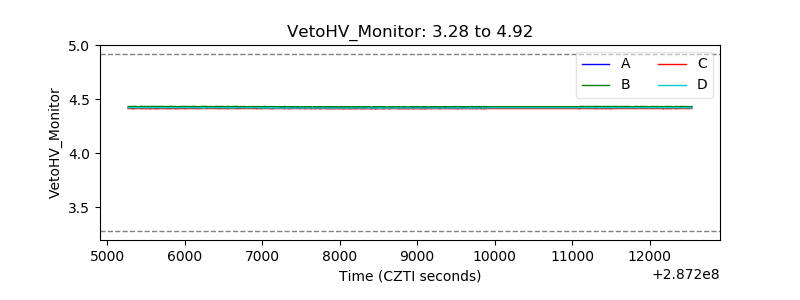 |
| Veto LLD | 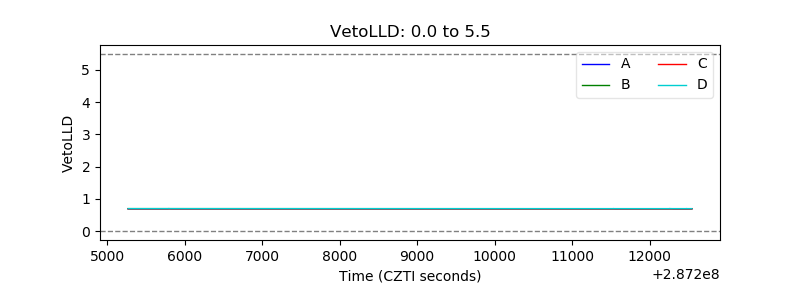 |
| Alpha Counter |  |
| _CPM_Rate |  |
| CZT Counter | 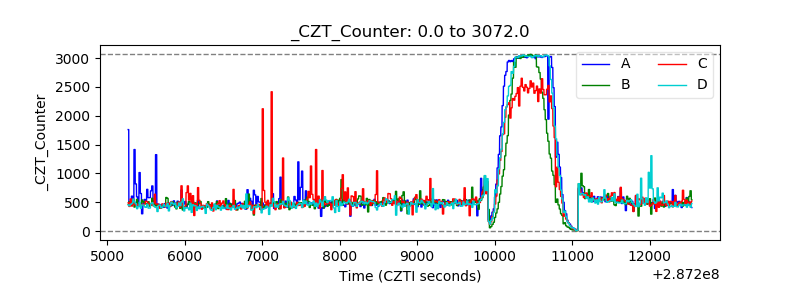 |
| +2.5 Volts monitor |  |
| +5 Volts monitor |  |
| _ROLL_ROT | 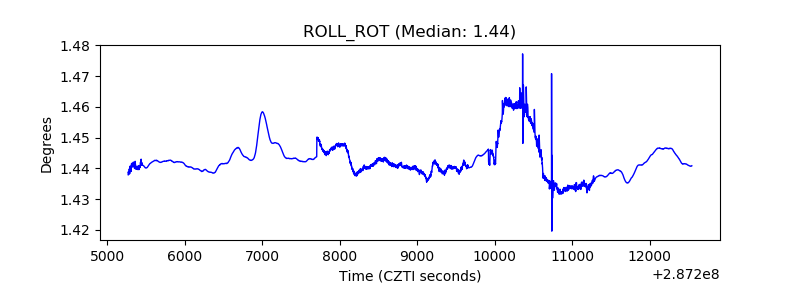 |
| _Roll_DEC | 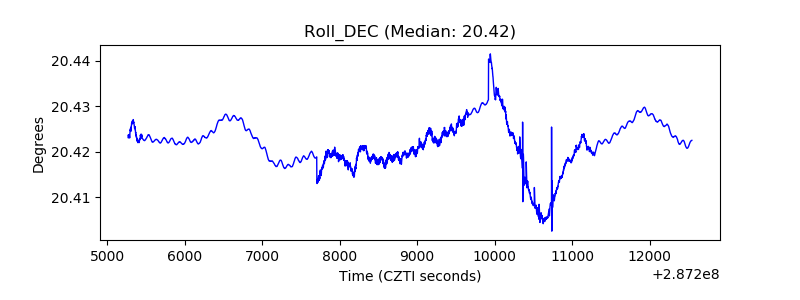 |
| _Roll_RA | 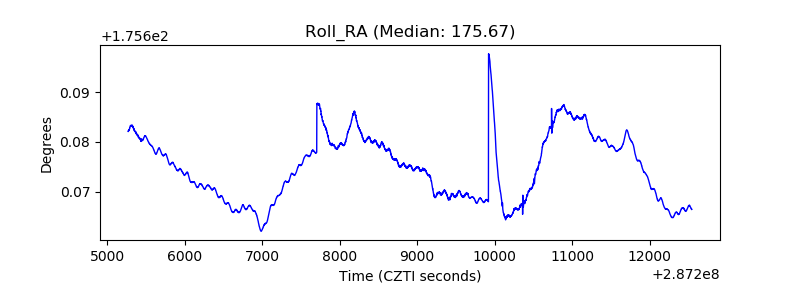 |
| Veto Counter | 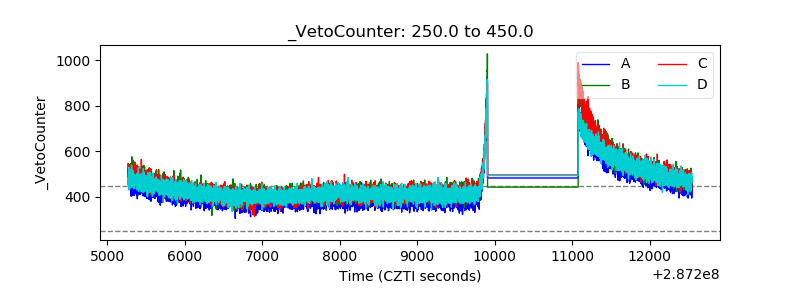 |