| Param | Original file | Final file |
|---|---|---|
| Filename | modeM0/AS1A05_063T02_9000002708_18178cztM0_level2.evt | modeM0/AS1A05_063T02_9000002708_18178cztM0_level2_quad_clean.evt |
| Size (bytes) | 439,341,120 | 77,647,680 |
| Size | 419.0 MB | 74.1 MB |
| Events in quadrant A | 2,876,519 | 502,546 |
| Events in quadrant B | 3,006,151 | 503,156 |
| Events in quadrant C | 2,914,290 | 483,617 |
| Events in quadrant D | 4,133,945 | 475,965 |
| Mode M9 | |||
|---|---|---|---|
| Quadrant | BADHDUFLAG | Total packets | Discarded packets |
| A | 0 | 13 | 0 |
| B | 0 | 13 | 0 |
| C | 0 | 13 | 0 |
| D | 0 | 13 | 0 |
| Mode M0 | |||
|---|---|---|---|
| Quadrant | BADHDUFLAG | Total packets | Discarded packets |
| A | 0 | 11816 | 1 |
| B | 0 | 12124 | 1 |
| C | 0 | 11859 | 1 |
| D | 0 | 15987 | 1 |
| Mode SS | |||
|---|---|---|---|
| Quadrant | BADHDUFLAG | Total packets | Discarded packets |
| A | 0 | 112 | 0 |
| B | 0 | 112 | 0 |
| C | 0 | 112 | 0 |
| D | 0 | 112 | 0 |
| Quadrant | Total seconds | Saturated seconds | Saturation percentage |
|---|---|---|---|
| A | 5518 | 40 | 0.724900% |
| B | 5518 | 75 | 1.359188% |
| C | 5517 | 53 | 0.960667% |
| D | 5517 | 167 | 3.027007% |
Noise dominated data is calculated using 1-second bins in cleaned event files. If a bin has >2000 counts, and if more than 50% of those come from <1% of pixels, then it is considered to be noise-dominated and hence unusable.
| Quadrant | # 1 sec bins | Bins with >0 counts | Bins with >2000 counts | High rate bins dominated by noise | Noise dominated (total time) | Noise dominated (detector-on time) | Marked lightcurve |
|---|---|---|---|---|---|---|---|
| A | 6783 | 5519 | 0 | 0 | 0.00% | 0.00% | 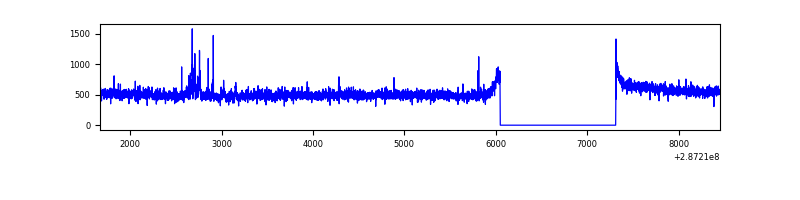 |
| B | 6783 | 5519 | 15 | 15 | 0.22% | 0.27% | 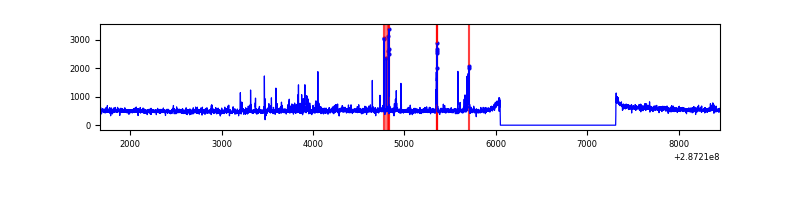 |
| C | 6782 | 5518 | 1 | 1 | 0.01% | 0.02% | 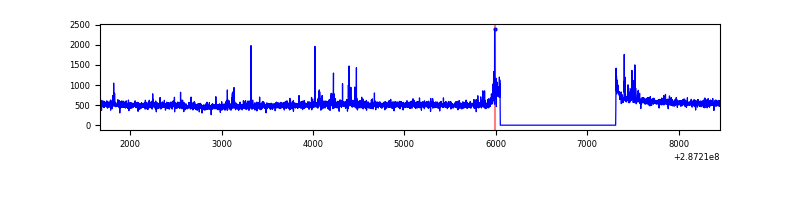 |
| D | 6782 | 5518 | 138 | 138 | 2.03% | 2.50% | 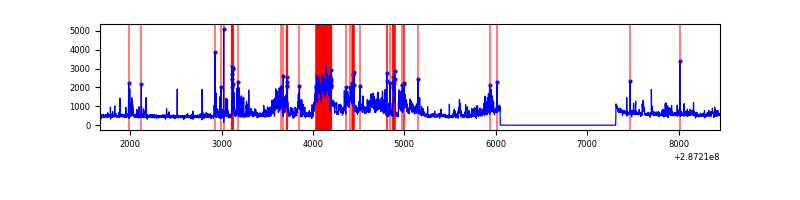 |
Top three noisy pixels from each quadrant. If the there are fewer than three noisy pixels in the level2.evt file, extra rows are filled as -1
| Pixel properties | Quadrant properties | ||||||
|---|---|---|---|---|---|---|---|
| Quadrant | DetID | PixID | Counts | Sigma | Mean | Median | Sigma |
| A | 15 | 174 | 46144 | 311.68 | 735 | 723 | 145.7 |
| A | 0 | 226 | 6609 | 40.39 | 735 | 723 | 145.7 |
| A | 4 | 2 | 6347 | 38.59 | 735 | 723 | 145.7 |
| B | 7 | 220 | 71903 | 523.32 | 720 | 705 | 136.1 |
| B | 10 | 247 | 51353 | 372.27 | 720 | 705 | 136.1 |
| B | 0 | 189 | 23547 | 167.89 | 720 | 705 | 136.1 |
| C | 14 | 238 | 109305 | 672.74 | 693 | 698 | 161.4 |
| C | 4 | 254 | 92591 | 569.21 | 693 | 698 | 161.4 |
| C | 3 | 233 | 12343 | 72.13 | 693 | 698 | 161.4 |
| D | 7 | 238 | 1298392 | 7510.66 | 708 | 689 | 172.8 |
| D | 10 | 70 | 50892 | 290.56 | 708 | 689 | 172.8 |
| D | 13 | 104 | 42821 | 243.85 | 708 | 689 | 172.8 |
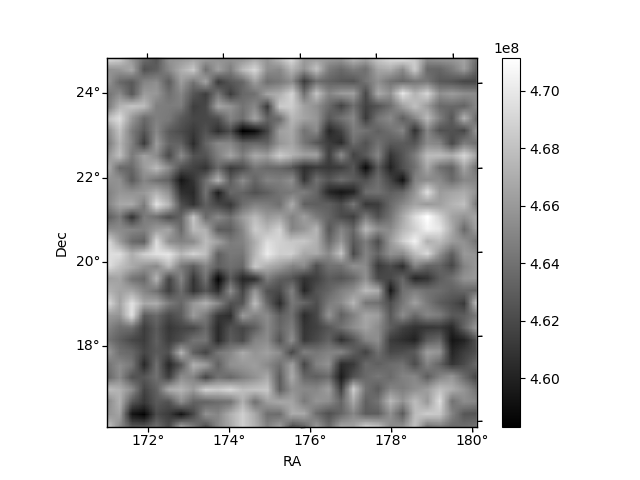
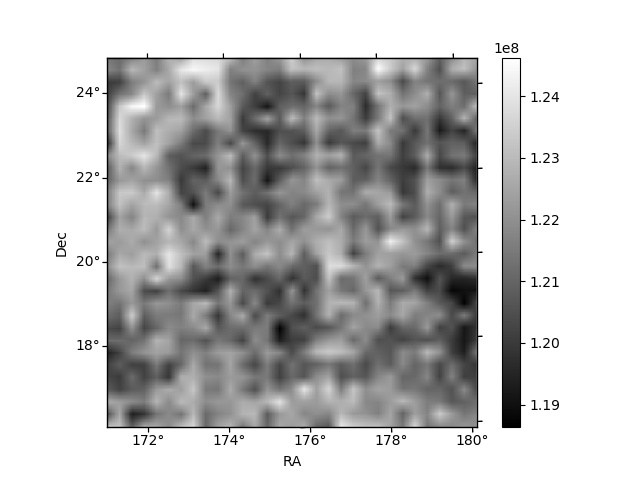
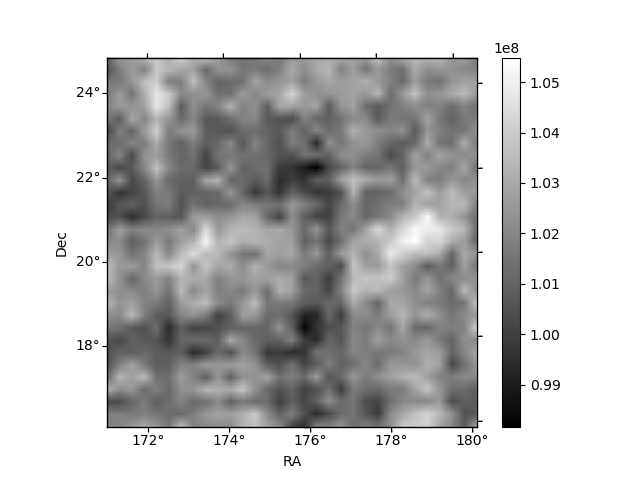
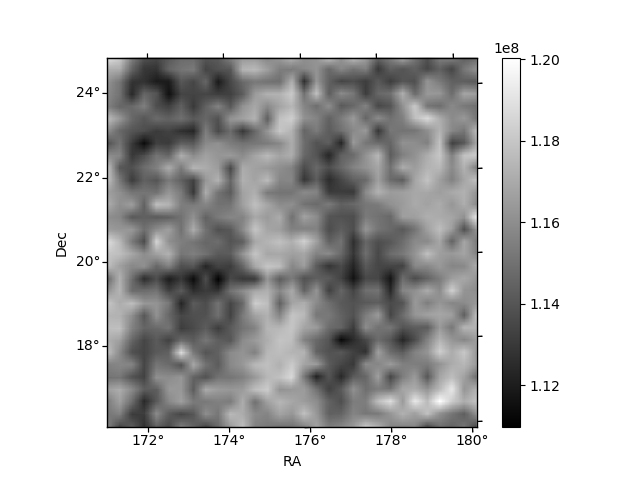
Histogram calculated using DETX and DETY for each event in the final _common_clean file
| Quadrant A | 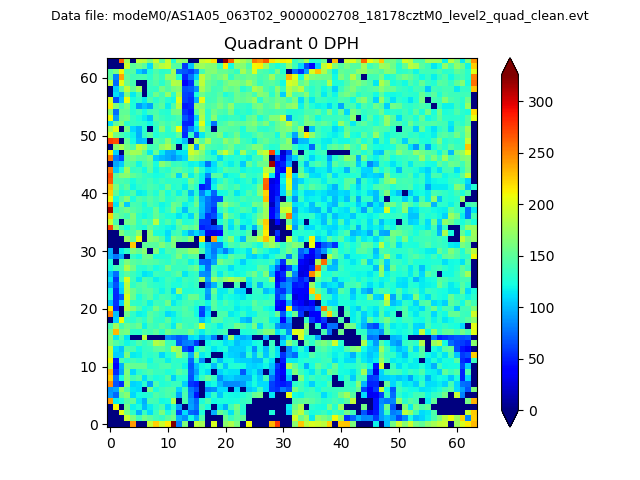 |
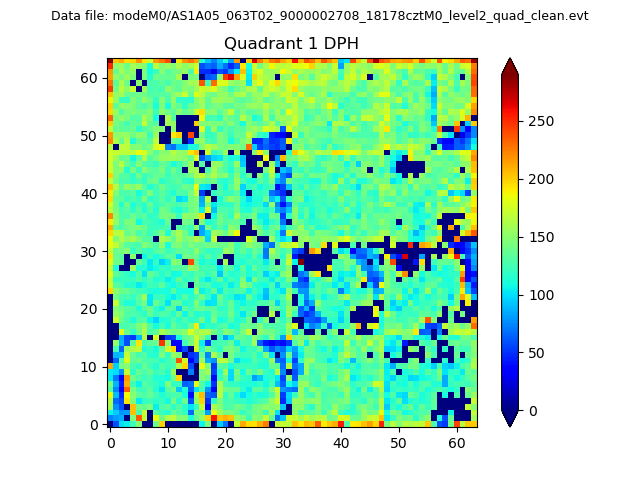 |
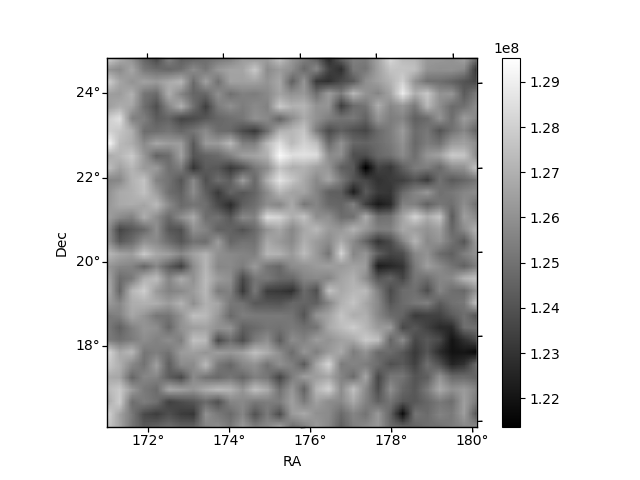
Quadrant B |
|---|---|---|---|
| Quadrant D | 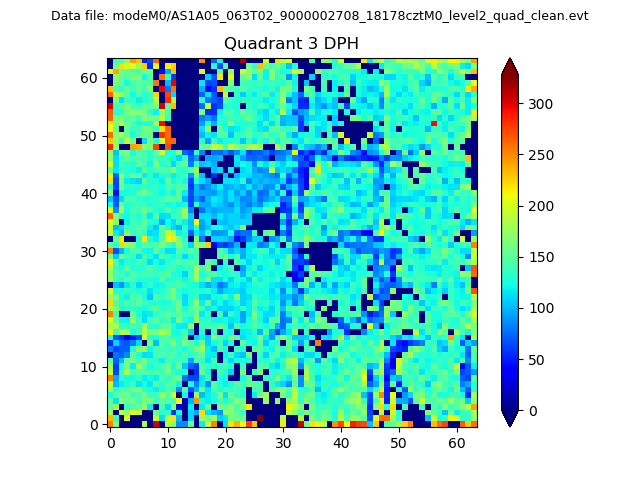 |
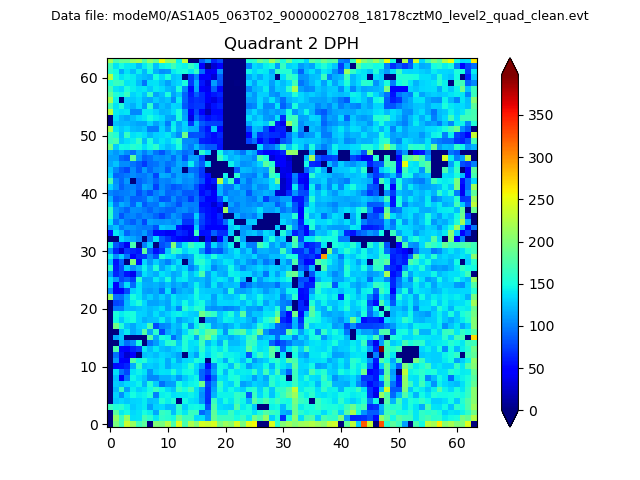 |
Quadrant C |
| Plot type | Count rate plots | Images |
|---|---|---|
| Comparison with Poisson distribution Blue bars denote a histogram of data divided into 1 sec bins. Red curve is a Poisson curve with rate = median count rate of data. |
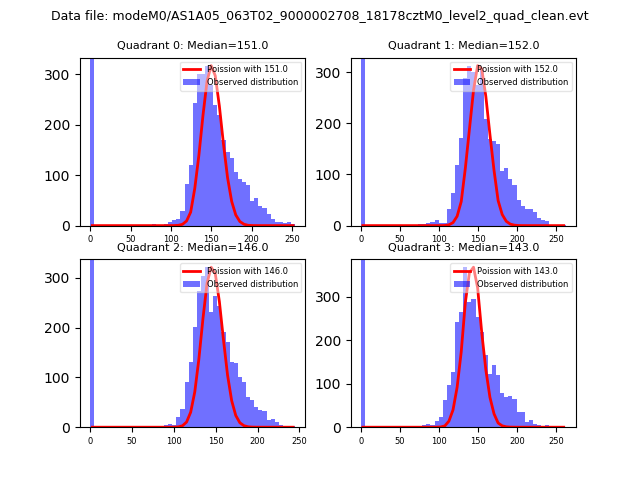 |
 |
| Quadrant-wise count rates Data is divided into 100 sec bins |
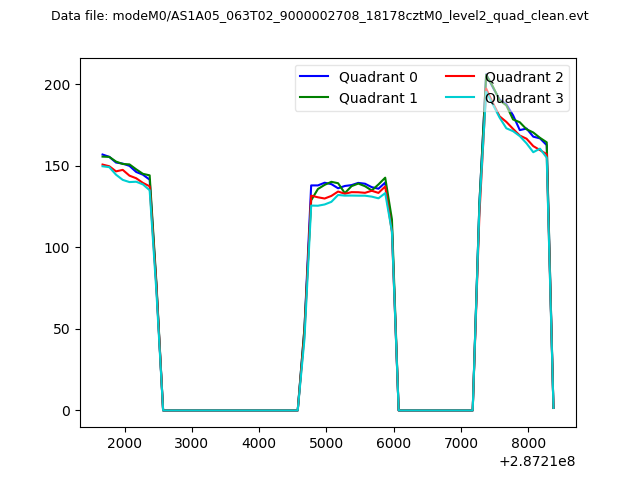 |
|
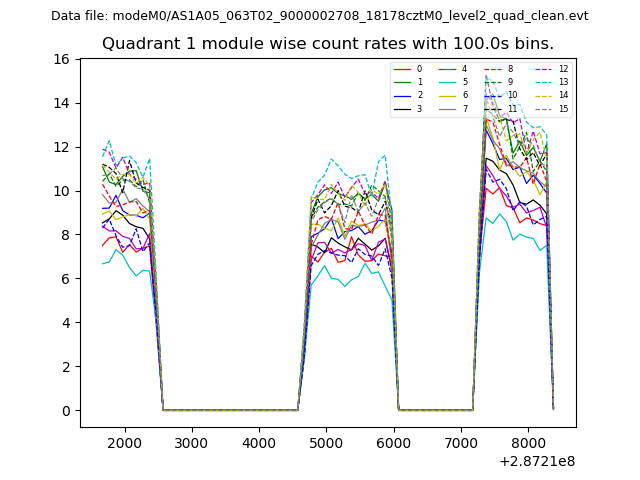
| Module-wise count rates for Quadrant A Data is divided into 100 sec bins |
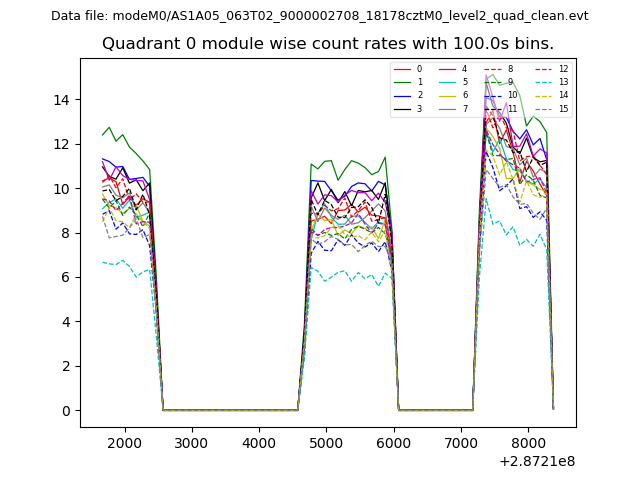 |
 |
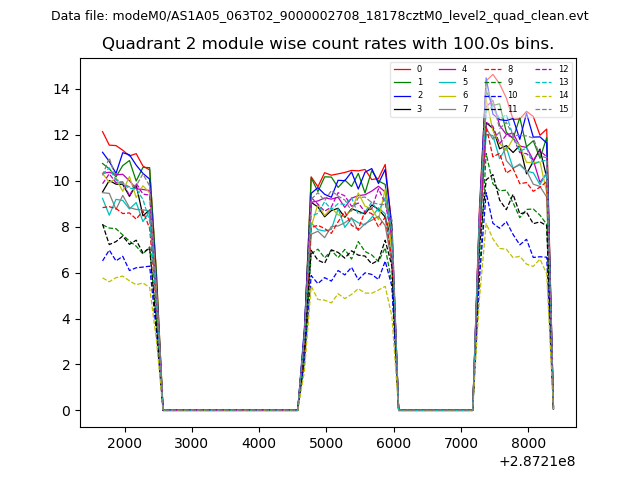
| Module-wise count rates for Quadrant B Data is divided into 100 sec bins |
 |
 |
| Module-wise count rates for Quadrant C Data is divided into 100 sec bins |
 |
 |
| Module-wise count rates for Quadrant D Data is divided into 100 sec bins |
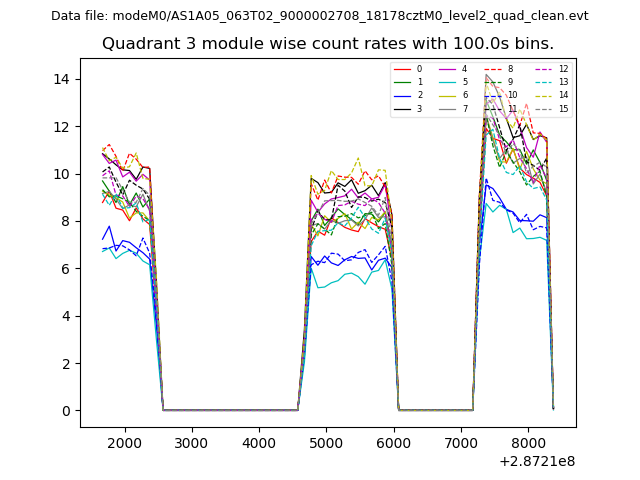 |
 |
| Parameter | Plot |
|---|---|
| CZT HV Monitor | 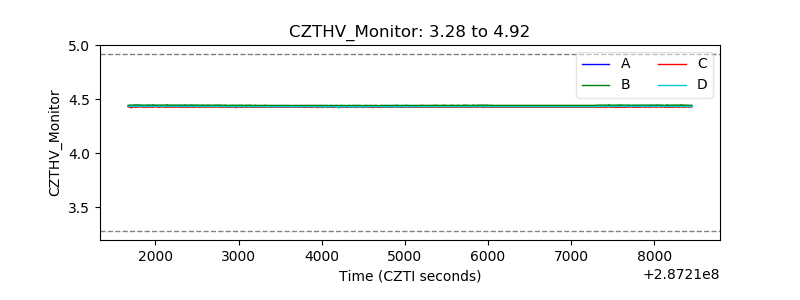 |
| D_VDD | 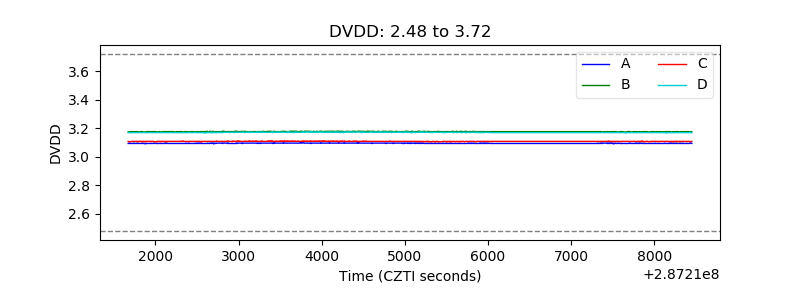 |
| Temperature 1 | 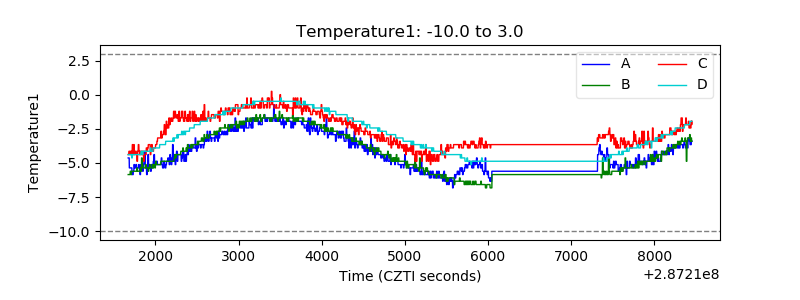 |
| Veto HV Monitor | 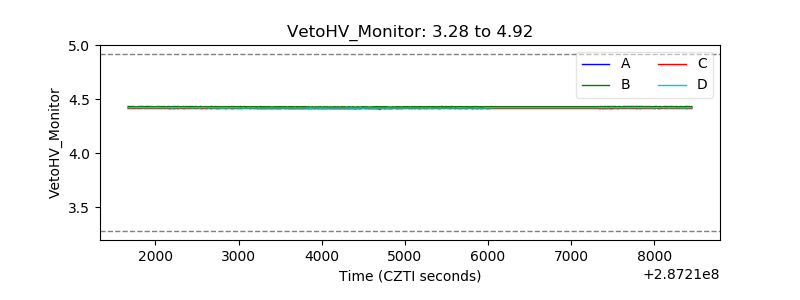 |
| Veto LLD | 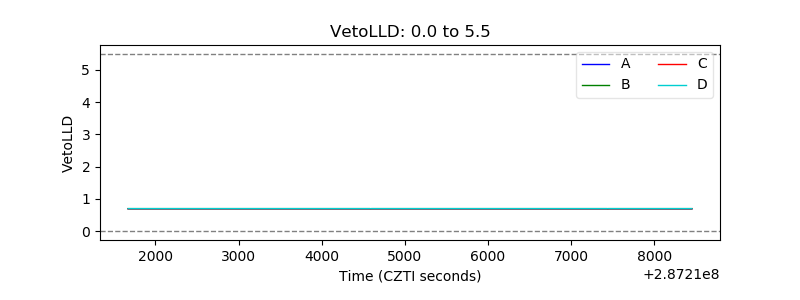 |
| Alpha Counter | 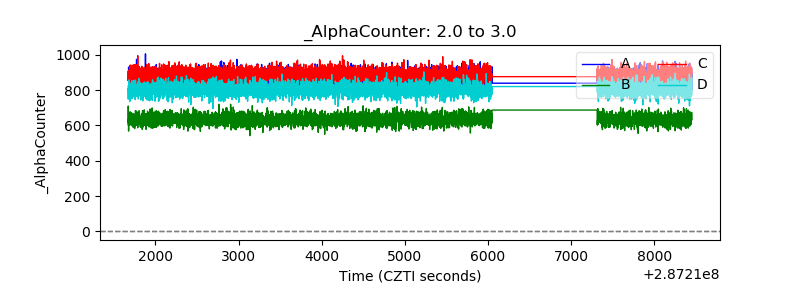 |
| _CPM_Rate |  |
| CZT Counter | 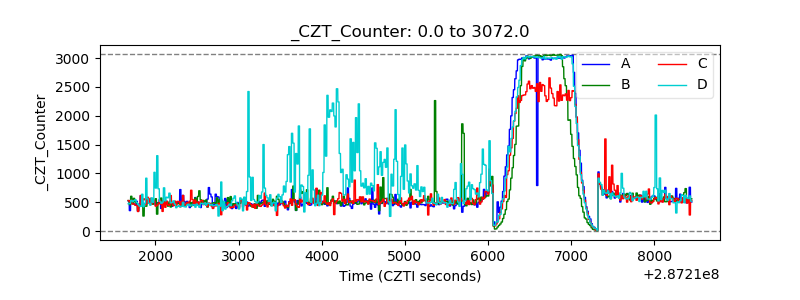 |
| +2.5 Volts monitor | 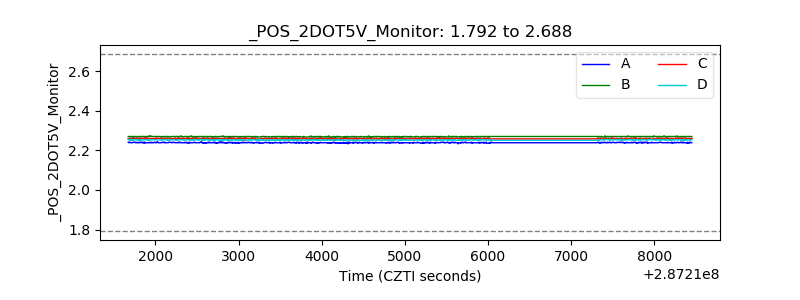 |
| +5 Volts monitor |  |
| _ROLL_ROT | 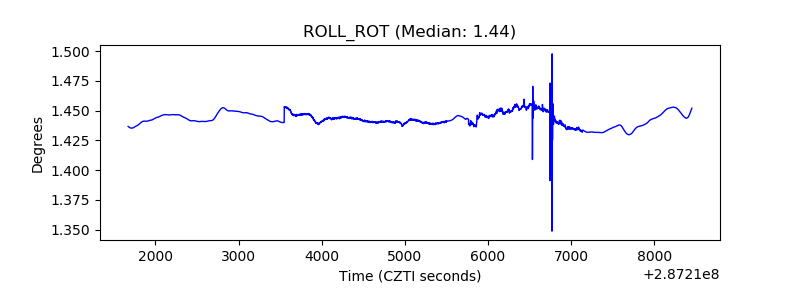 |
| _Roll_DEC | 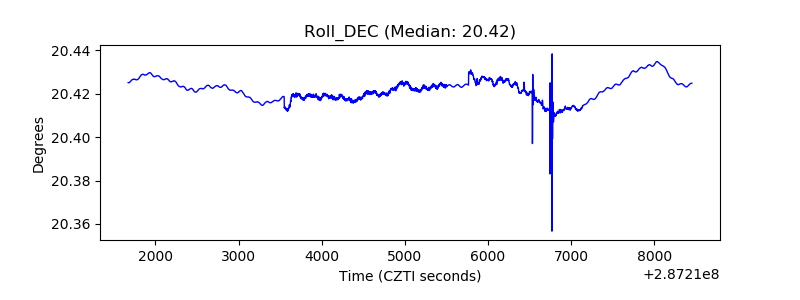 |
| _Roll_RA | 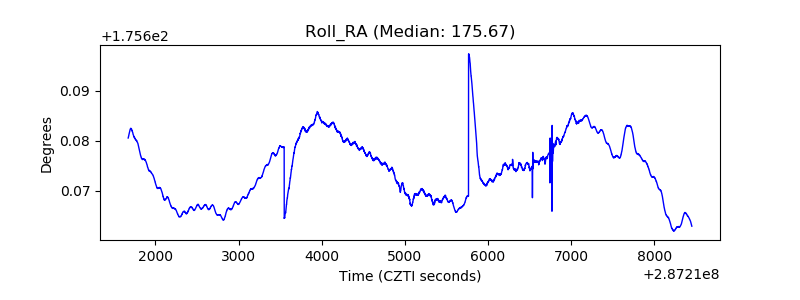 |
| Veto Counter | 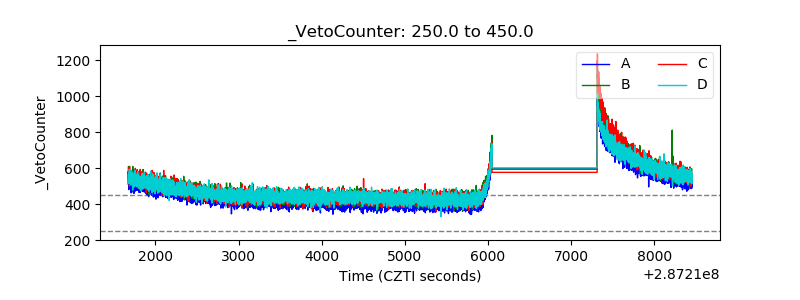 |