| Param | Original file | Final file |
|---|---|---|
| Filename | modeM0/AS1A05_063T02_9000002708_18180cztM0_level2.evt | modeM0/AS1A05_063T02_9000002708_18180cztM0_level2_quad_clean.evt |
| Size (bytes) | 518,250,240 | 71,245,440 |
| Size | 494.2 MB | 67.9 MB |
| Events in quadrant A | 3,639,303 | 436,777 |
| Events in quadrant B | 3,893,914 | 439,916 |
| Events in quadrant C | 3,870,551 | 420,797 |
| Events in quadrant D | 3,862,698 | 418,728 |
| Mode M9 | |||
|---|---|---|---|
| Quadrant | BADHDUFLAG | Total packets | Discarded packets |
| A | 0 | 14 | 0 |
| B | 0 | 14 | 0 |
| C | 0 | 14 | 0 |
| D | 0 | 14 | 0 |
| Mode M0 | |||
|---|---|---|---|
| Quadrant | BADHDUFLAG | Total packets | Discarded packets |
| A | 0 | 14620 | 2 |
| B | 0 | 15419 | 1 |
| C | 0 | 15328 | 1 |
| D | 0 | 15378 | 1 |
| Mode SS | |||
|---|---|---|---|
| Quadrant | BADHDUFLAG | Total packets | Discarded packets |
| A | 0 | 128 | 0 |
| B | 0 | 128 | 0 |
| C | 0 | 128 | 0 |
| D | 0 | 128 | 0 |
| Quadrant | Total seconds | Saturated seconds | Saturation percentage |
|---|---|---|---|
| A | 6321 | 142 | 2.246480% |
| B | 6321 | 263 | 4.160734% |
| C | 6321 | 203 | 3.211517% |
| D | 6321 | 120 | 1.898434% |
Noise dominated data is calculated using 1-second bins in cleaned event files. If a bin has >2000 counts, and if more than 50% of those come from <1% of pixels, then it is considered to be noise-dominated and hence unusable.
| Quadrant | # 1 sec bins | Bins with >0 counts | Bins with >2000 counts | High rate bins dominated by noise | Noise dominated (total time) | Noise dominated (detector-on time) | Marked lightcurve |
|---|---|---|---|---|---|---|---|
| A | 7661 | 6322 | 26 | 26 | 0.34% | 0.41% | 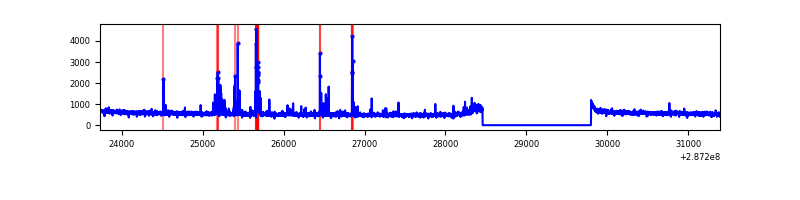 |
| B | 7661 | 6322 | 107 | 107 | 1.40% | 1.69% | 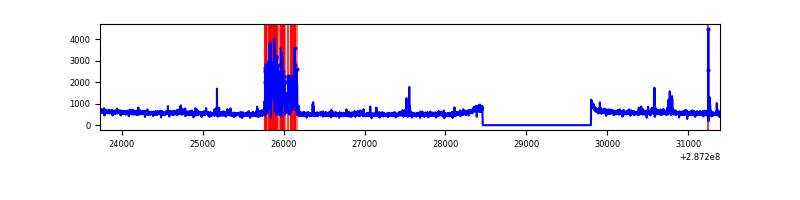 |
| C | 7661 | 6322 | 54 | 54 | 0.70% | 0.85% | 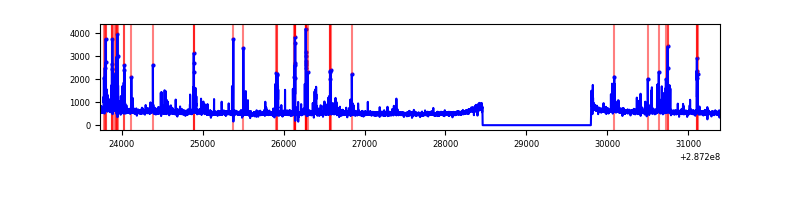 |
| D | 7661 | 6322 | 48 | 48 | 0.63% | 0.76% | 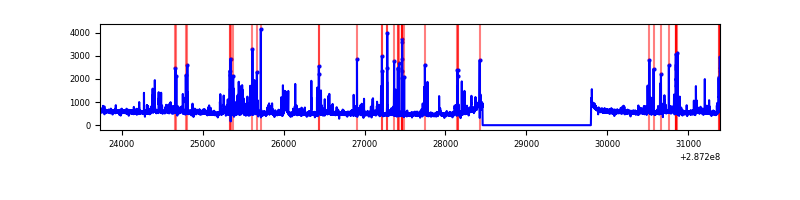 |
Top three noisy pixels from each quadrant. If the there are fewer than three noisy pixels in the level2.evt file, extra rows are filled as -1
| Pixel properties | Quadrant properties | ||||||
|---|---|---|---|---|---|---|---|
| Quadrant | DetID | PixID | Counts | Sigma | Mean | Median | Sigma |
| A | 4 | 2 | 206859 | 1164.71 | 887 | 872 | 176.9 |
| A | 15 | 174 | 26776 | 146.47 | 887 | 872 | 176.9 |
| A | 0 | 226 | 7934 | 39.93 | 887 | 872 | 176.9 |
| B | 7 | 220 | 436910 | 2690.22 | 863 | 845 | 162.1 |
| B | 0 | 229 | 23191 | 137.86 | 863 | 845 | 162.1 |
| B | 0 | 189 | 22774 | 135.29 | 863 | 845 | 162.1 |
| C | 4 | 254 | 458898 | 2360.92 | 838 | 847 | 194.0 |
| C | 14 | 238 | 133343 | 682.92 | 838 | 847 | 194.0 |
| C | 13 | 61 | 5998 | 26.55 | 838 | 847 | 194.0 |
| D | 7 | 238 | 488155 | 2352.83 | 864 | 843 | 207.1 |
| D | 10 | 70 | 48731 | 231.21 | 864 | 843 | 207.1 |
| D | 2 | 234 | 29442 | 138.08 | 864 | 843 | 207.1 |
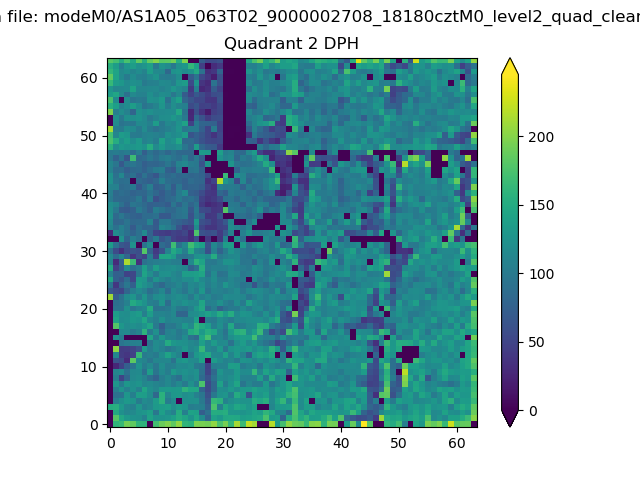
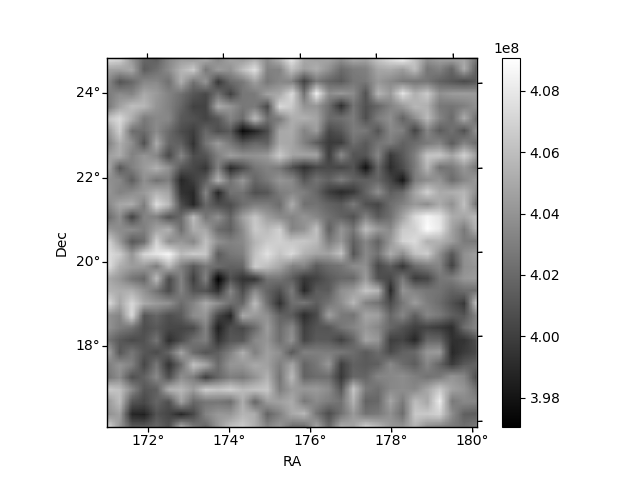
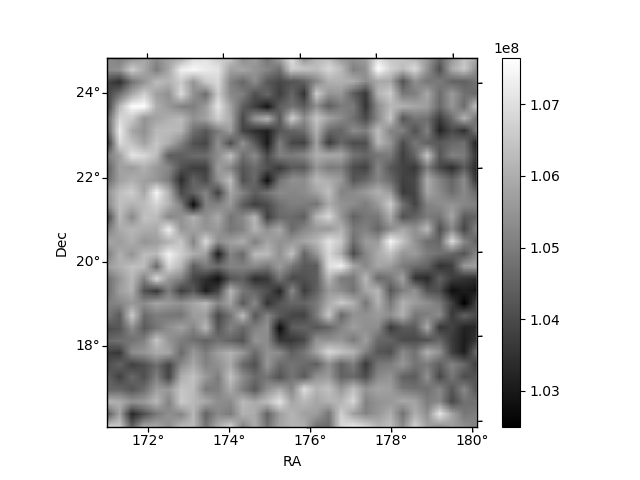
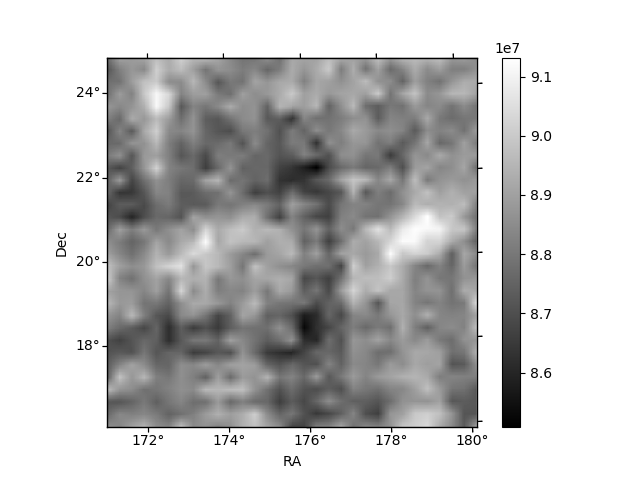
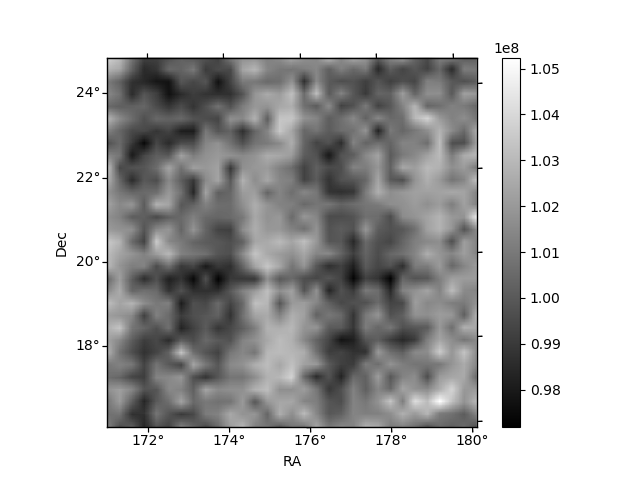
Histogram calculated using DETX and DETY for each event in the final _common_clean file
| Quadrant A | 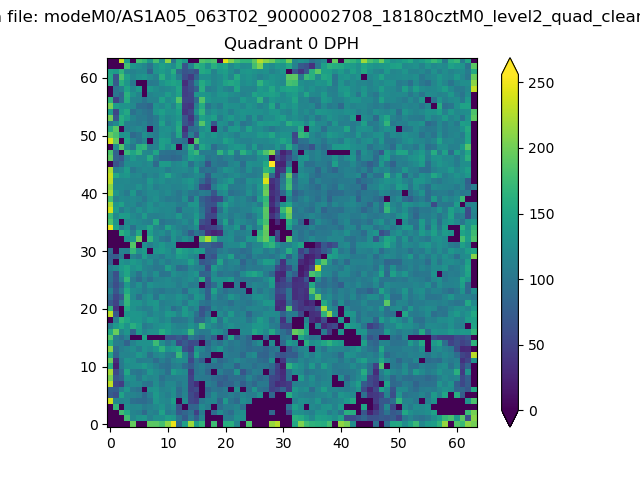 |
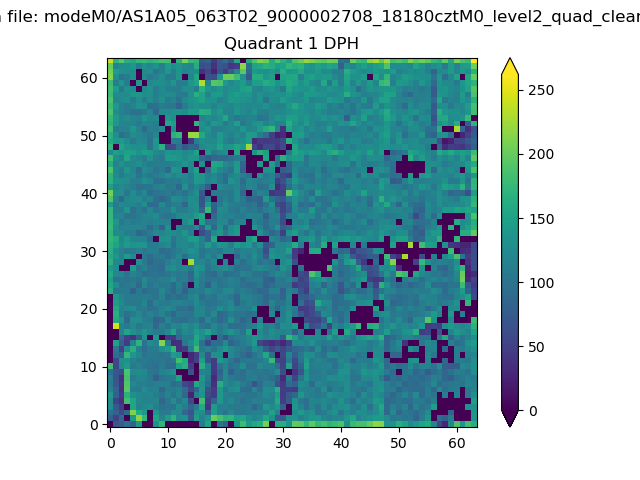 |
Quadrant B |
|---|---|---|---|
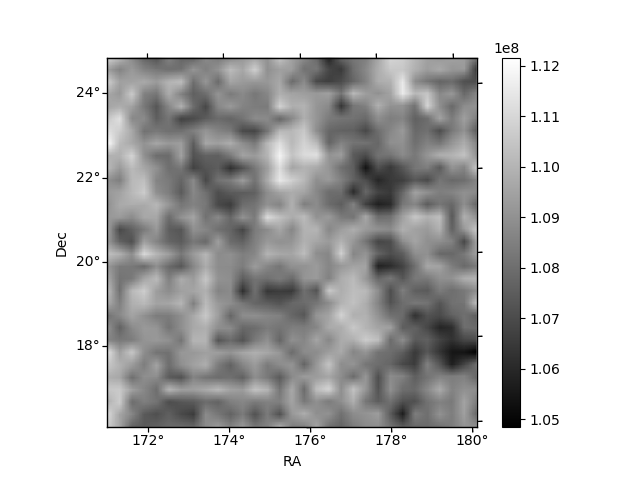
| Quadrant D | 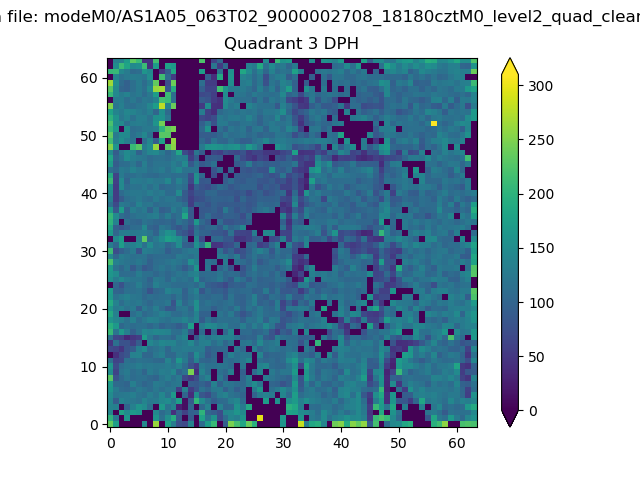 |
 |
Quadrant C |
| Plot type | Count rate plots | Images |
|---|---|---|
| Comparison with Poisson distribution Blue bars denote a histogram of data divided into 1 sec bins. Red curve is a Poisson curve with rate = median count rate of data. |
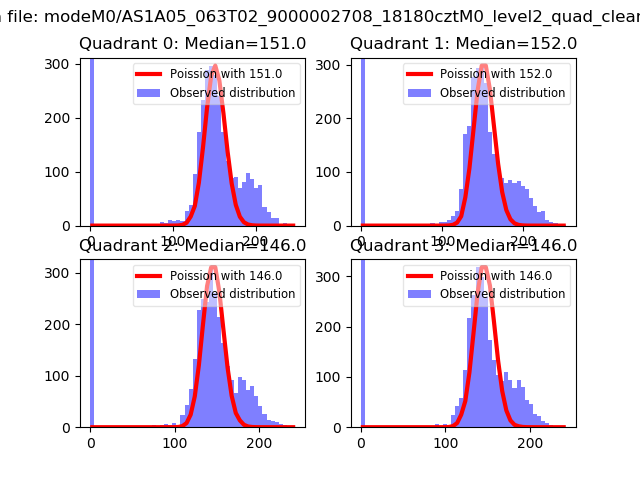 |
 |
| Quadrant-wise count rates Data is divided into 100 sec bins |
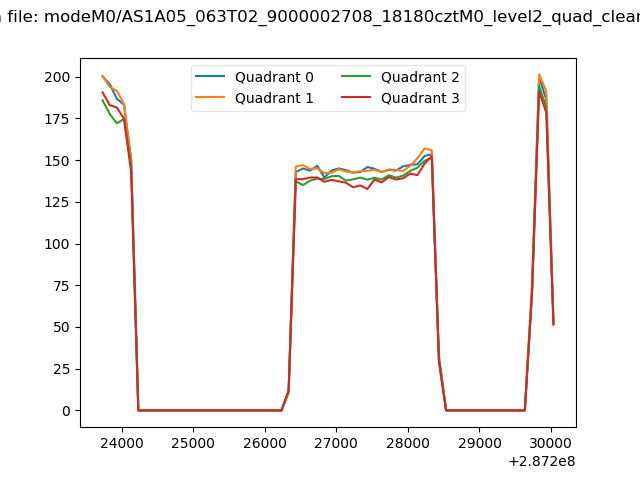 |
|
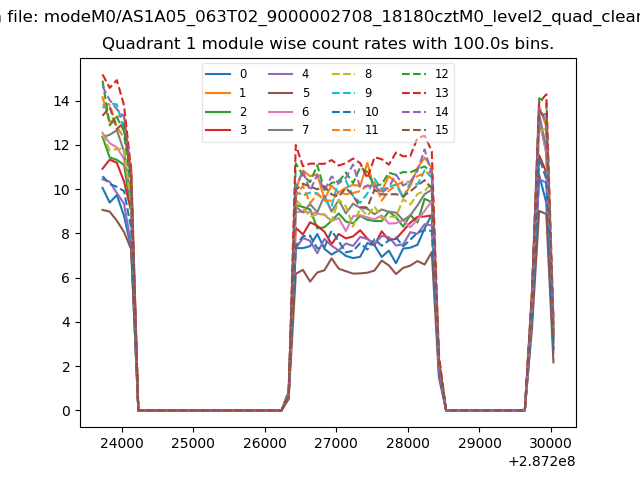
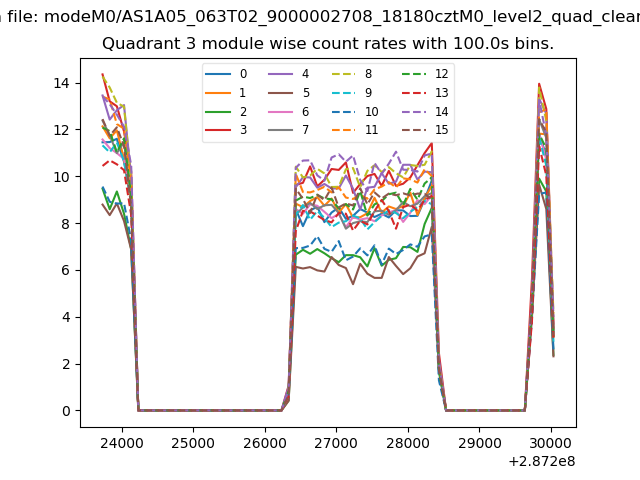
| Module-wise count rates for Quadrant A Data is divided into 100 sec bins |
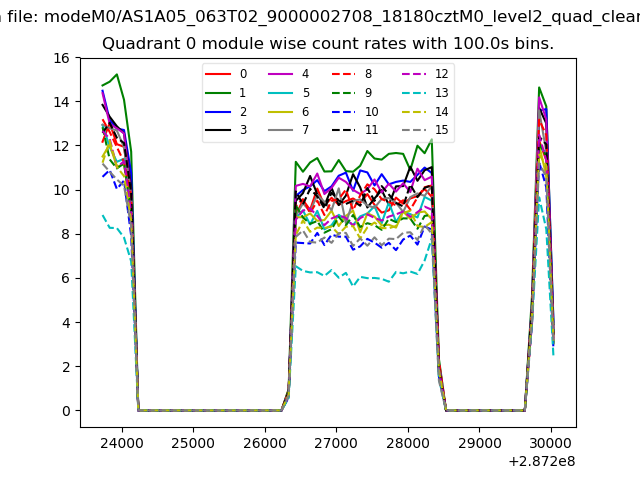 |
 |
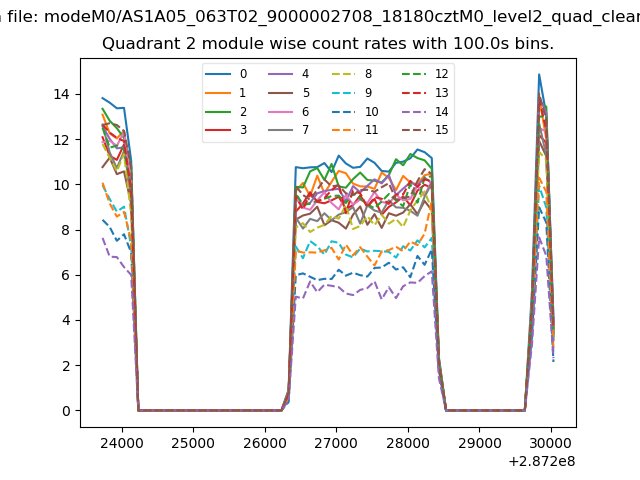
| Module-wise count rates for Quadrant B Data is divided into 100 sec bins |
 |
 |
| Module-wise count rates for Quadrant C Data is divided into 100 sec bins |
 |
 |
| Module-wise count rates for Quadrant D Data is divided into 100 sec bins |
 |
 |
| Parameter | Plot |
|---|---|
| CZT HV Monitor | 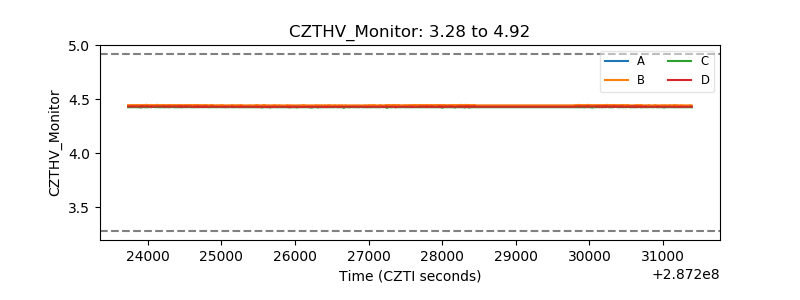 |
| D_VDD | 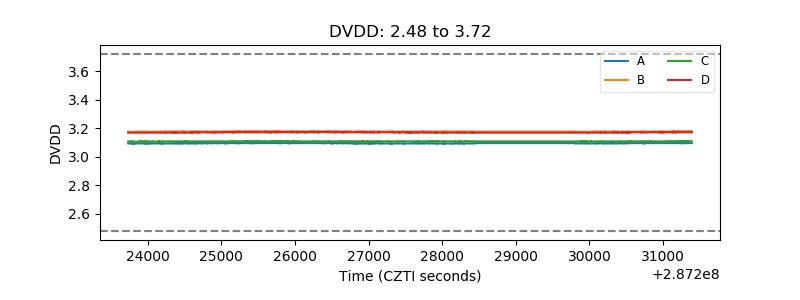 |
| Temperature 1 | 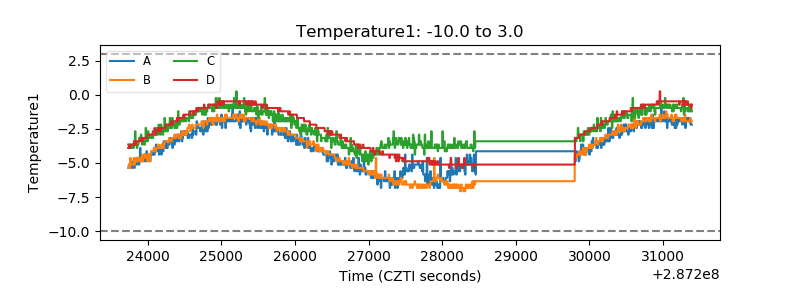 |
| Veto HV Monitor |  |
| Veto LLD | 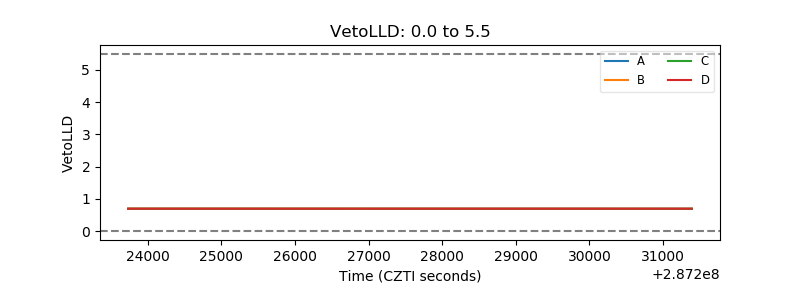 |
| Alpha Counter | 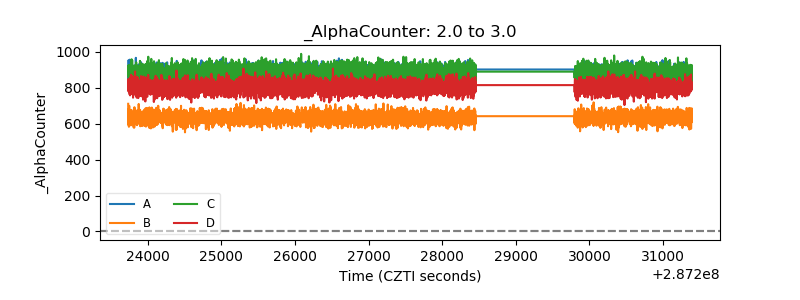 |
| _CPM_Rate | 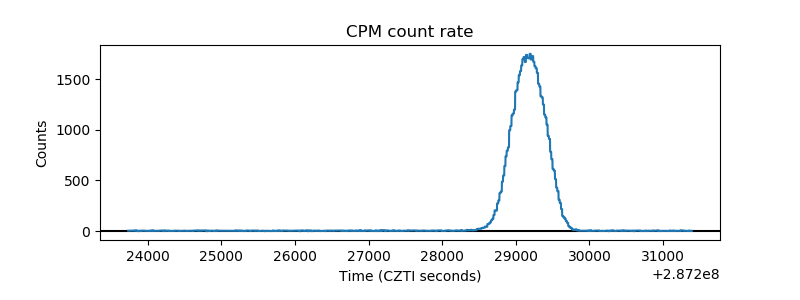 |
| CZT Counter | 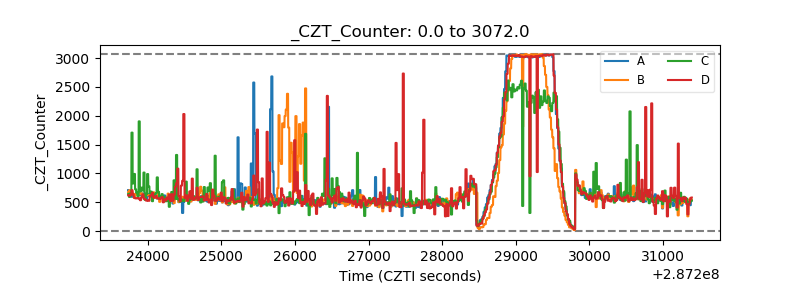 |
| +2.5 Volts monitor |  |
| +5 Volts monitor | 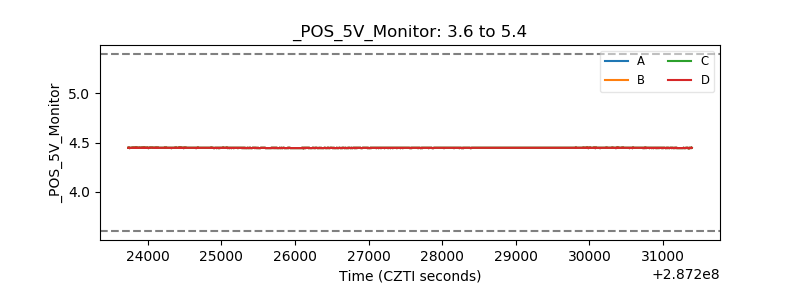 |
| _ROLL_ROT | 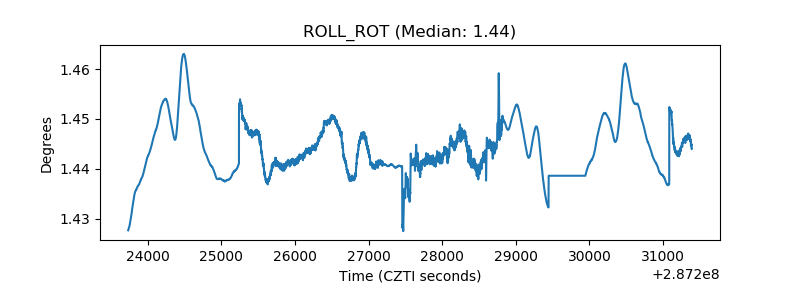 |
| _Roll_DEC | 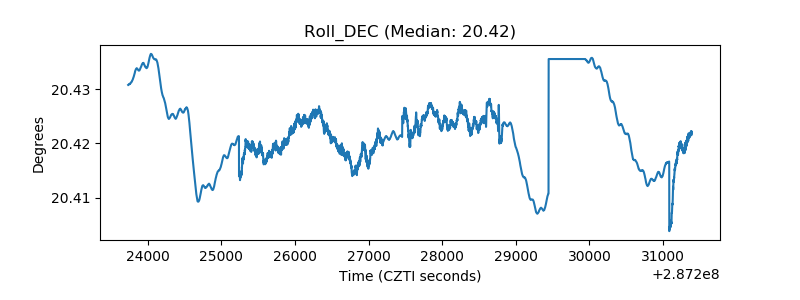 |
| _Roll_RA | 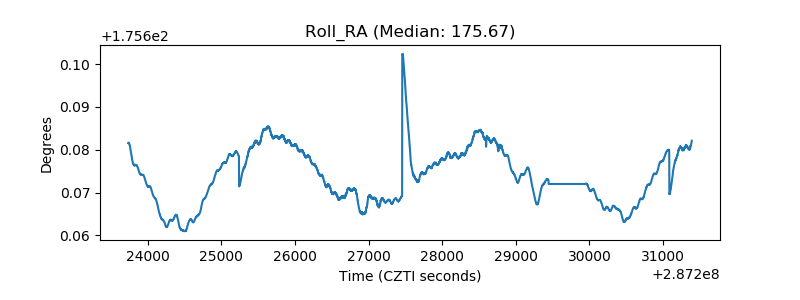 |
| Veto Counter | 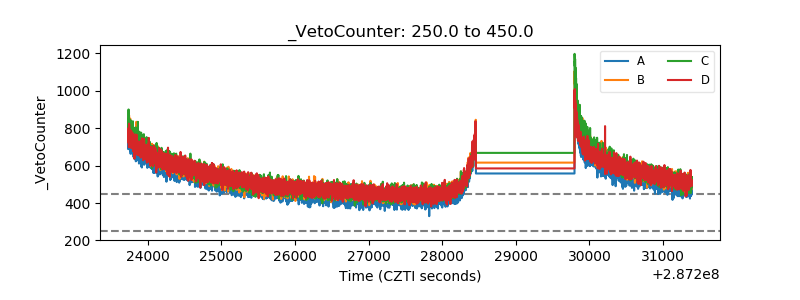 |