| Param | Original file | Final file |
|---|---|---|
| Filename | modeM0/AS1A05_063T02_9000002708_18181cztM0_level2.evt | modeM0/AS1A05_063T02_9000002708_18181cztM0_level2_quad_clean.evt |
| Size (bytes) | 256,000,320 | 30,323,520 |
| Size | 244.1 MB | 28.9 MB |
| Events in quadrant A | 1,776,354 | 171,459 |
| Events in quadrant B | 1,866,083 | 172,706 |
| Events in quadrant C | 1,896,871 | 167,095 |
| Events in quadrant D | 1,981,664 | 165,665 |
| Mode M0 | |||
|---|---|---|---|
| Quadrant | BADHDUFLAG | Total packets | Discarded packets |
| A | 0 | 7267 | 0 |
| B | 0 | 7596 | 0 |
| C | 0 | 7629 | 0 |
| D | 0 | 7948 | 0 |
| Mode SS | |||
|---|---|---|---|
| Quadrant | BADHDUFLAG | Total packets | Discarded packets |
| A | 0 | 68 | 0 |
| B | 0 | 68 | 0 |
| C | 0 | 68 | 0 |
| D | 0 | 68 | 0 |
| Quadrant | Total seconds | Saturated seconds | Saturation percentage |
|---|---|---|---|
| A | 3392 | 5 | 0.147406% |
| B | 3392 | 20 | 0.589623% |
| C | 3392 | 38 | 1.120283% |
| D | 3392 | 56 | 1.650943% |
Noise dominated data is calculated using 1-second bins in cleaned event files. If a bin has >2000 counts, and if more than 50% of those come from <1% of pixels, then it is considered to be noise-dominated and hence unusable.
| Quadrant | # 1 sec bins | Bins with >0 counts | Bins with >2000 counts | High rate bins dominated by noise | Noise dominated (total time) | Noise dominated (detector-on time) | Marked lightcurve |
|---|---|---|---|---|---|---|---|
| A | 3392 | 3392 | 2 | 2 | 0.06% | 0.06% | 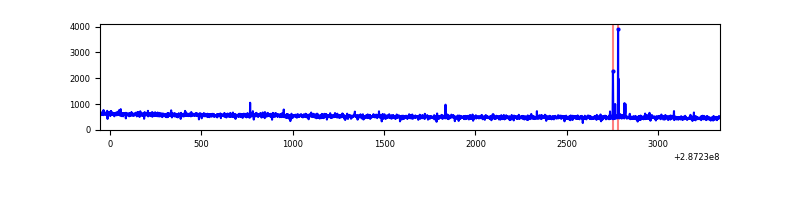 |
| B | 3392 | 3392 | 9 | 9 | 0.27% | 0.27% | 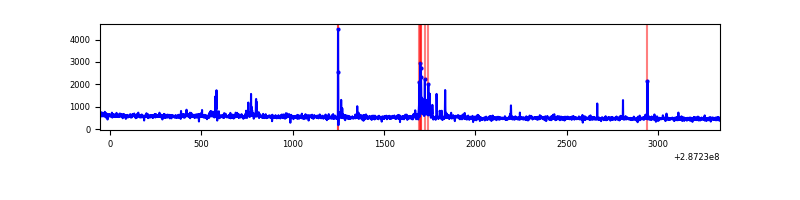 |
| C | 3392 | 3392 | 10 | 10 | 0.29% | 0.29% | 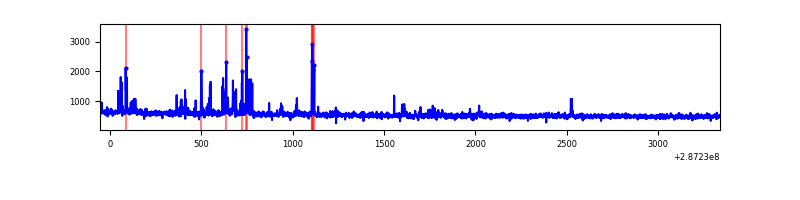 |
| D | 3392 | 3392 | 46 | 46 | 1.36% | 1.36% | 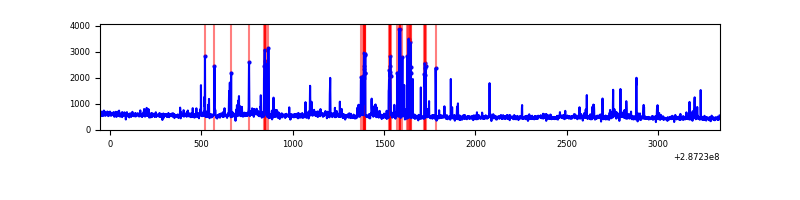 |
Top three noisy pixels from each quadrant. If the there are fewer than three noisy pixels in the level2.evt file, extra rows are filled as -1
| Pixel properties | Quadrant properties | ||||||
|---|---|---|---|---|---|---|---|
| Quadrant | DetID | PixID | Counts | Sigma | Mean | Median | Sigma |
| A | 4 | 2 | 16899 | 178.88 | 454 | 447 | 92.0 |
| A | 15 | 174 | 8249 | 84.83 | 454 | 447 | 92.0 |
| A | 3 | 15 | 5013 | 49.65 | 454 | 447 | 92.0 |
| B | 5 | 172 | 52633 | 619.87 | 447 | 437 | 84.2 |
| B | 7 | 220 | 18759 | 217.59 | 447 | 437 | 84.2 |
| B | 0 | 189 | 16622 | 192.21 | 447 | 437 | 84.2 |
| C | 4 | 254 | 133973 | 1327.74 | 433 | 437 | 100.6 |
| C | 14 | 238 | 69429 | 685.98 | 433 | 437 | 100.6 |
| C | 5 | 218 | 4598 | 41.37 | 433 | 437 | 100.6 |
| D | 7 | 238 | 254505 | 2312.53 | 443 | 430 | 109.9 |
| D | 10 | 70 | 18248 | 162.18 | 443 | 430 | 109.9 |
| D | 2 | 234 | 16520 | 146.45 | 443 | 430 | 109.9 |
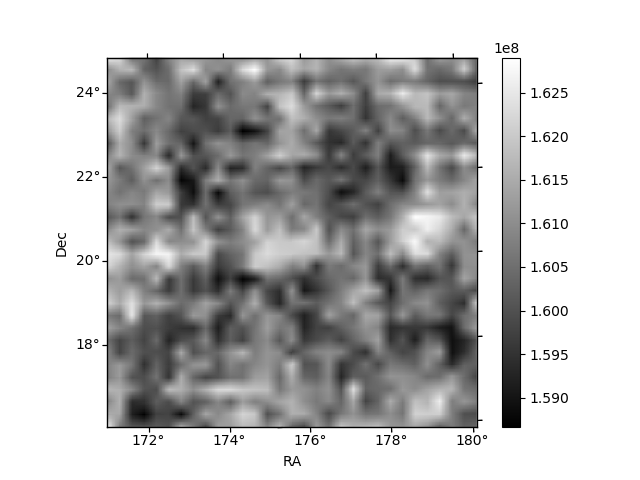
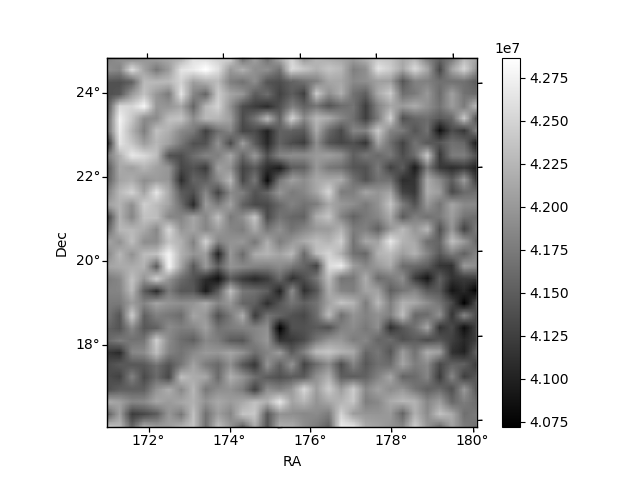
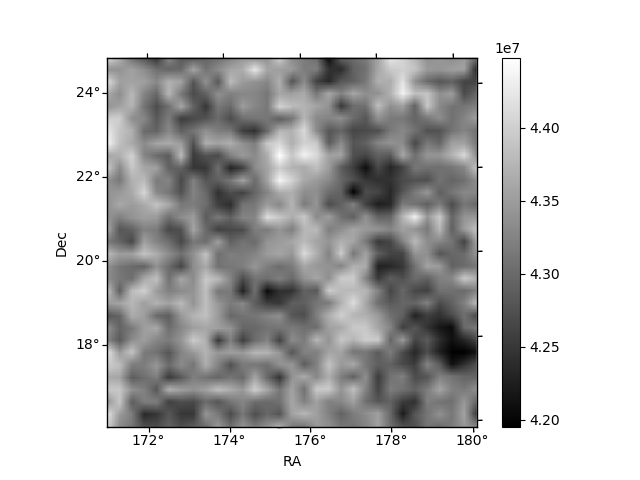
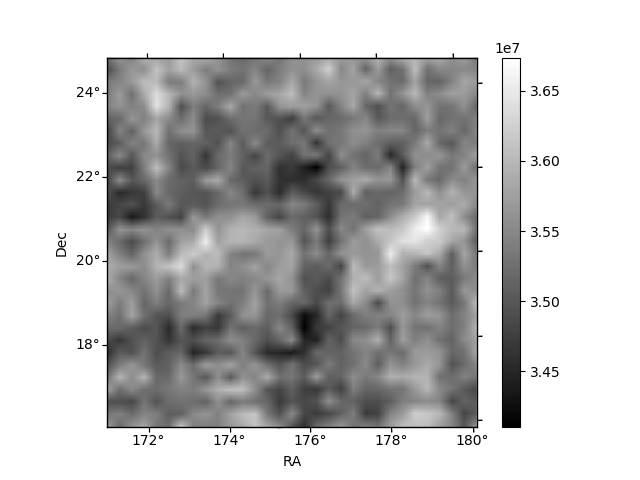
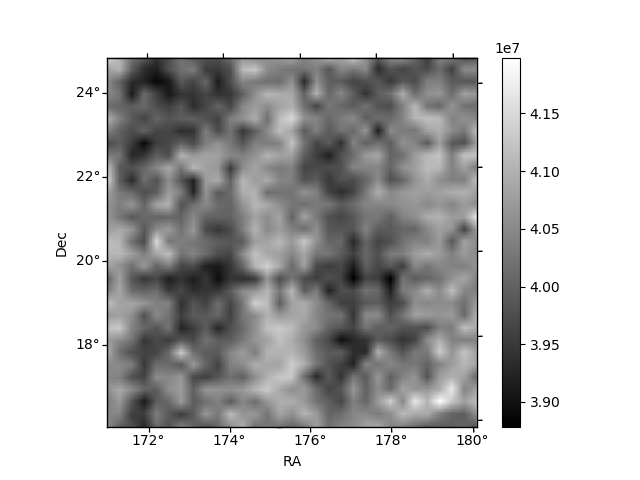
Histogram calculated using DETX and DETY for each event in the final _common_clean file
| Quadrant A | 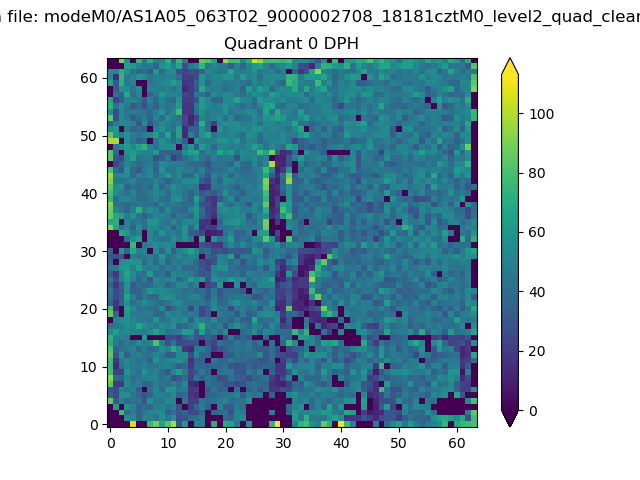 |
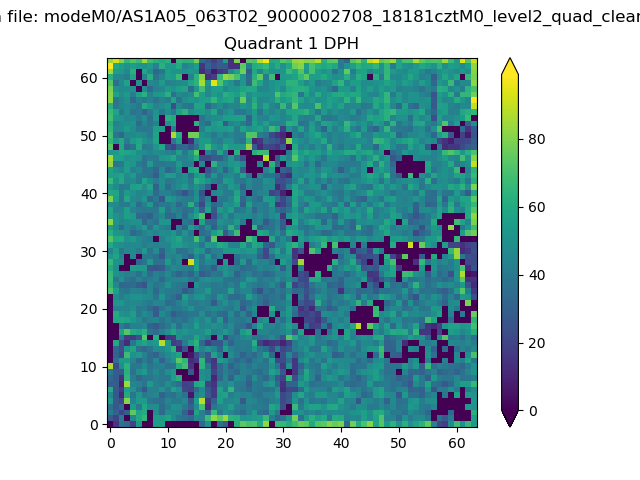 |
Quadrant B |
|---|---|---|---|
| Quadrant D | 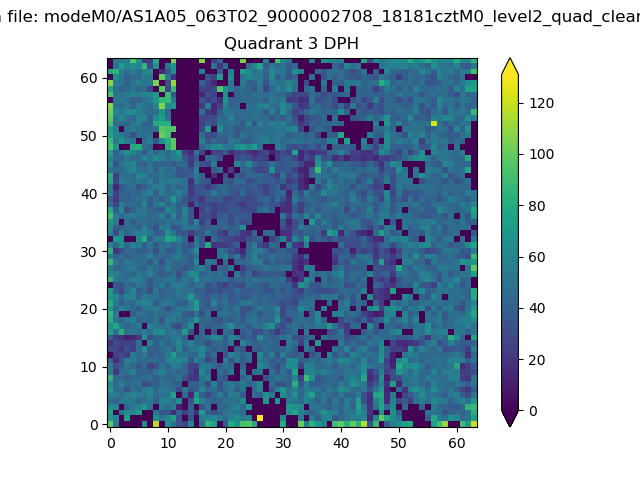 |
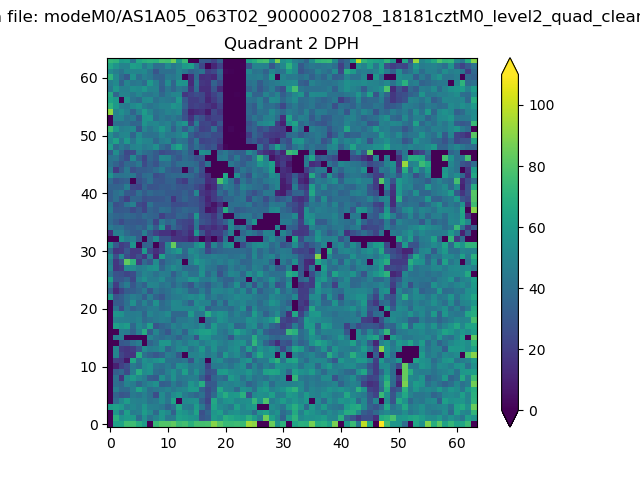 |
Quadrant C |
| Plot type | Count rate plots | Images |
|---|---|---|
| Comparison with Poisson distribution Blue bars denote a histogram of data divided into 1 sec bins. Red curve is a Poisson curve with rate = median count rate of data. |
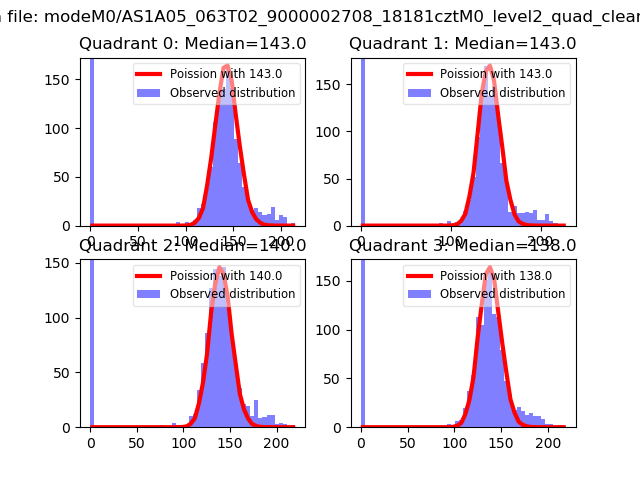 |
 |
| Quadrant-wise count rates Data is divided into 100 sec bins |
 |
|
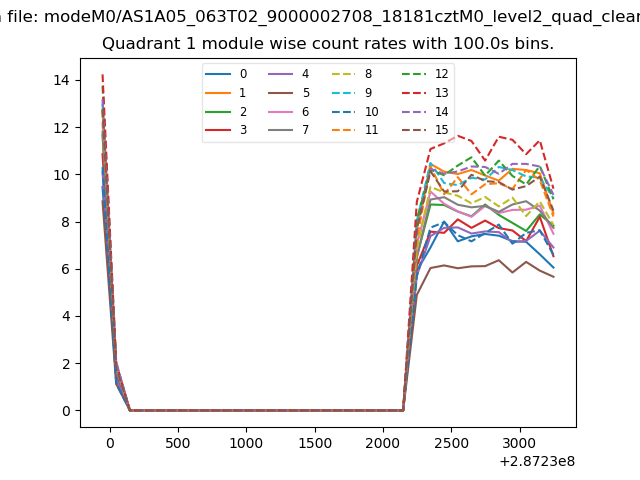
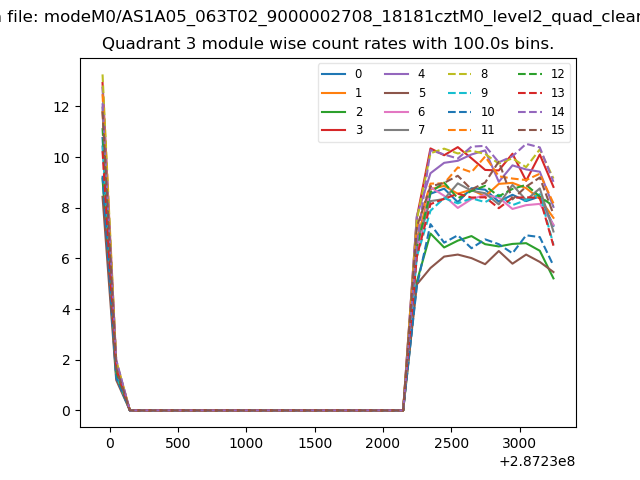
| Module-wise count rates for Quadrant A Data is divided into 100 sec bins |
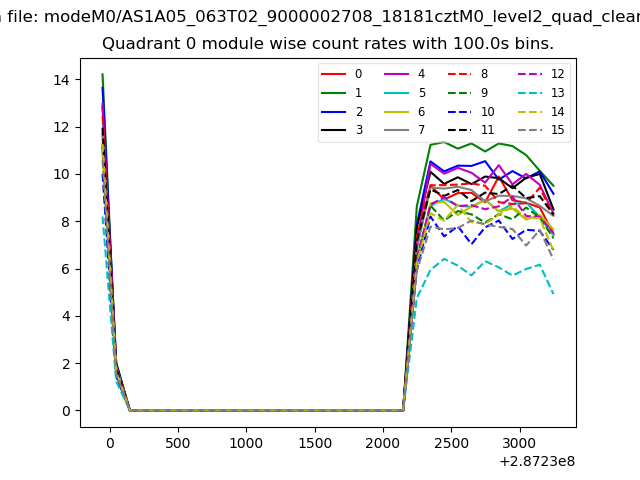 |
 |
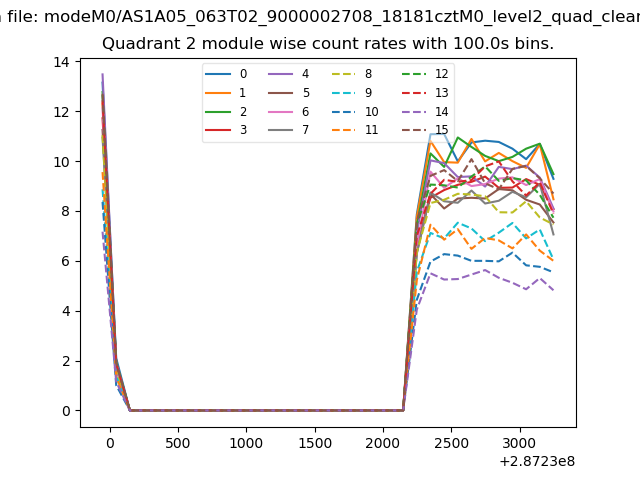
| Module-wise count rates for Quadrant B Data is divided into 100 sec bins |
 |
 |
| Module-wise count rates for Quadrant C Data is divided into 100 sec bins |
 |
 |
| Module-wise count rates for Quadrant D Data is divided into 100 sec bins |
 |
 |
| Parameter | Plot |
|---|---|
| CZT HV Monitor | 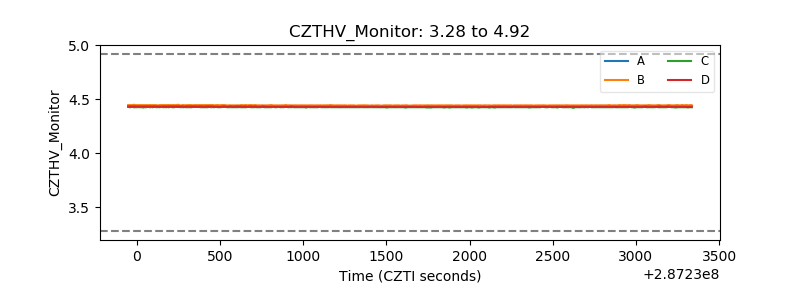 |
| D_VDD | 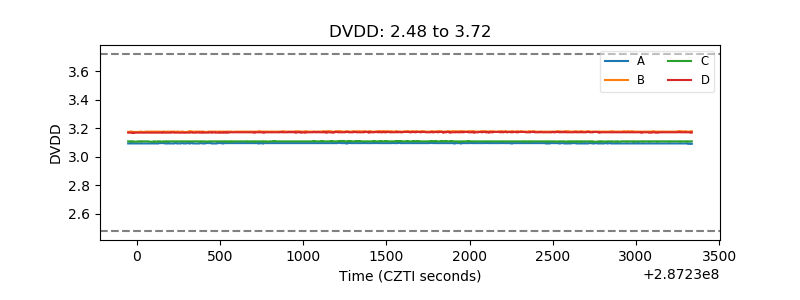 |
| Temperature 1 | 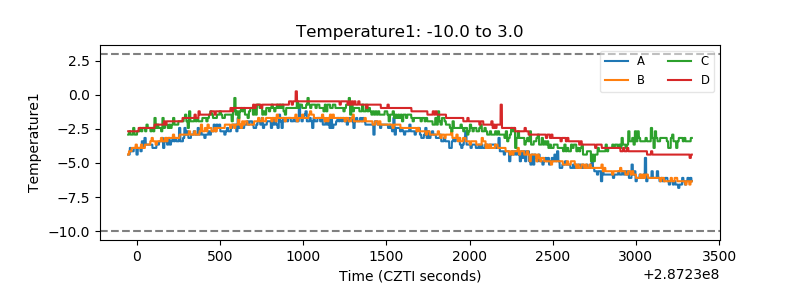 |
| Veto HV Monitor | 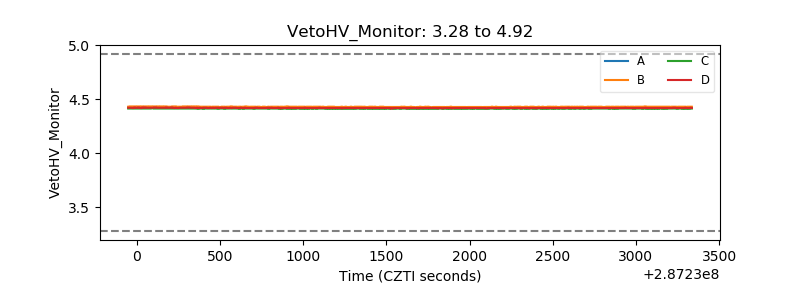 |
| Veto LLD |  |
| Alpha Counter |  |
| _CPM_Rate | 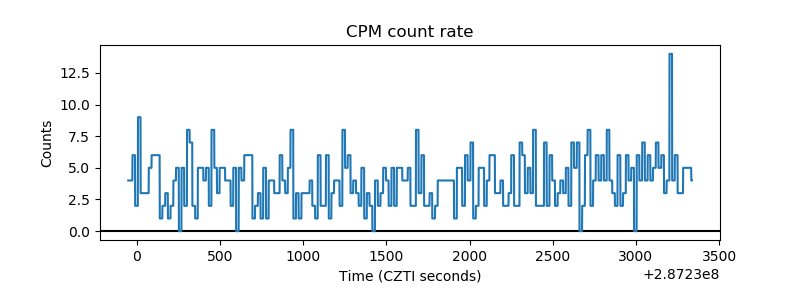 |
| CZT Counter | 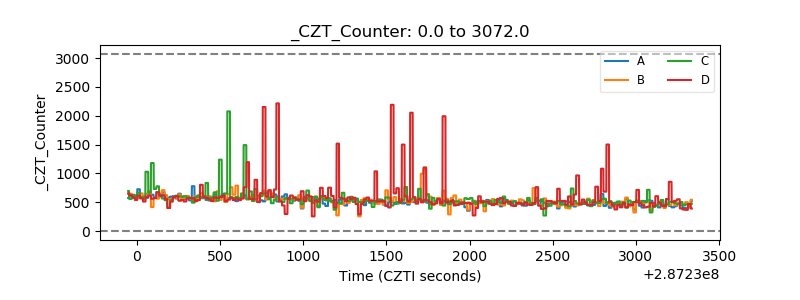 |
| +2.5 Volts monitor |  |
| +5 Volts monitor |  |
| _ROLL_ROT | 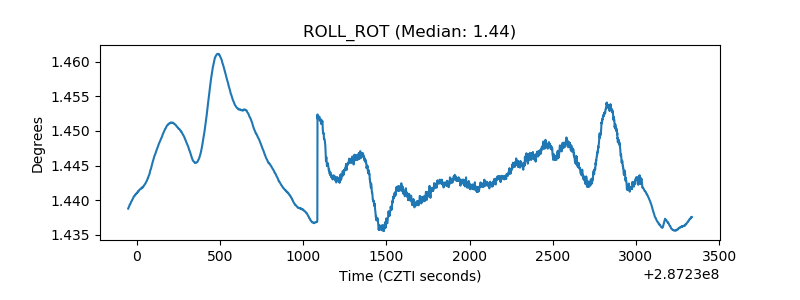 |
| _Roll_DEC | 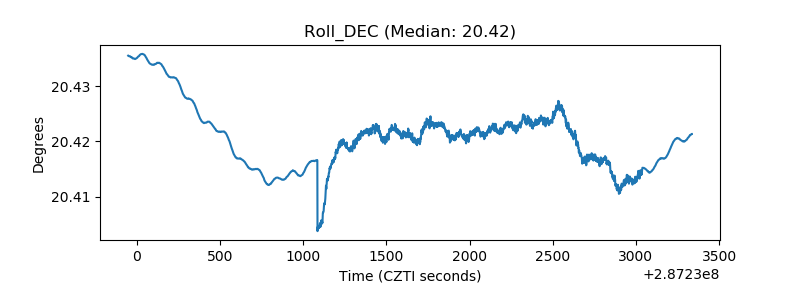 |
| _Roll_RA | 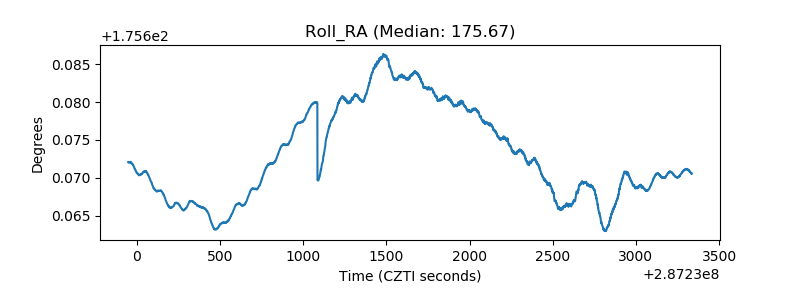 |
| Veto Counter | 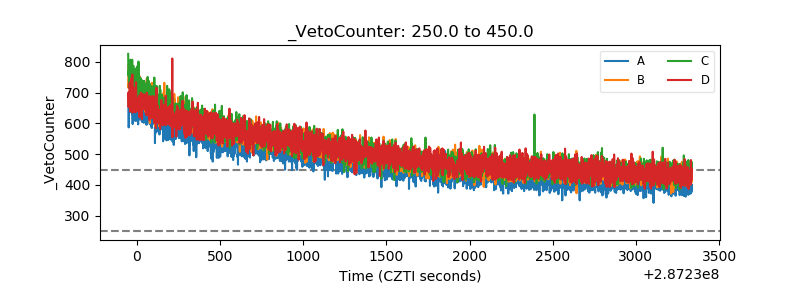 |