| Param | Original file | Final file |
|---|---|---|
| Filename | modeM0/AS1A05_176T05_9000002706cztM0_level2.fits | modeM0/AS1A05_176T05_9000002706cztM0_level2_quad_clean.evt |
| Size (bytes) | 93,983,040 | 66,718,080 |
| Size | 89.6 MB | 63.6 MB |
| Events in quadrant A | 583,178 | 355,517 |
| Events in quadrant B | 556,576 | 353,955 |
| Events in quadrant C | 561,310 | 343,324 |
| Events in quadrant D | 489,080 | 310,917 |
| Mode SS | |||
|---|---|---|---|
| Quadrant | BADHDUFLAG | Total packets | Discarded packets |
| A | 0 | 192 | 0 |
| B | 0 | 192 | 0 |
| C | 0 | 192 | 0 |
| D | 0 | 192 | 0 |
| Mode M9 | |||
|---|---|---|---|
| Quadrant | BADHDUFLAG | Total packets | Discarded packets |
| A | 0 | 19 | 0 |
| B | 0 | 19 | 0 |
| C | 0 | 19 | 0 |
| D | 0 | 19 | 0 |
| Mode M0 | |||
|---|---|---|---|
| Quadrant | BADHDUFLAG | Total packets | Discarded packets |
| A | 0 | 20116 | 0 |
| B | 0 | 20659 | 0 |
| C | 0 | 22376 | 0 |
| D | 0 | 29477 | 0 |
| Quadrant | Total seconds | Saturated seconds | Saturation percentage |
|---|---|---|---|
| A | 9462 | 275 | 2.906362% |
| B | 9462 | 241 | 2.547030% |
| C | 9462 | 480 | 5.072923% |
| D | 9462 | 628 | 6.637075% |
Noise dominated data is calculated using 1-second bins in cleaned event files. If a bin has >2000 counts, and if more than 50% of those come from <1% of pixels, then it is considered to be noise-dominated and hence unusable.
| Quadrant | # 1 sec bins | Bins with >0 counts | Bins with >2000 counts | High rate bins dominated by noise | Noise dominated (total time) | Noise dominated (detector-on time) | Marked lightcurve |
|---|---|---|---|---|---|---|---|
| A | 11332 | 9462 | 0 | 0 | 0.00% | 0.00% | 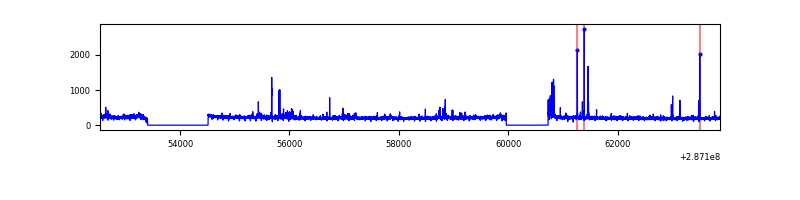 |
| B | 11332 | 9462 | 0 | 0 | 0.00% | 0.00% | 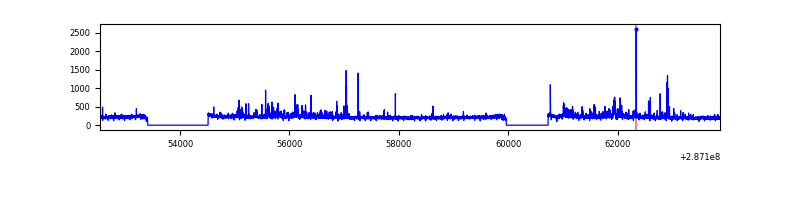 |
| C | 11332 | 9461 | 0 | 0 | 0.00% | 0.00% | 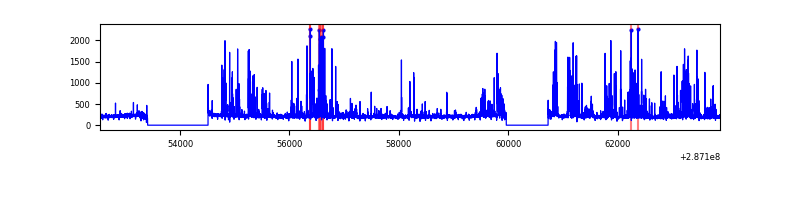 |
| D | 11332 | 9460 | 0 | 0 | 0.00% | 0.00% | 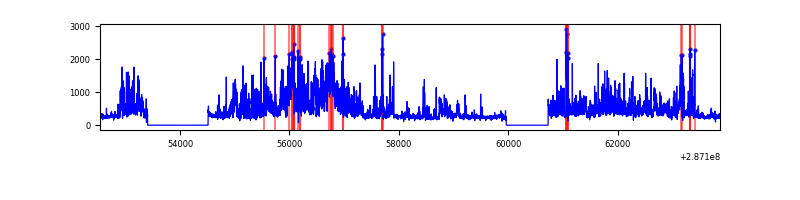 |
Top three noisy pixels from each quadrant. If the there are fewer than three noisy pixels in the level2.evt file, extra rows are filled as -1
| Pixel properties | Quadrant properties | ||||||
|---|---|---|---|---|---|---|---|
| Quadrant | DetID | PixID | Counts | Sigma | Mean | Median | Sigma |
| A | 0 | 29 | 590 | 11.47 | 151 | 142 | 39.1 |
| A | 7 | 110 | 494 | 9.01 | 151 | 142 | 39.1 |
| A | 0 | 28 | 443 | 7.7 | 151 | 142 | 39.1 |
| B | 2 | 9 | 433 | 9.39 | 146 | 140 | 31.2 |
| B | 5 | 225 | 399 | 8.3 | 146 | 140 | 31.2 |
| B | 5 | 128 | 384 | 7.82 | 146 | 140 | 31.2 |
| C | 12 | 241 | 404 | 6.64 | 148 | 139 | 39.9 |
| C | 3 | 126 | 383 | 6.11 | 148 | 139 | 39.9 |
| C | 2 | 191 | 375 | 5.91 | 148 | 139 | 39.9 |
| D | 3 | 14 | 367 | 6.2 | 139 | 127 | 38.7 |
| D | 6 | 231 | 360 | 6.01 | 139 | 127 | 38.7 |
| D | 10 | 190 | 355 | 5.89 | 139 | 127 | 38.7 |
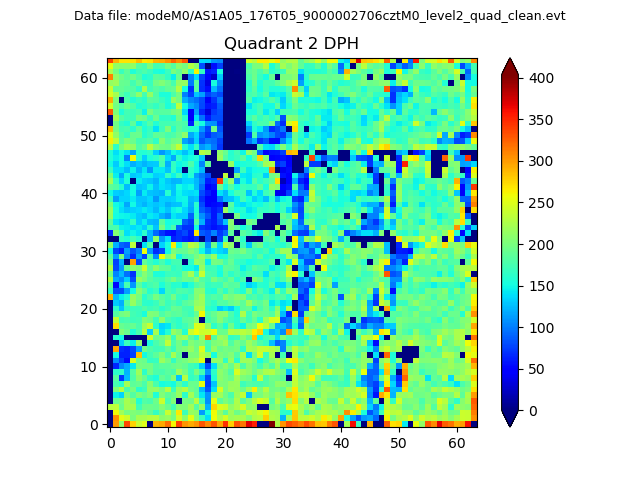
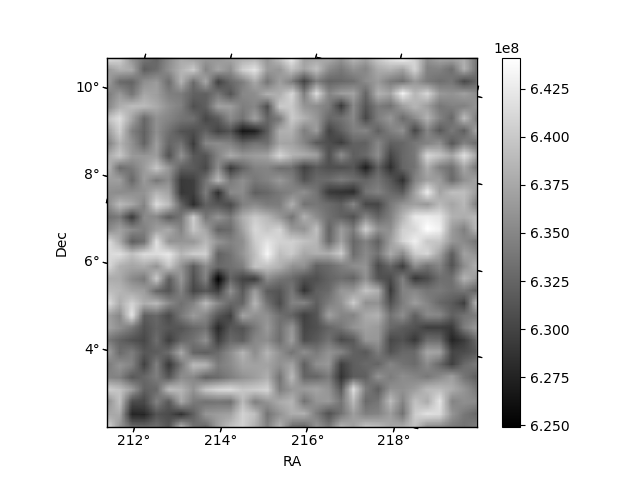
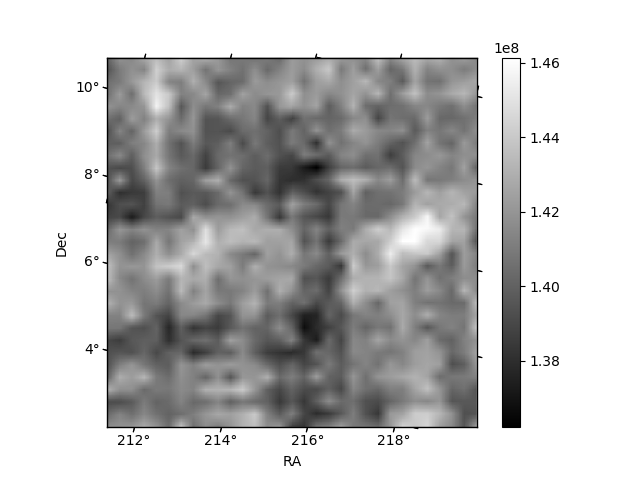
Histogram calculated using DETX and DETY for each event in the final _common_clean file
| Quadrant A | 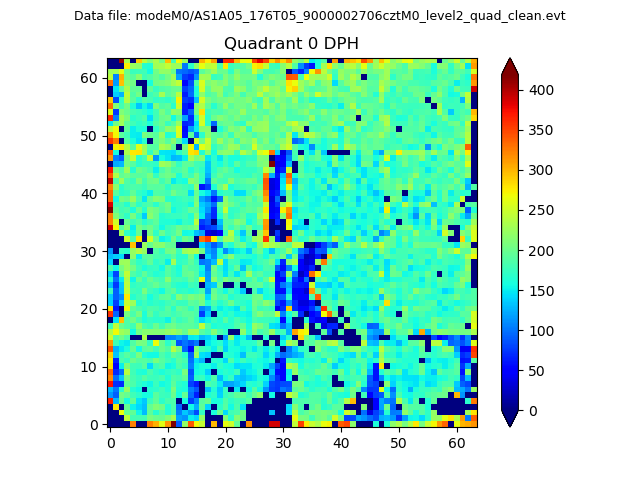 |
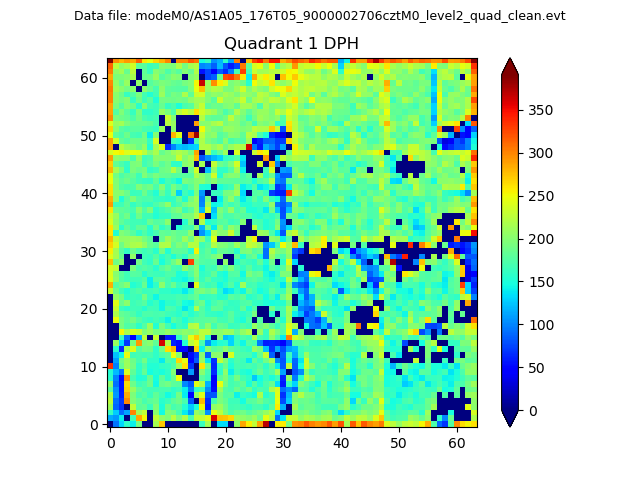 |
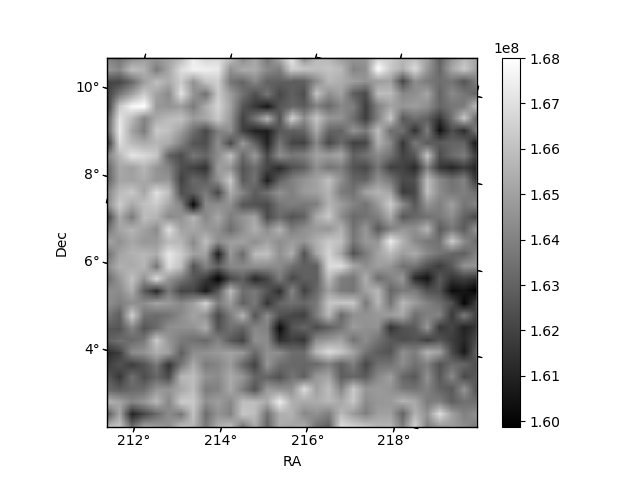
Quadrant B |
|---|---|---|---|
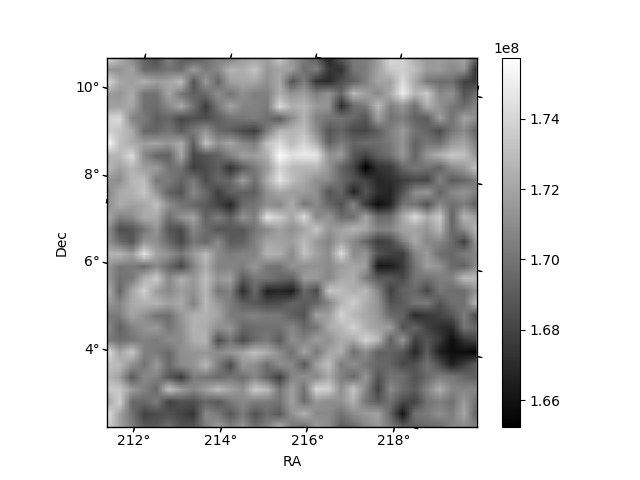
| Quadrant D | 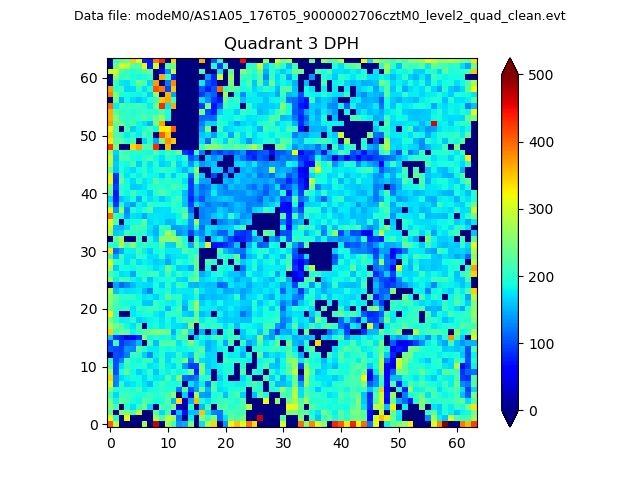 |
 |
Quadrant C |
| Plot type | Count rate plots | Images |
|---|---|---|
| Comparison with Poisson distribution Blue bars denote a histogram of data divided into 1 sec bins. Red curve is a Poisson curve with rate = median count rate of data. |
 |
 |
| Quadrant-wise count rates Data is divided into 100 sec bins |
 |
|
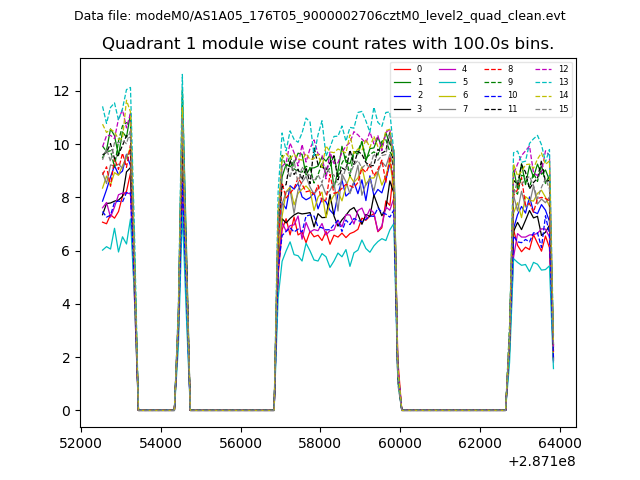
| Module-wise count rates for Quadrant A Data is divided into 100 sec bins |
 |
 |
| Module-wise count rates for Quadrant B Data is divided into 100 sec bins |
 |
 |
| Module-wise count rates for Quadrant C Data is divided into 100 sec bins |
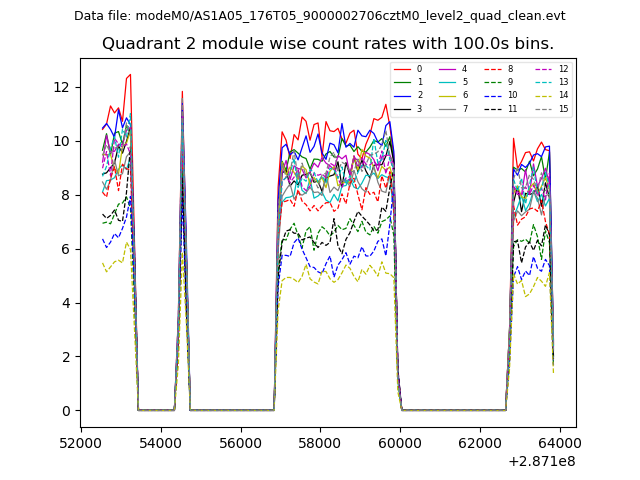 |
 |
| Module-wise count rates for Quadrant D Data is divided into 100 sec bins |
 |
 |
| Parameter | Plot |
|---|---|
| CZT HV Monitor | 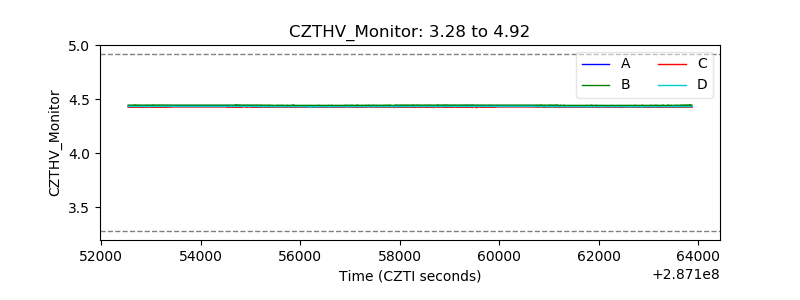 |
| D_VDD | 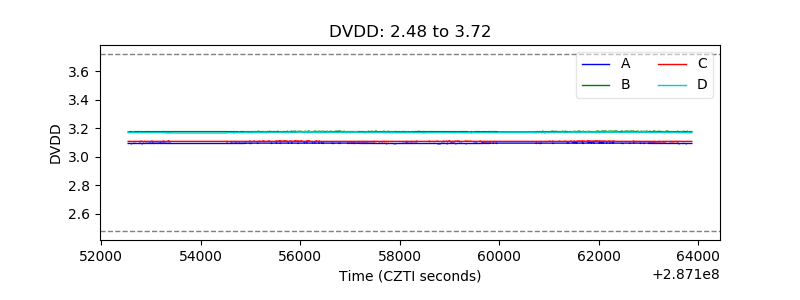 |
| Temperature 1 | 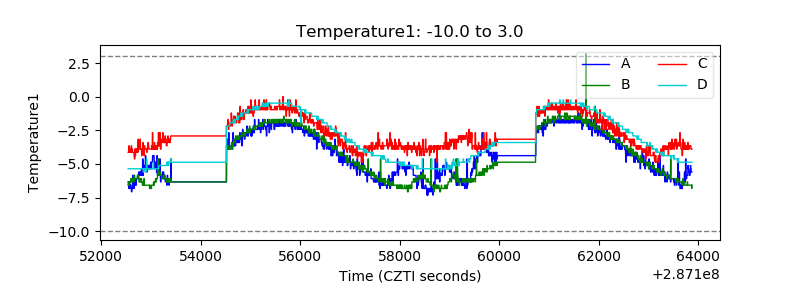 |
| Veto HV Monitor | 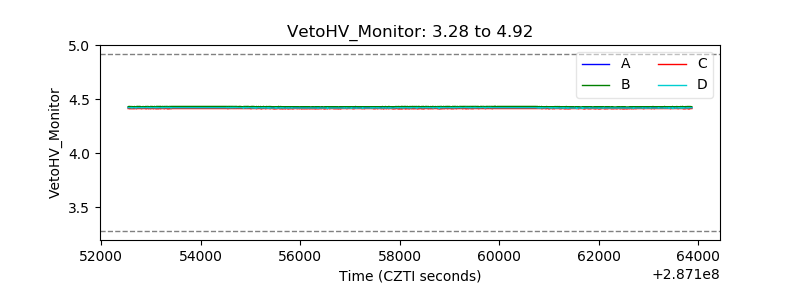 |
| Veto LLD |  |
| Alpha Counter | 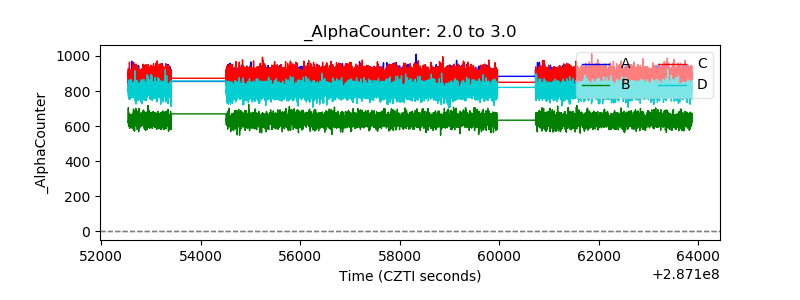 |
| _CPM_Rate | 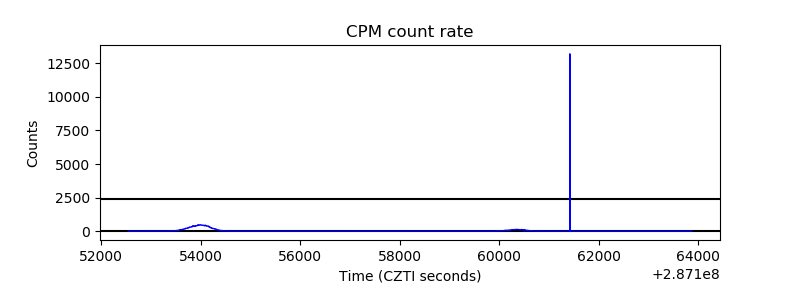 |
| CZT Counter | 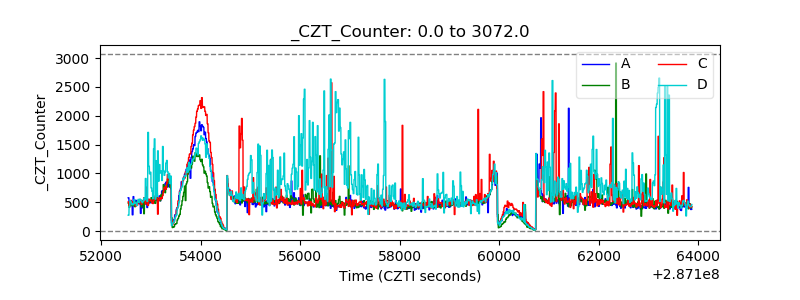 |
| +2.5 Volts monitor |  |
| +5 Volts monitor | 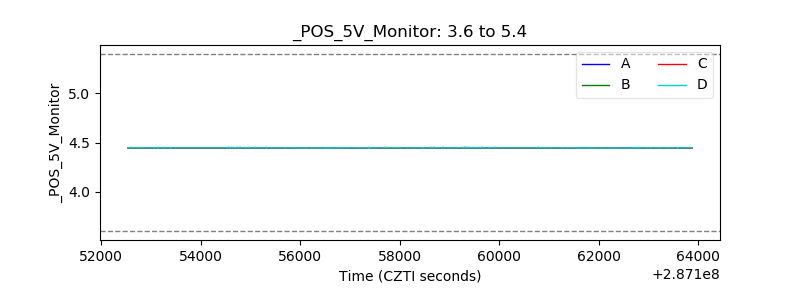 |
| _ROLL_ROT | 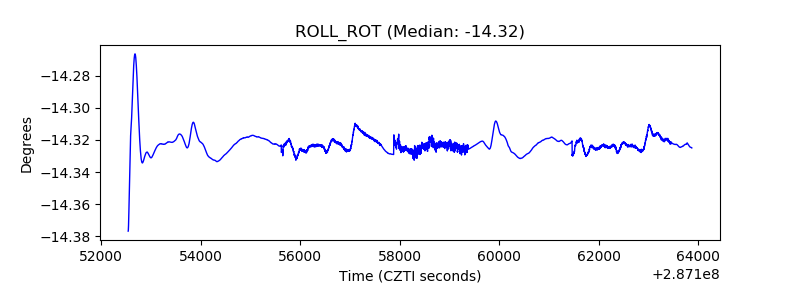 |
| _Roll_DEC | 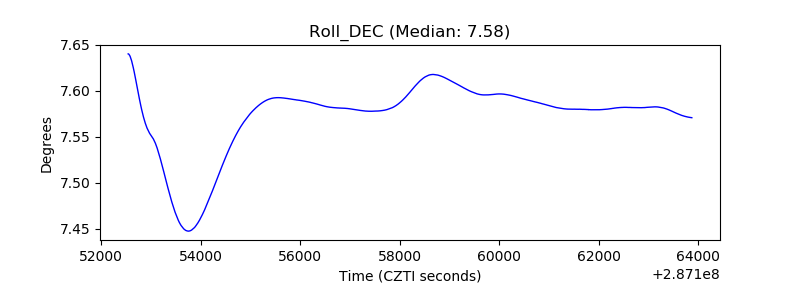 |
| _Roll_RA | 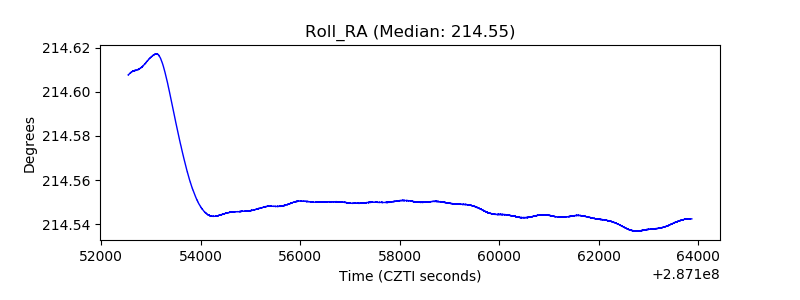 |
| Veto Counter | 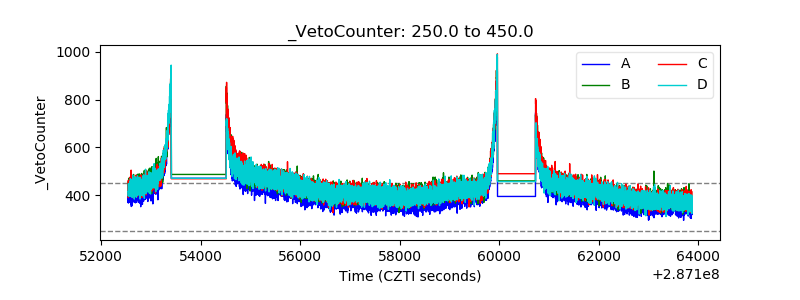 |