| Param | Original file | Final file |
|---|---|---|
| Filename | modeM0/AS1A05_176T05_9000002706_18167cztM0_level2.evt | modeM0/AS1A05_176T05_9000002706_18167cztM0_level2_quad_clean.evt |
| Size (bytes) | 225,933,120 | 26,219,520 |
| Size | 215.5 MB | 25.0 MB |
| Events in quadrant A | 1,404,027 | 153,309 |
| Events in quadrant B | 1,438,821 | 156,424 |
| Events in quadrant C | 1,549,137 | 151,803 |
| Events in quadrant D | 2,274,596 | 148,059 |
| Mode SS | |||
|---|---|---|---|
| Quadrant | BADHDUFLAG | Total packets | Discarded packets |
| A | 0 | 54 | 0 |
| B | 0 | 54 | 0 |
| C | 0 | 54 | 0 |
| D | 0 | 54 | 0 |
| Mode M9 | |||
|---|---|---|---|
| Quadrant | BADHDUFLAG | Total packets | Discarded packets |
| A | 0 | 11 | 0 |
| B | 0 | 11 | 0 |
| C | 0 | 11 | 0 |
| D | 0 | 11 | 0 |
| Mode M0 | |||
|---|---|---|---|
| Quadrant | BADHDUFLAG | Total packets | Discarded packets |
| A | 0 | 5605 | 1 |
| B | 0 | 5750 | 1 |
| C | 0 | 6103 | 1 |
| D | 0 | 8508 | 1 |
| Quadrant | Total seconds | Saturated seconds | Saturation percentage |
|---|---|---|---|
| A | 2558 | 127 | 4.964816% |
| B | 2558 | 117 | 4.573886% |
| C | 2558 | 171 | 6.684910% |
| D | 2558 | 246 | 9.616888% |
Noise dominated data is calculated using 1-second bins in cleaned event files. If a bin has >2000 counts, and if more than 50% of those come from <1% of pixels, then it is considered to be noise-dominated and hence unusable.
| Quadrant | # 1 sec bins | Bins with >0 counts | Bins with >2000 counts | High rate bins dominated by noise | Noise dominated (total time) | Noise dominated (detector-on time) | Marked lightcurve |
|---|---|---|---|---|---|---|---|
| A | 3663 | 2559 | 0 | 0 | 0.00% | 0.00% | 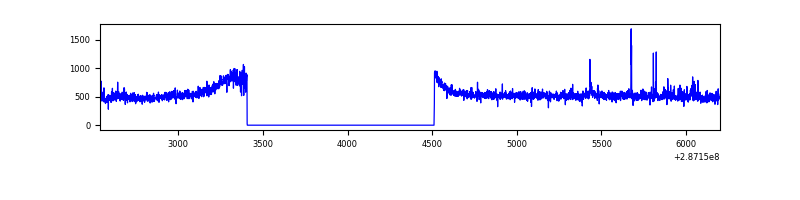 |
| B | 3663 | 2559 | 0 | 0 | 0.00% | 0.00% | 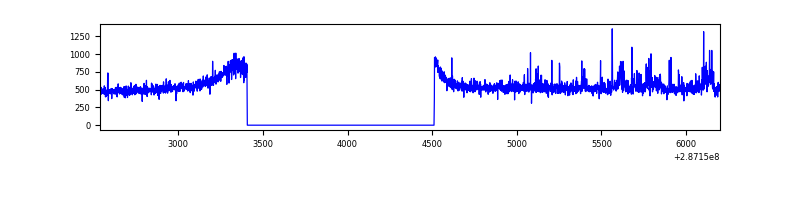 |
| C | 3663 | 2559 | 24 | 24 | 0.66% | 0.94% | 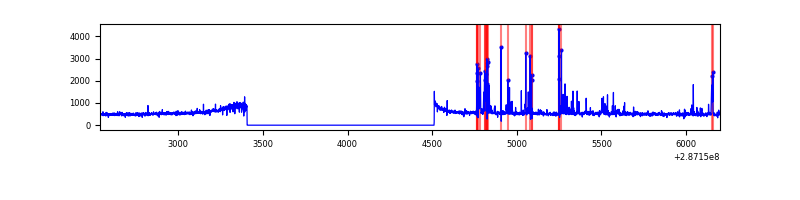 |
| D | 3663 | 2559 | 81 | 81 | 2.21% | 3.17% | 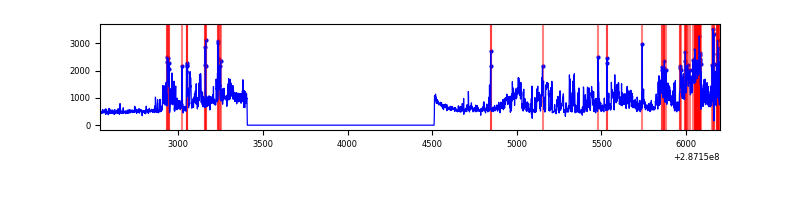 |
Top three noisy pixels from each quadrant. If the there are fewer than three noisy pixels in the level2.evt file, extra rows are filled as -1
| Pixel properties | Quadrant properties | ||||||
|---|---|---|---|---|---|---|---|
| Quadrant | DetID | PixID | Counts | Sigma | Mean | Median | Sigma |
| A | 15 | 174 | 21785 | 289.63 | 357 | 348 | 74.0 |
| A | 3 | 15 | 4853 | 60.87 | 357 | 348 | 74.0 |
| A | 4 | 2 | 4646 | 58.07 | 357 | 348 | 74.0 |
| B | 0 | 189 | 38909 | 547.96 | 351 | 341 | 70.4 |
| B | 7 | 220 | 15942 | 221.65 | 351 | 341 | 70.4 |
| B | 12 | 111 | 8048 | 109.5 | 351 | 341 | 70.4 |
| C | 4 | 254 | 170549 | 2121.82 | 339 | 340 | 80.2 |
| C | 14 | 238 | 51280 | 635.02 | 339 | 340 | 80.2 |
| C | 13 | 61 | 2425 | 25.99 | 339 | 340 | 80.2 |
| D | 7 | 238 | 779681 | 8984.69 | 346 | 334 | 86.7 |
| D | 13 | 168 | 95065 | 1092.11 | 346 | 334 | 86.7 |
| D | 9 | 64 | 60390 | 692.35 | 346 | 334 | 86.7 |
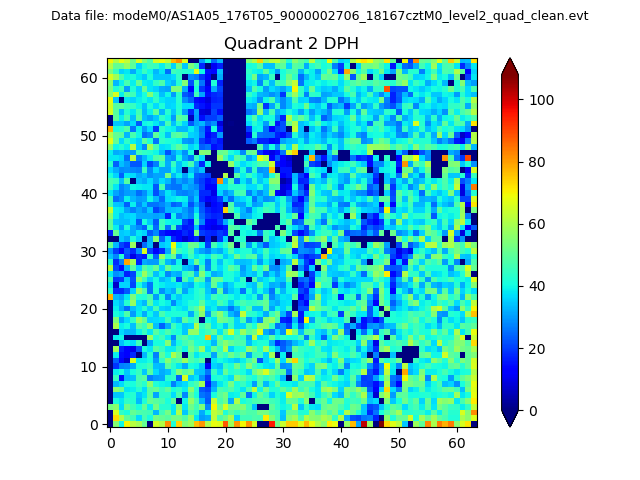
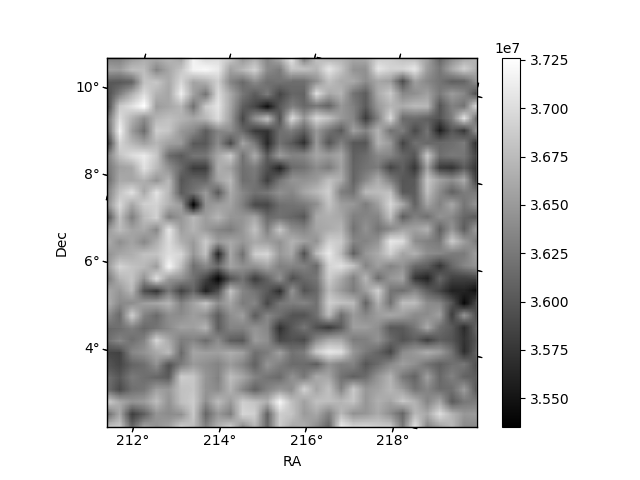
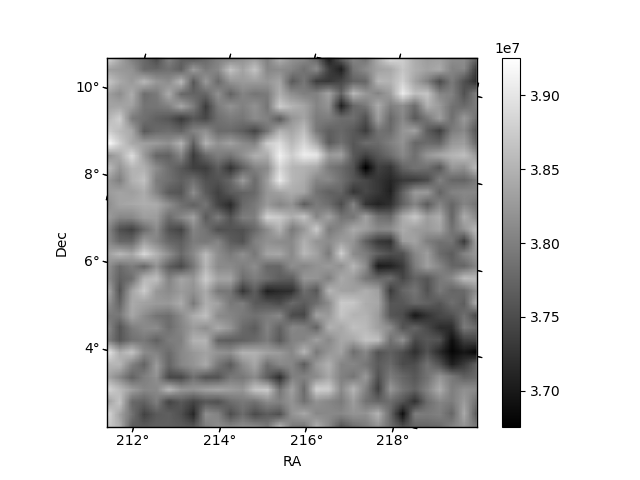
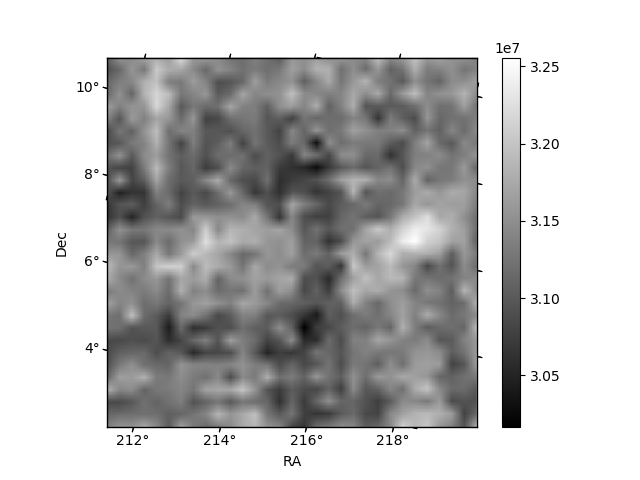
Histogram calculated using DETX and DETY for each event in the final _common_clean file
| Quadrant A | 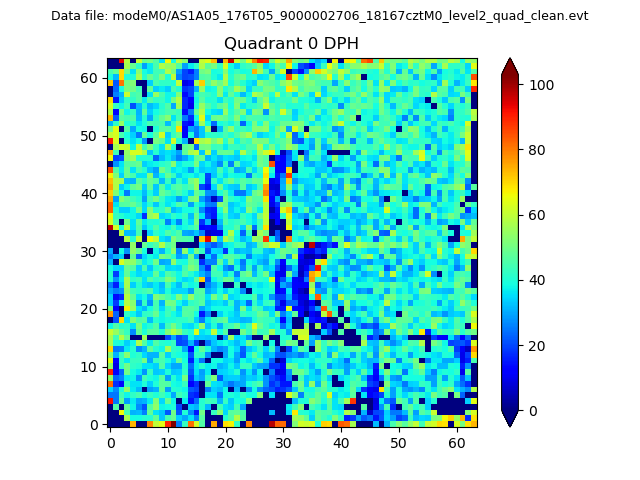 |
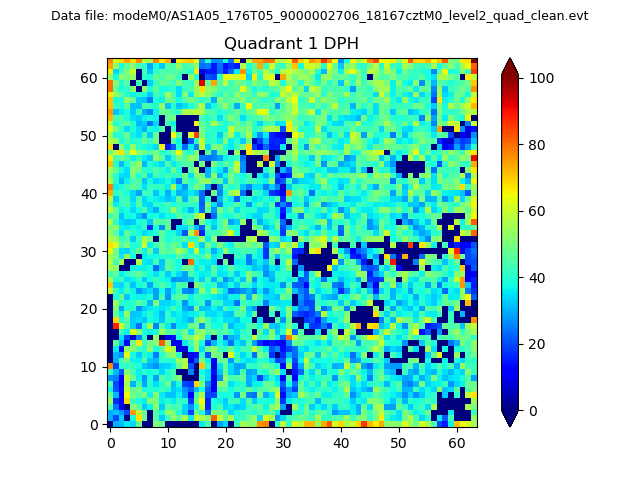 |
Quadrant B |
|---|---|---|---|
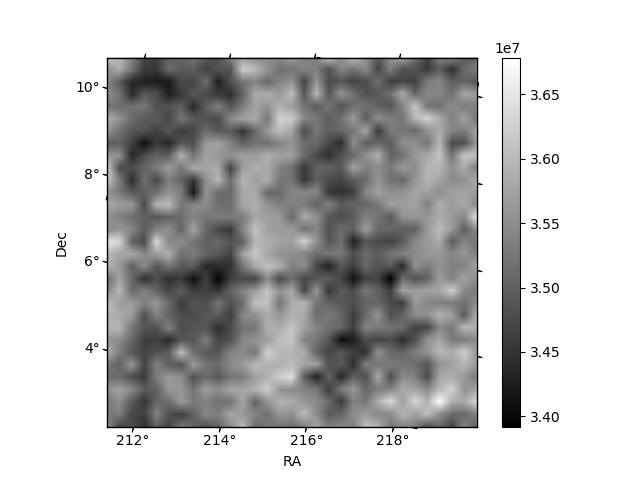
| Quadrant D | 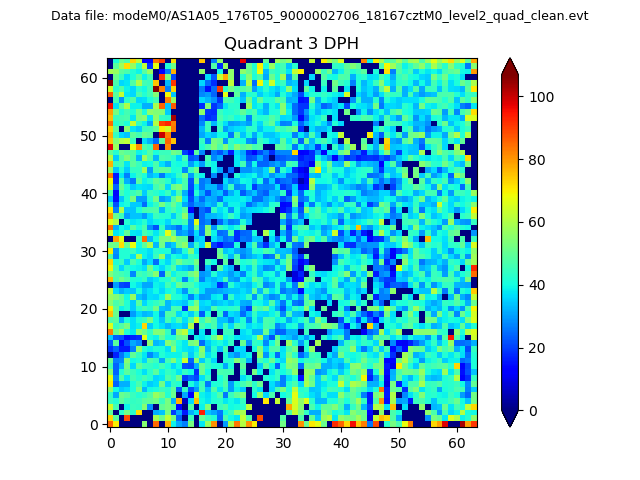 |
 |
Quadrant C |
| Plot type | Count rate plots | Images |
|---|---|---|
| Comparison with Poisson distribution Blue bars denote a histogram of data divided into 1 sec bins. Red curve is a Poisson curve with rate = median count rate of data. |
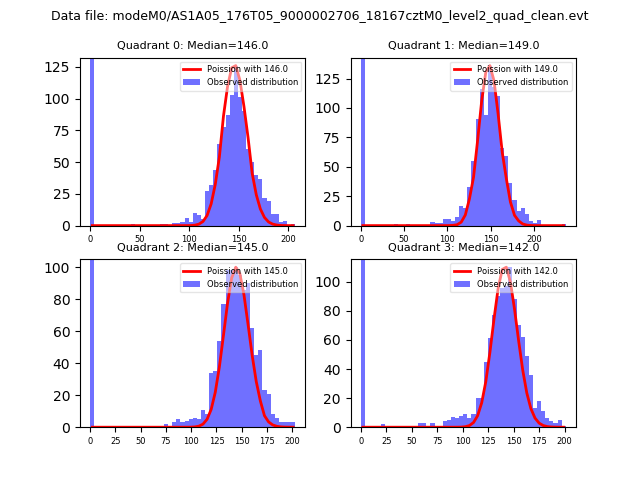 |
 |
| Quadrant-wise count rates Data is divided into 100 sec bins |
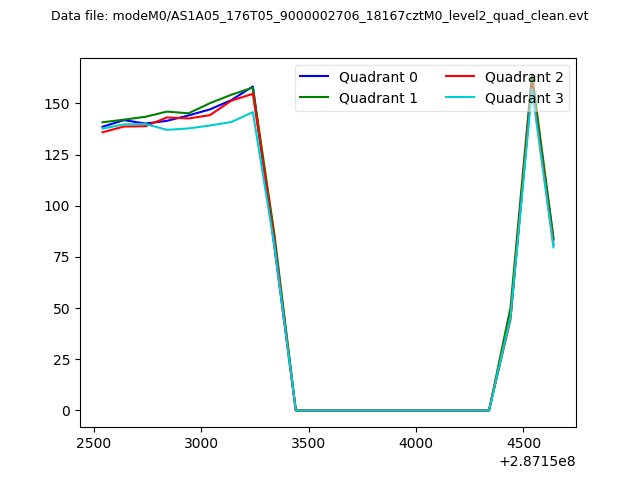 |
|
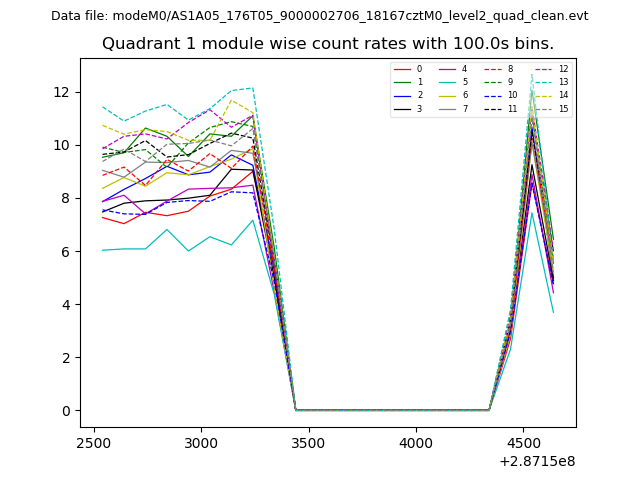
| Module-wise count rates for Quadrant A Data is divided into 100 sec bins |
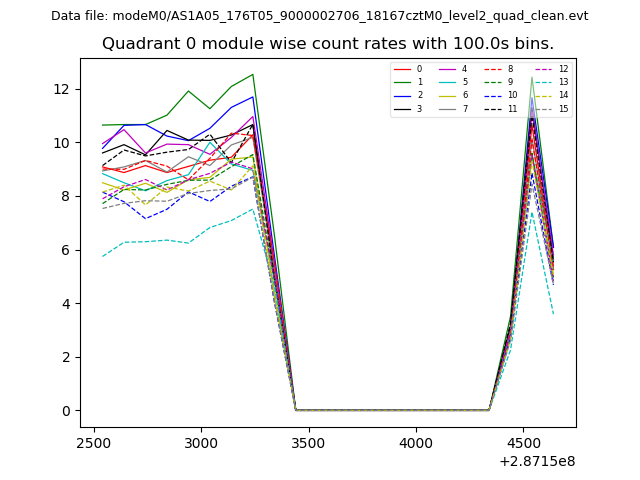 |
 |
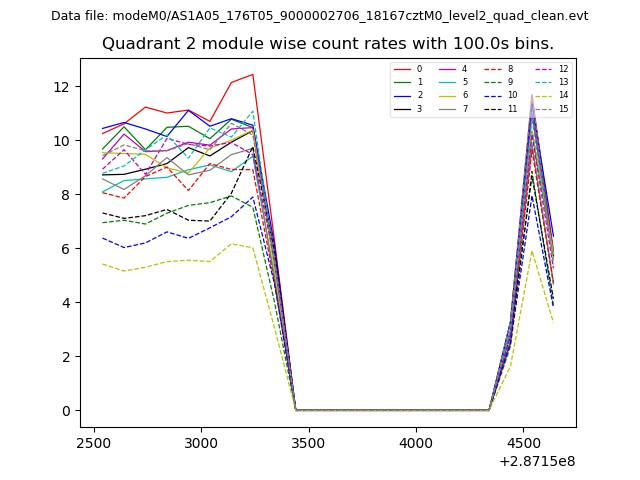
| Module-wise count rates for Quadrant B Data is divided into 100 sec bins |
 |
 |
| Module-wise count rates for Quadrant C Data is divided into 100 sec bins |
 |
 |
| Module-wise count rates for Quadrant D Data is divided into 100 sec bins |
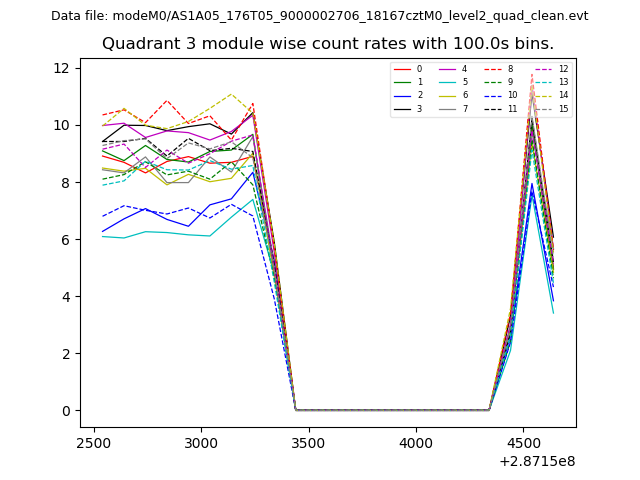 |
 |
| Parameter | Plot |
|---|---|
| CZT HV Monitor | 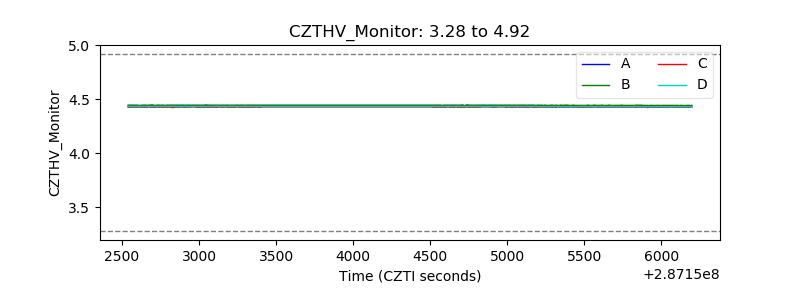 |
| D_VDD | 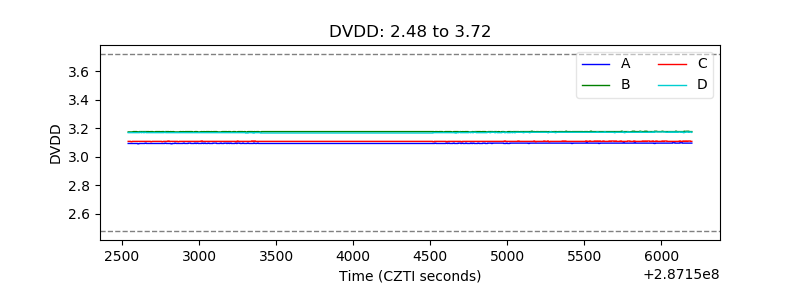 |
| Temperature 1 | 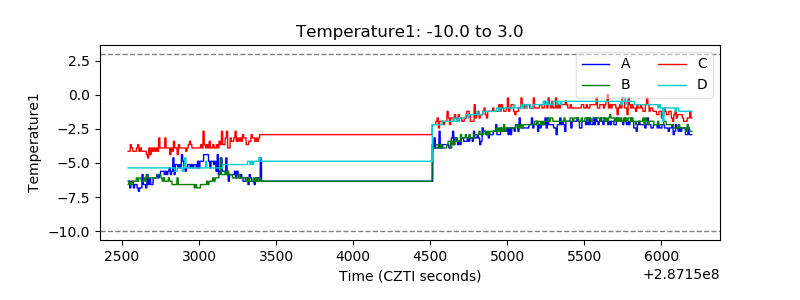 |
| Veto HV Monitor | 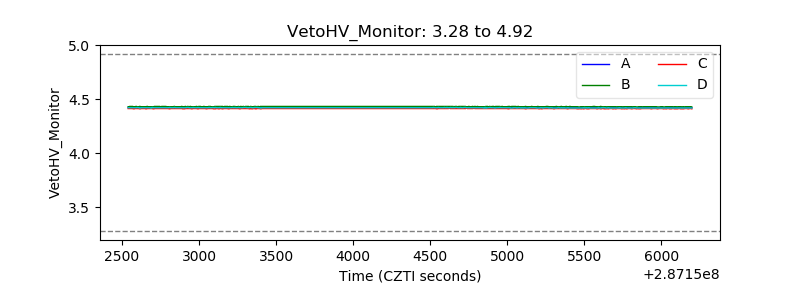 |
| Veto LLD | 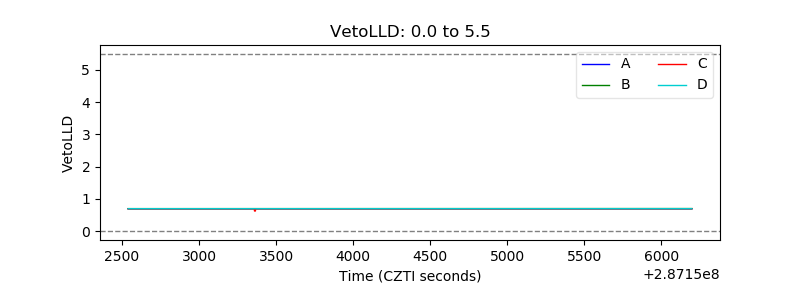 |
| Alpha Counter | 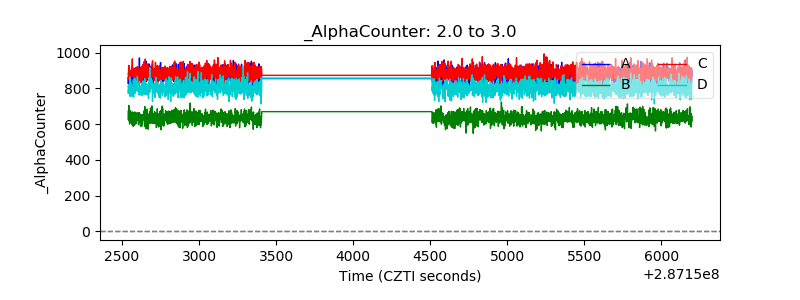 |
| _CPM_Rate | 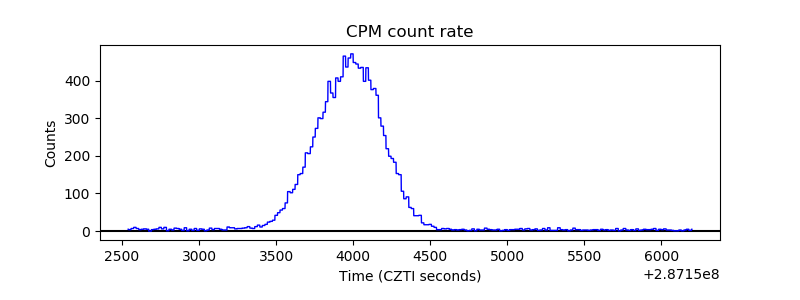 |
| CZT Counter | 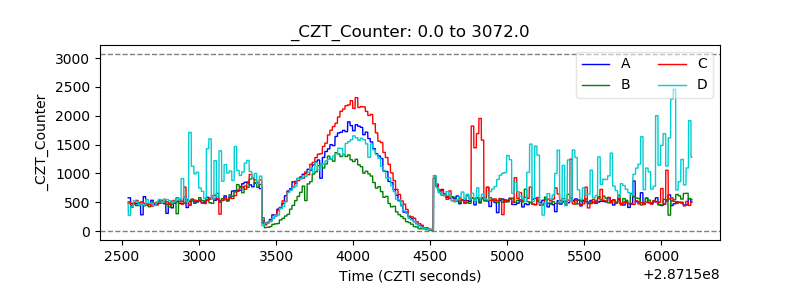 |
| +2.5 Volts monitor |  |
| +5 Volts monitor |  |
| _ROLL_ROT | 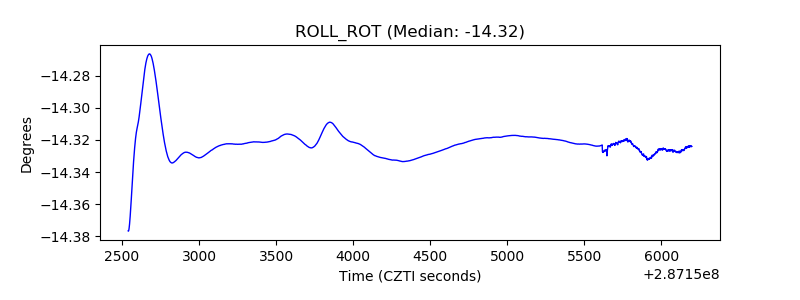 |
| _Roll_DEC |  |
| _Roll_RA |  |
| Veto Counter | 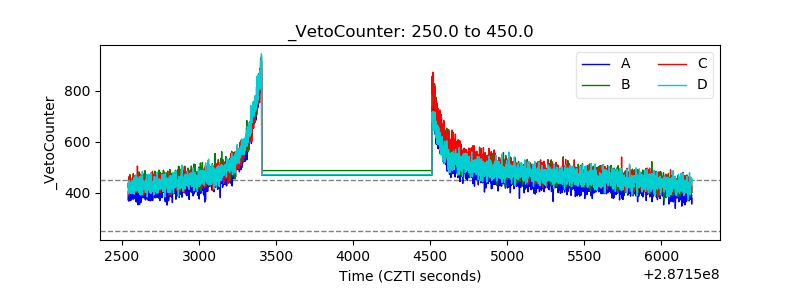 |