| Param | Original file | Final file |
|---|---|---|
| Filename | modeM0/AS1A05_160T02_9000002710cztM0_level2.fits | modeM0/AS1A05_160T02_9000002710cztM0_level2_quad_clean.evt |
| Size (bytes) | 969,016,320 | 856,831,680 |
| Size | 924.1 MB | 817.1 MB |
| Events in quadrant A | 6,031,040 | 5,008,307 |
| Events in quadrant B | 5,717,064 | 5,013,086 |
| Events in quadrant C | 5,766,204 | 4,766,450 |
| Events in quadrant D | 5,063,816 | 4,395,327 |
| Mode SS | |||
|---|---|---|---|
| Quadrant | BADHDUFLAG | Total packets | Discarded packets |
| A | 0 | 2022 | 0 |
| B | 0 | 2034 | 0 |
| C | 0 | 2028 | 0 |
| D | 0 | 2022 | 0 |
| Mode M9 | |||
|---|---|---|---|
| Quadrant | BADHDUFLAG | Total packets | Discarded packets |
| A | 0 | 144 | 0 |
| B | 0 | 146 | 0 |
| C | 0 | 145 | 0 |
| D | 0 | 146 | 0 |
| Mode M0 | |||
|---|---|---|---|
| Quadrant | BADHDUFLAG | Total packets | Discarded packets |
| A | 0 | 207724 | 0 |
| B | 0 | 211311 | 0 |
| C | 0 | 230274 | 0 |
| D | 0 | 256403 | 0 |
| Quadrant | Total seconds | Saturated seconds | Saturation percentage |
|---|---|---|---|
| A | 98765 | 1386 | 1.403331% |
| B | 98792 | 1695 | 1.715726% |
| C | 98528 | 3820 | 3.877070% |
| D | 98478 | 3649 | 3.705396% |
Noise dominated data is calculated using 1-second bins in cleaned event files. If a bin has >2000 counts, and if more than 50% of those come from <1% of pixels, then it is considered to be noise-dominated and hence unusable.
| Quadrant | # 1 sec bins | Bins with >0 counts | Bins with >2000 counts | High rate bins dominated by noise | Noise dominated (total time) | Noise dominated (detector-on time) | Marked lightcurve |
|---|---|---|---|---|---|---|---|
| A | 115813 | 99795 | 0 | 0 | 0.00% | 0.00% |  |
| B | 115813 | 99770 | 0 | 0 | 0.00% | 0.00% |  |
| C | 115813 | 99537 | 0 | 0 | 0.00% | 0.00% |  |
| D | 115813 | 99493 | 0 | 0 | 0.00% | 0.00% |  |
Top three noisy pixels from each quadrant. If the there are fewer than three noisy pixels in the level2.evt file, extra rows are filled as -1
| Pixel properties | Quadrant properties | ||||||
|---|---|---|---|---|---|---|---|
| Quadrant | DetID | PixID | Counts | Sigma | Mean | Median | Sigma |
| A | 0 | 29 | 5763 | 11.14 | 1570 | 1470 | 385.3 |
| A | 7 | 110 | 4991 | 9.14 | 1570 | 1470 | 385.3 |
| A | 0 | 30 | 4708 | 8.4 | 1570 | 1470 | 385.3 |
| B | 2 | 9 | 4546 | 10.44 | 1513 | 1444 | 297.1 |
| B | 2 | 8 | 3876 | 8.19 | 1513 | 1444 | 297.1 |
| B | 3 | 17 | 3736 | 7.72 | 1513 | 1444 | 297.1 |
| C | 12 | 241 | 3944 | 6.5 | 1524 | 1420 | 388.5 |
| C | 3 | 126 | 3890 | 6.36 | 1524 | 1420 | 388.5 |
| C | 9 | 233 | 3762 | 6.03 | 1524 | 1420 | 388.5 |
| D | 10 | 190 | 3878 | 6.7 | 1448 | 1318 | 381.9 |
| D | 3 | 14 | 3689 | 6.21 | 1448 | 1318 | 381.9 |
| D | 7 | 3 | 3528 | 5.79 | 1448 | 1318 | 381.9 |
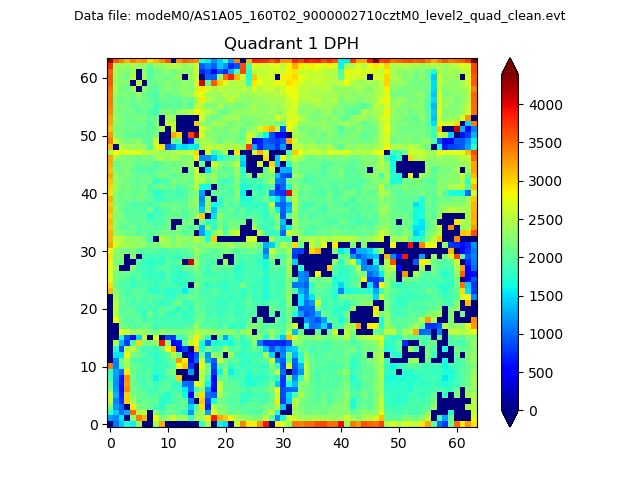
Histogram calculated using DETX and DETY for each event in the final _common_clean file
| Quadrant A |  |
 |
Quadrant B |
|---|---|---|---|
| Quadrant D | 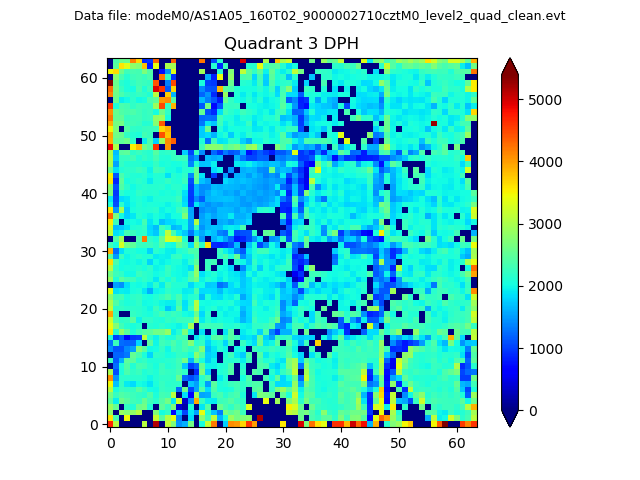 |
 |
Quadrant C |
| Plot type | Count rate plots | Images |
|---|---|---|
| Comparison with Poisson distribution Blue bars denote a histogram of data divided into 1 sec bins. Red curve is a Poisson curve with rate = median count rate of data. |
 |
 |
| Quadrant-wise count rates Data is divided into 100 sec bins |
 |
|
| Module-wise count rates for Quadrant A Data is divided into 100 sec bins |
 |
 |
| Module-wise count rates for Quadrant B Data is divided into 100 sec bins |
 |
 |
| Module-wise count rates for Quadrant C Data is divided into 100 sec bins |
 |
 |
| Module-wise count rates for Quadrant D Data is divided into 100 sec bins |
 |
 |
| Parameter | Plot |
|---|---|
| CZT HV Monitor |  |
| D_VDD |  |
| Temperature 1 |  |
| Veto HV Monitor |  |
| Veto LLD |  |
| Alpha Counter |  |
| _CPM_Rate |  |
| CZT Counter |  |
| +2.5 Volts monitor |  |
| +5 Volts monitor |  |
| _ROLL_ROT |  |
| _Roll_DEC |  |
| _Roll_RA |  |
| Veto Counter |  |