| Param | Original file | Final file |
|---|---|---|
| Filename | modeM0/AS1A05_160T02_9000002710_18181cztM0_level2.evt | modeM0/AS1A05_160T02_9000002710_18181cztM0_level2_quad_clean.evt |
| Size (bytes) | 205,611,840 | 27,207,360 |
| Size | 196.1 MB | 25.9 MB |
| Events in quadrant A | 1,456,586 | 159,627 |
| Events in quadrant B | 1,452,356 | 162,322 |
| Events in quadrant C | 1,490,893 | 157,973 |
| Events in quadrant D | 1,648,316 | 156,702 |
| Mode SS | |||
|---|---|---|---|
| Quadrant | BADHDUFLAG | Total packets | Discarded packets |
| A | 0 | 54 | 0 |
| B | 0 | 54 | 0 |
| C | 0 | 54 | 0 |
| D | 0 | 54 | 0 |
| Mode M9 | |||
|---|---|---|---|
| Quadrant | BADHDUFLAG | Total packets | Discarded packets |
| A | 0 | 12 | 0 |
| B | 0 | 12 | 0 |
| C | 0 | 12 | 0 |
| D | 0 | 12 | 0 |
| Mode M0 | |||
|---|---|---|---|
| Quadrant | BADHDUFLAG | Total packets | Discarded packets |
| A | 0 | 5856 | 2 |
| B | 0 | 5838 | 1 |
| C | 0 | 5931 | 1 |
| D | 0 | 6485 | 1 |
| Quadrant | Total seconds | Saturated seconds | Saturation percentage |
|---|---|---|---|
| A | 2603 | 118 | 4.533231% |
| B | 2603 | 105 | 4.033807% |
| C | 2603 | 131 | 5.032655% |
| D | 2603 | 137 | 5.263158% |
Noise dominated data is calculated using 1-second bins in cleaned event files. If a bin has >2000 counts, and if more than 50% of those come from <1% of pixels, then it is considered to be noise-dominated and hence unusable.
| Quadrant | # 1 sec bins | Bins with >0 counts | Bins with >2000 counts | High rate bins dominated by noise | Noise dominated (total time) | Noise dominated (detector-on time) | Marked lightcurve |
|---|---|---|---|---|---|---|---|
| A | 3848 | 2604 | 1 | 1 | 0.03% | 0.04% | 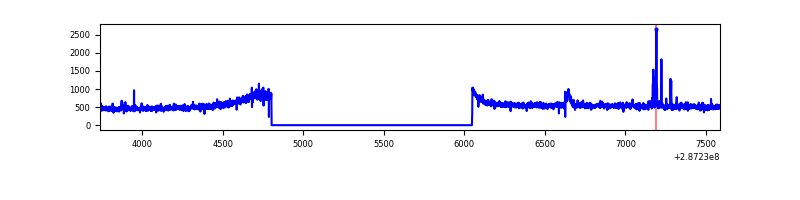 |
| B | 3848 | 2604 | 0 | 0 | 0.00% | 0.00% | 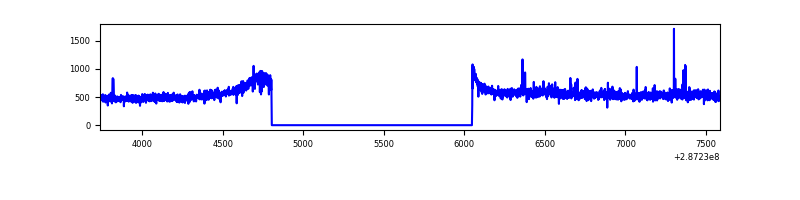 |
| C | 3848 | 2604 | 2 | 2 | 0.05% | 0.08% | 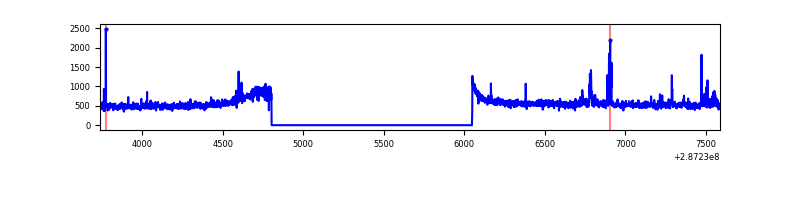 |
| D | 3848 | 2604 | 31 | 31 | 0.81% | 1.19% | 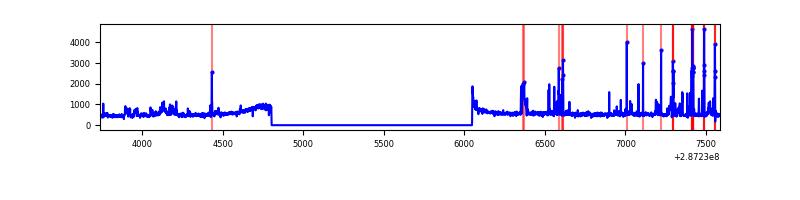 |
Top three noisy pixels from each quadrant. If the there are fewer than three noisy pixels in the level2.evt file, extra rows are filled as -1
| Pixel properties | Quadrant properties | ||||||
|---|---|---|---|---|---|---|---|
| Quadrant | DetID | PixID | Counts | Sigma | Mean | Median | Sigma |
| A | 15 | 174 | 32587 | 424.45 | 369 | 361 | 75.9 |
| A | 4 | 2 | 4117 | 49.47 | 369 | 361 | 75.9 |
| A | 0 | 226 | 3301 | 38.72 | 369 | 361 | 75.9 |
| B | 7 | 220 | 9645 | 130.37 | 363 | 354 | 71.3 |
| B | 12 | 111 | 8209 | 110.22 | 363 | 354 | 71.3 |
| B | 0 | 189 | 7042 | 93.84 | 363 | 354 | 71.3 |
| C | 4 | 254 | 59665 | 706.86 | 352 | 353 | 83.9 |
| C | 14 | 238 | 54190 | 641.61 | 352 | 353 | 83.9 |
| C | 1 | 16 | 4321 | 47.29 | 352 | 353 | 83.9 |
| D | 7 | 238 | 227366 | 2527.81 | 359 | 348 | 89.8 |
| D | 10 | 70 | 19045 | 208.19 | 359 | 348 | 89.8 |
| D | 9 | 64 | 12423 | 134.45 | 359 | 348 | 89.8 |
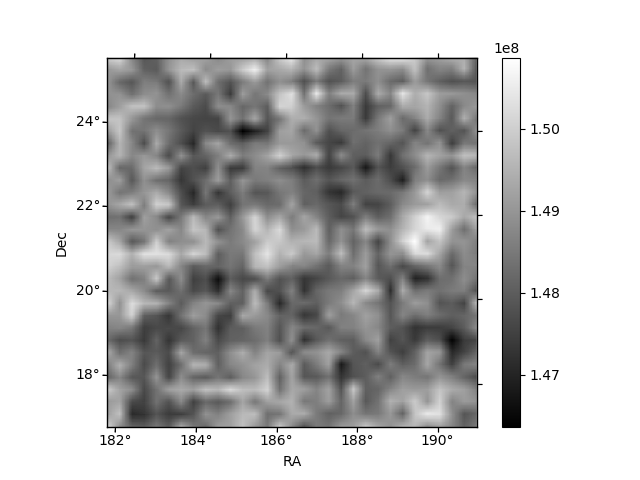
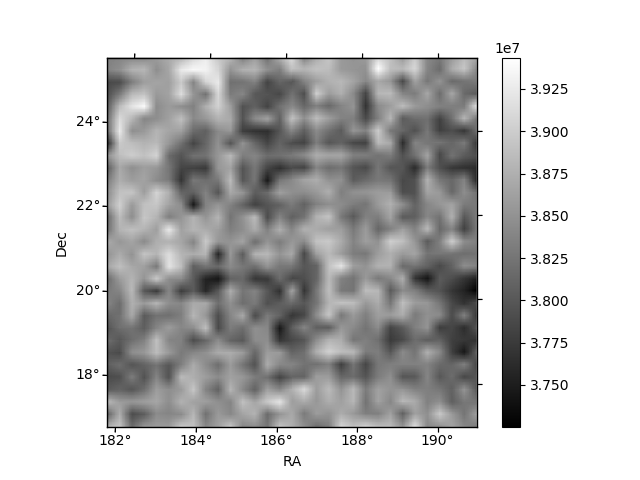
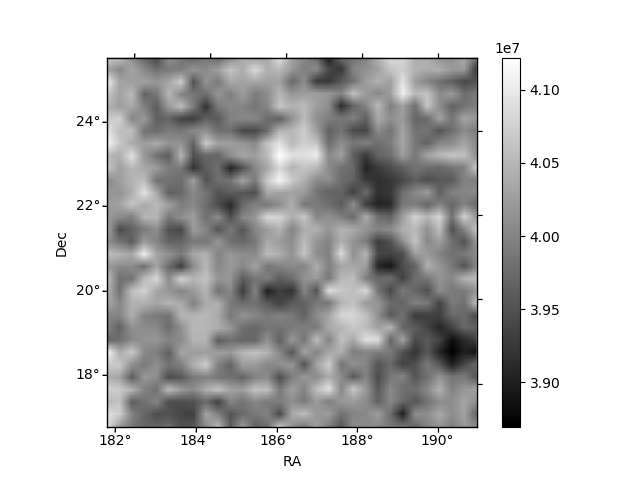
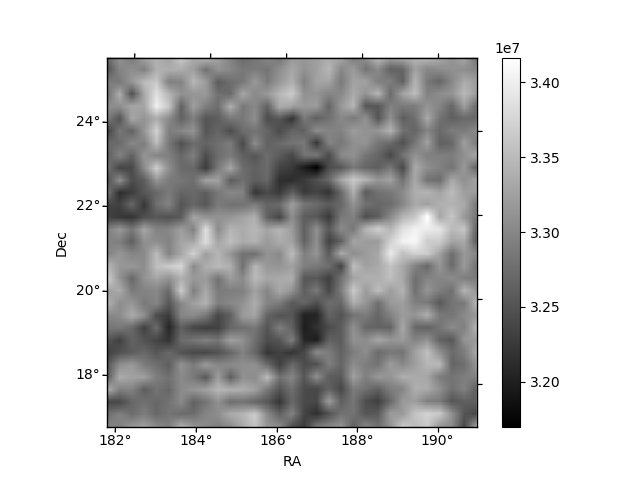
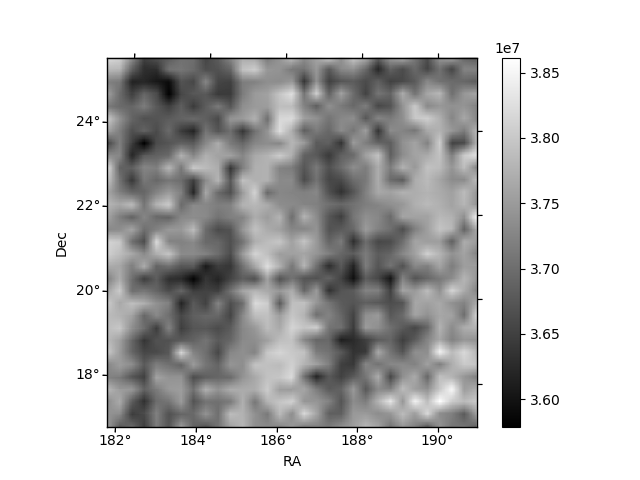
Histogram calculated using DETX and DETY for each event in the final _common_clean file
| Quadrant A | 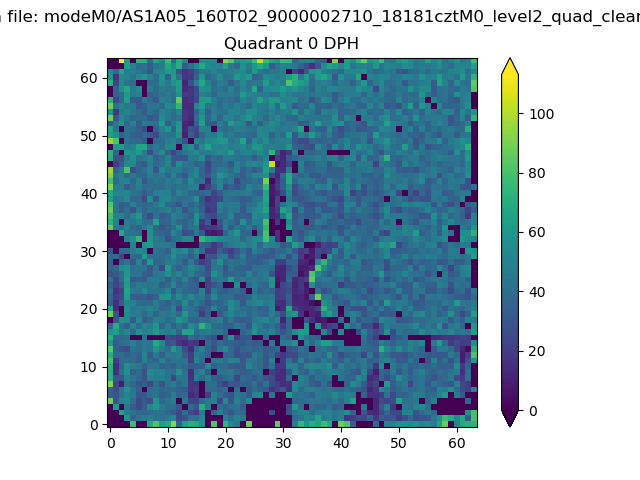 |
 |
Quadrant B |
|---|---|---|---|
| Quadrant D | 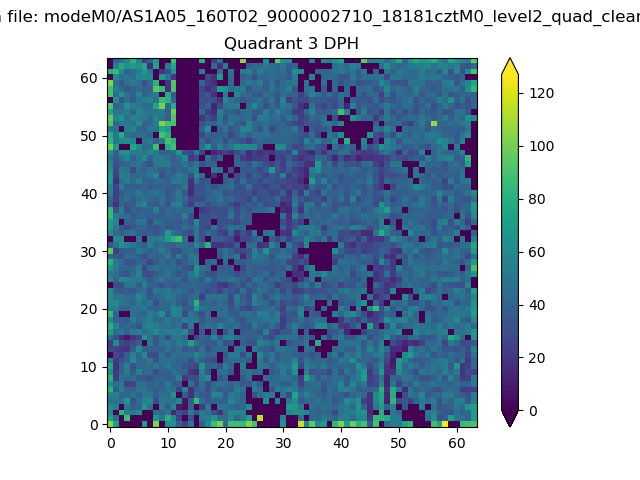 |
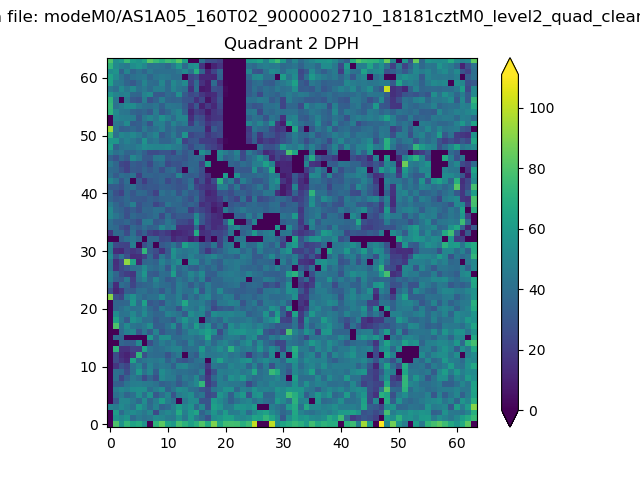 |
Quadrant C |
| Plot type | Count rate plots | Images |
|---|---|---|
| Comparison with Poisson distribution Blue bars denote a histogram of data divided into 1 sec bins. Red curve is a Poisson curve with rate = median count rate of data. |
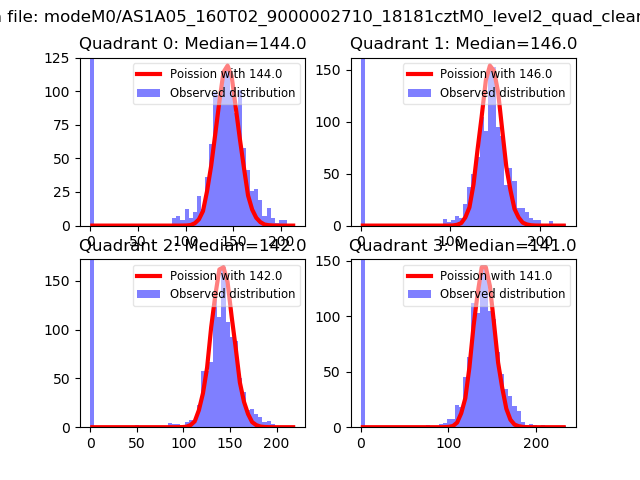 |
 |
| Quadrant-wise count rates Data is divided into 100 sec bins |
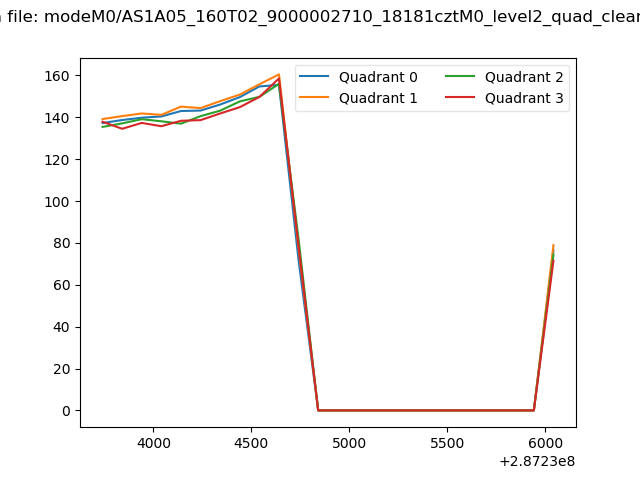 |
|
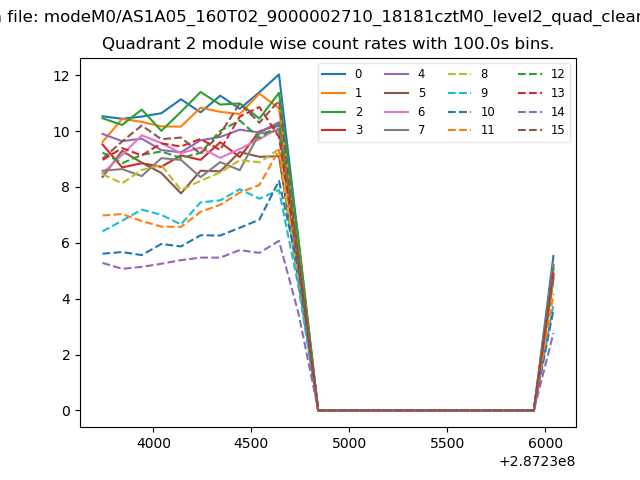
| Module-wise count rates for Quadrant A Data is divided into 100 sec bins |
 |
 |
| Module-wise count rates for Quadrant B Data is divided into 100 sec bins |
 |
 |
| Module-wise count rates for Quadrant C Data is divided into 100 sec bins |
 |
 |
| Module-wise count rates for Quadrant D Data is divided into 100 sec bins |
 |
 |
| Parameter | Plot |
|---|---|
| CZT HV Monitor | 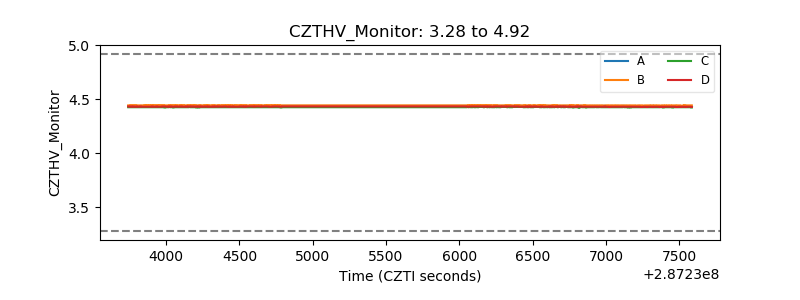 |
| D_VDD | 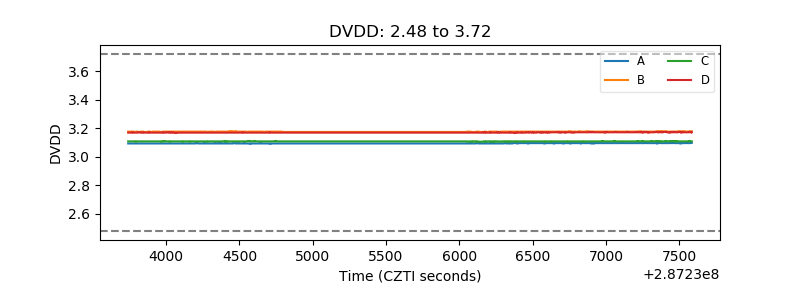 |
| Temperature 1 |  |
| Veto HV Monitor | 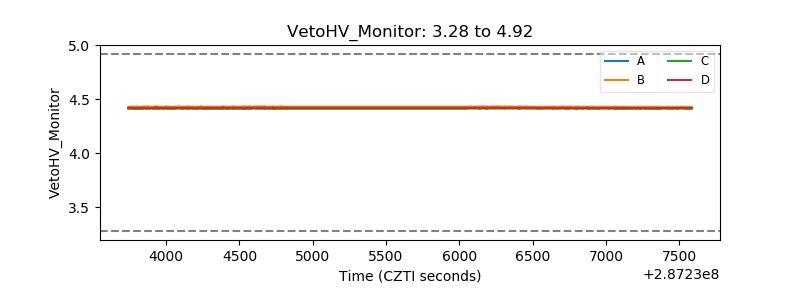 |
| Veto LLD | 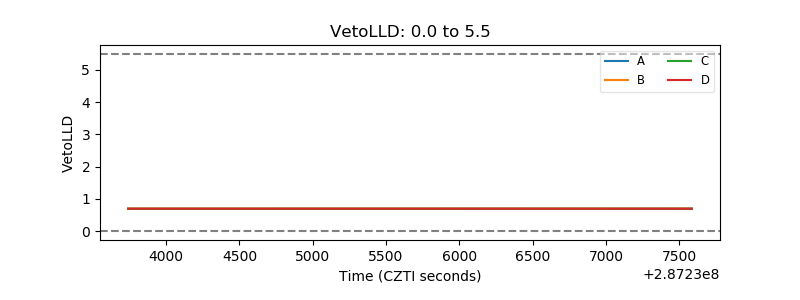 |
| Alpha Counter | 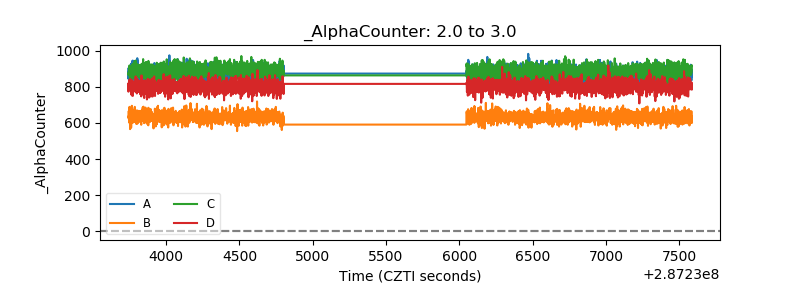 |
| _CPM_Rate | 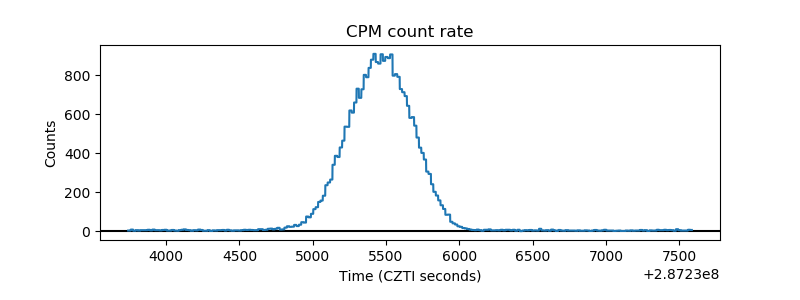 |
| CZT Counter | 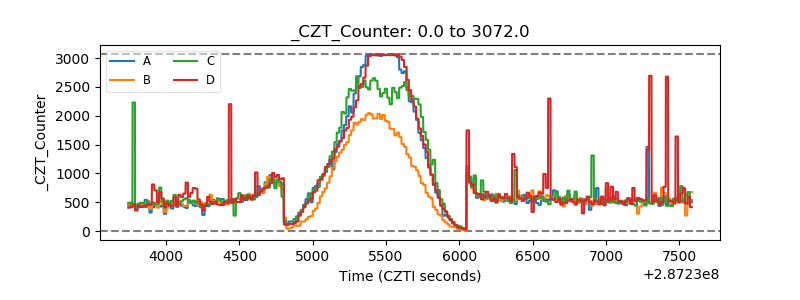 |
| +2.5 Volts monitor |  |
| +5 Volts monitor |  |
| _ROLL_ROT | 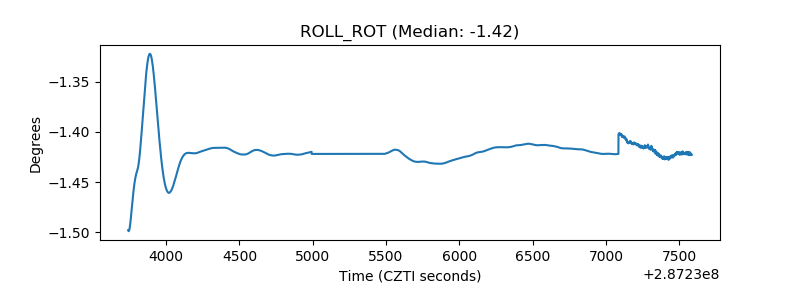 |
| _Roll_DEC | 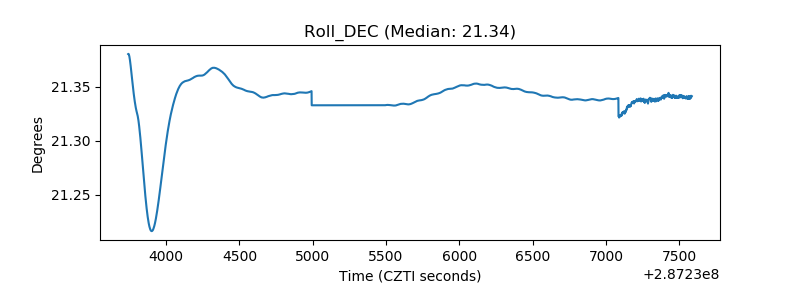 |
| _Roll_RA | 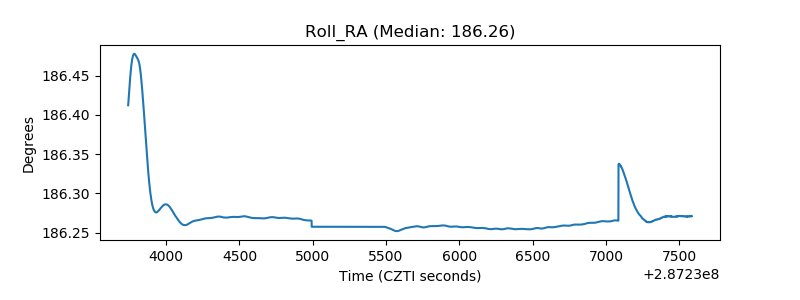 |
| Veto Counter | 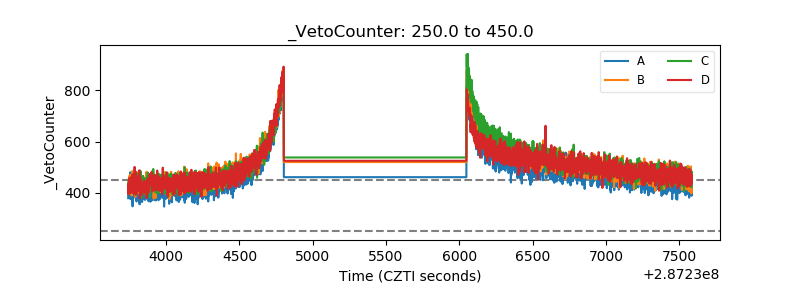 |