| Param | Original file | Final file |
|---|---|---|
| Filename | modeM0/AS1A05_160T02_9000002710_18182cztM0_level2.evt | modeM0/AS1A05_160T02_9000002710_18182cztM0_level2_quad_clean.evt |
| Size (bytes) | 510,670,080 | 69,511,680 |
| Size | 487.0 MB | 66.3 MB |
| Events in quadrant A | 3,484,962 | 416,783 |
| Events in quadrant B | 3,542,810 | 419,644 |
| Events in quadrant C | 3,772,220 | 407,619 |
| Events in quadrant D | 4,208,121 | 390,703 |
| Mode SS | |||
|---|---|---|---|
| Quadrant | BADHDUFLAG | Total packets | Discarded packets |
| A | 0 | 138 | 0 |
| B | 0 | 138 | 0 |
| C | 0 | 138 | 0 |
| D | 0 | 138 | 0 |
| Mode M9 | |||
|---|---|---|---|
| Quadrant | BADHDUFLAG | Total packets | Discarded packets |
| A | 0 | 13 | 0 |
| B | 0 | 13 | 0 |
| C | 0 | 13 | 0 |
| D | 0 | 14 | 0 |
| Mode M0 | |||
|---|---|---|---|
| Quadrant | BADHDUFLAG | Total packets | Discarded packets |
| A | 0 | 14395 | 4 |
| B | 0 | 14525 | 3 |
| C | 0 | 15290 | 3 |
| D | 0 | 16843 | 3 |
| Quadrant | Total seconds | Saturated seconds | Saturation percentage |
|---|---|---|---|
| A | 6736 | 91 | 1.350950% |
| B | 6736 | 110 | 1.633017% |
| C | 6736 | 178 | 2.642518% |
| D | 6736 | 319 | 4.735748% |
Noise dominated data is calculated using 1-second bins in cleaned event files. If a bin has >2000 counts, and if more than 50% of those come from <1% of pixels, then it is considered to be noise-dominated and hence unusable.
| Quadrant | # 1 sec bins | Bins with >0 counts | Bins with >2000 counts | High rate bins dominated by noise | Noise dominated (total time) | Noise dominated (detector-on time) | Marked lightcurve |
|---|---|---|---|---|---|---|---|
| A | 7726 | 6738 | 3 | 3 | 0.04% | 0.04% | 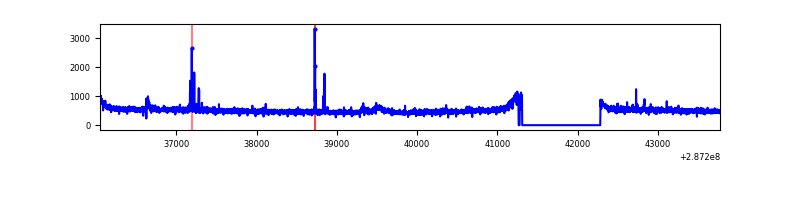 |
| B | 7726 | 6738 | 10 | 10 | 0.13% | 0.15% | 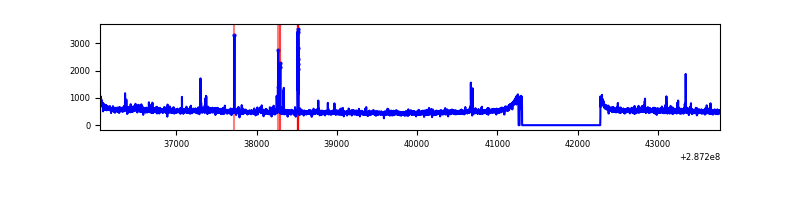 |
| C | 7726 | 6738 | 20 | 20 | 0.26% | 0.30% | 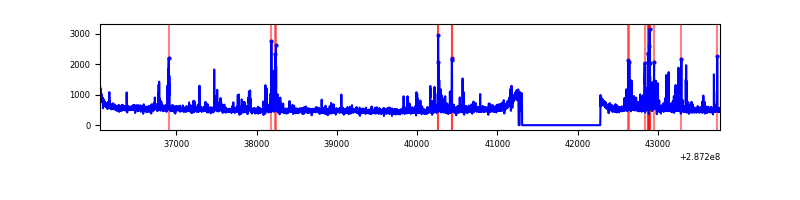 |
| D | 7726 | 6738 | 211 | 211 | 2.73% | 3.13% | 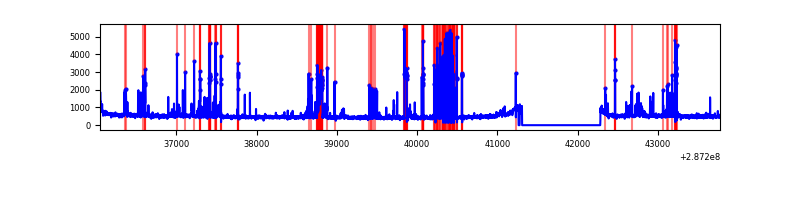 |
Top three noisy pixels from each quadrant. If the there are fewer than three noisy pixels in the level2.evt file, extra rows are filled as -1
| Pixel properties | Quadrant properties | ||||||
|---|---|---|---|---|---|---|---|
| Quadrant | DetID | PixID | Counts | Sigma | Mean | Median | Sigma |
| A | 15 | 174 | 93449 | 521.64 | 880 | 862 | 177.5 |
| A | 4 | 2 | 9492 | 48.62 | 880 | 862 | 177.5 |
| A | 0 | 226 | 7884 | 39.56 | 880 | 862 | 177.5 |
| B | 7 | 220 | 70642 | 419.71 | 872 | 853 | 166.3 |
| B | 0 | 189 | 21068 | 121.57 | 872 | 853 | 166.3 |
| B | 12 | 111 | 19422 | 111.67 | 872 | 853 | 166.3 |
| C | 4 | 254 | 358054 | 1823.85 | 840 | 847 | 195.9 |
| C | 14 | 238 | 130686 | 662.94 | 840 | 847 | 195.9 |
| C | 13 | 61 | 5797 | 25.27 | 840 | 847 | 195.9 |
| D | 7 | 238 | 659596 | 3177.48 | 847 | 824 | 207.3 |
| D | 9 | 64 | 173539 | 833.06 | 847 | 824 | 207.3 |
| D | 10 | 70 | 73306 | 349.61 | 847 | 824 | 207.3 |
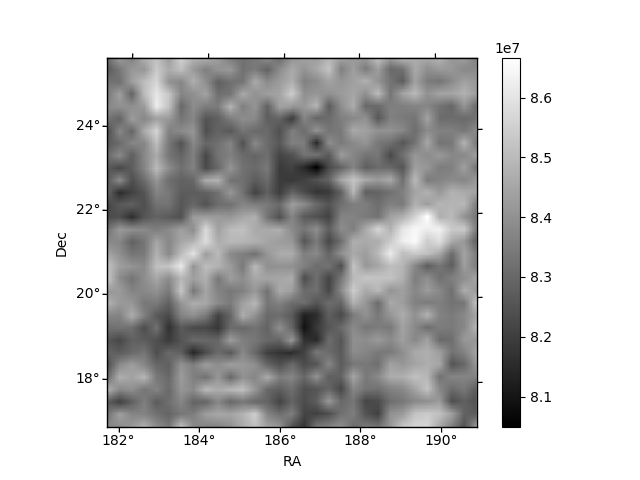
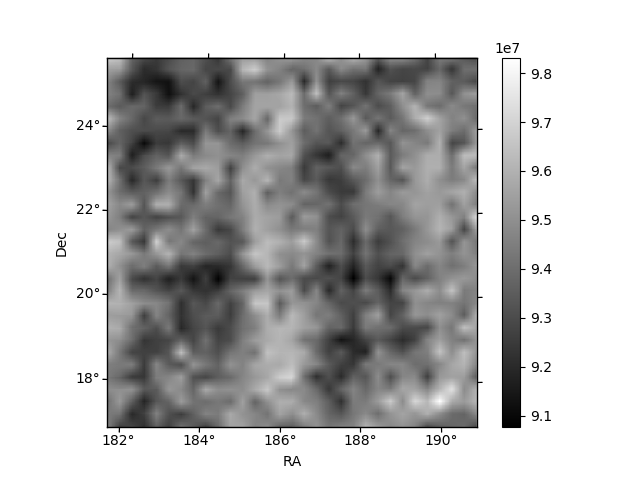
Histogram calculated using DETX and DETY for each event in the final _common_clean file
| Quadrant A |  |
 |
Quadrant B |
|---|---|---|---|
| Quadrant D |  |
 |
Quadrant C |
| Plot type | Count rate plots | Images |
|---|---|---|
| Comparison with Poisson distribution Blue bars denote a histogram of data divided into 1 sec bins. Red curve is a Poisson curve with rate = median count rate of data. |
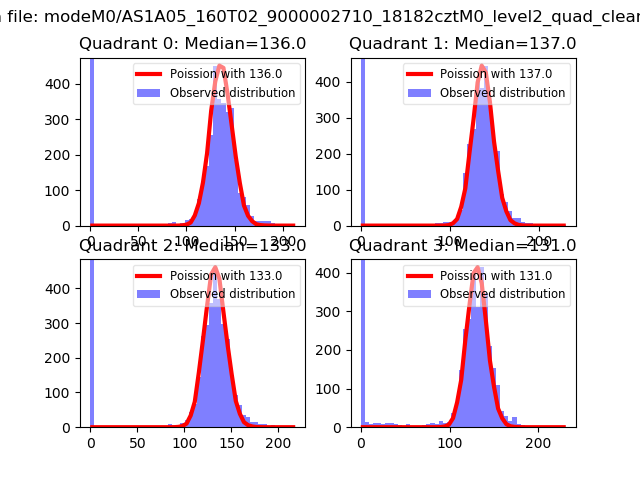 |
 |
| Quadrant-wise count rates Data is divided into 100 sec bins |
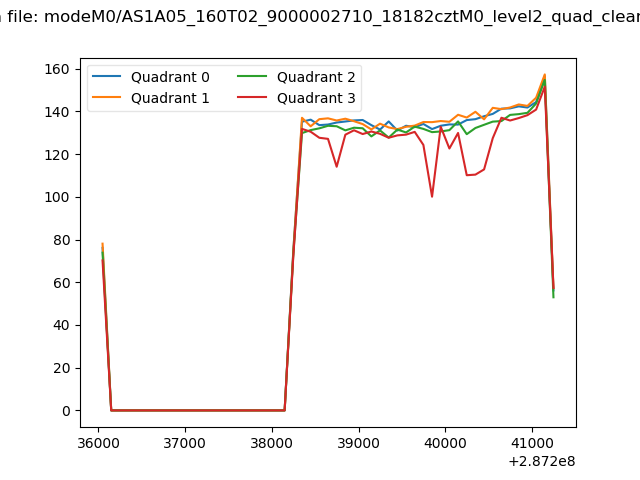 |
|
| Module-wise count rates for Quadrant A Data is divided into 100 sec bins |
 |
 |
| Module-wise count rates for Quadrant B Data is divided into 100 sec bins |
 |
 |
| Module-wise count rates for Quadrant C Data is divided into 100 sec bins |
 |
 |
| Module-wise count rates for Quadrant D Data is divided into 100 sec bins |
 |
 |
| Parameter | Plot |
|---|---|
| CZT HV Monitor |  |
| D_VDD | 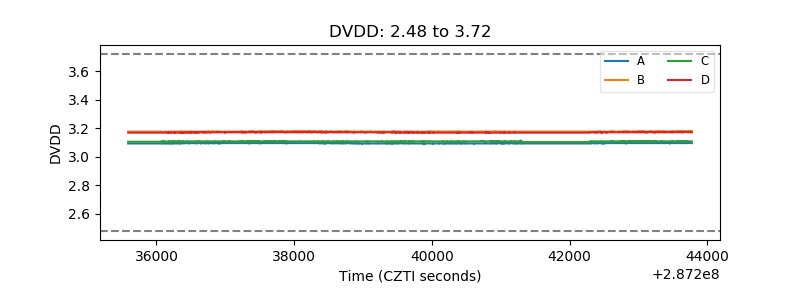 |
| Temperature 1 |  |
| Veto HV Monitor |  |
| Veto LLD |  |
| Alpha Counter |  |
| _CPM_Rate | 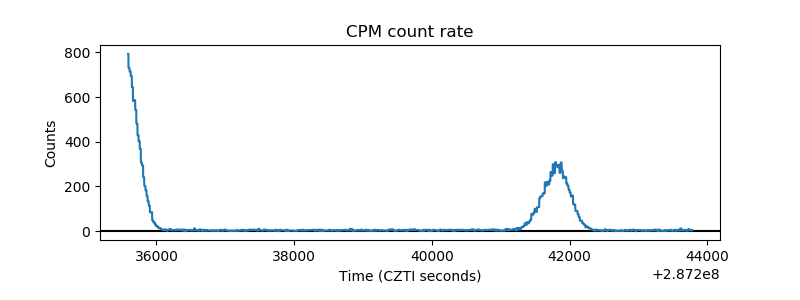 |
| CZT Counter |  |
| +2.5 Volts monitor |  |
| +5 Volts monitor |  |
| _ROLL_ROT |  |
| _Roll_DEC |  |
| _Roll_RA |  |
| Veto Counter |  |