| Param | Original file | Final file |
|---|---|---|
| Filename | modeM0/AS1A05_160T02_9000002710_18183cztM0_level2.evt | modeM0/AS1A05_160T02_9000002710_18183cztM0_level2_quad_clean.evt |
| Size (bytes) | 520,306,560 | 78,456,960 |
| Size | 496.2 MB | 74.8 MB |
| Events in quadrant A | 3,540,752 | 475,328 |
| Events in quadrant B | 3,703,450 | 478,038 |
| Events in quadrant C | 4,050,659 | 464,444 |
| Events in quadrant D | 3,976,432 | 459,162 |
| Mode SS | |||
|---|---|---|---|
| Quadrant | BADHDUFLAG | Total packets | Discarded packets |
| A | 0 | 148 | 0 |
| B | 0 | 148 | 0 |
| C | 0 | 148 | 0 |
| D | 0 | 148 | 0 |
| Mode M9 | |||
|---|---|---|---|
| Quadrant | BADHDUFLAG | Total packets | Discarded packets |
| A | 0 | 8 | 0 |
| B | 0 | 9 | 0 |
| C | 0 | 9 | 0 |
| D | 0 | 9 | 0 |
| Mode M0 | |||
|---|---|---|---|
| Quadrant | BADHDUFLAG | Total packets | Discarded packets |
| A | 0 | 14985 | 2 |
| B | 0 | 15428 | 2 |
| C | 0 | 16525 | 2 |
| D | 0 | 16479 | 2 |
| Quadrant | Total seconds | Saturated seconds | Saturation percentage |
|---|---|---|---|
| A | 7152 | 97 | 1.356264% |
| B | 7152 | 130 | 1.817673% |
| C | 7152 | 217 | 3.034116% |
| D | 7152 | 165 | 2.307047% |
Noise dominated data is calculated using 1-second bins in cleaned event files. If a bin has >2000 counts, and if more than 50% of those come from <1% of pixels, then it is considered to be noise-dominated and hence unusable.
| Quadrant | # 1 sec bins | Bins with >0 counts | Bins with >2000 counts | High rate bins dominated by noise | Noise dominated (total time) | Noise dominated (detector-on time) | Marked lightcurve |
|---|---|---|---|---|---|---|---|
| A | 7722 | 7153 | 2 | 2 | 0.03% | 0.03% | 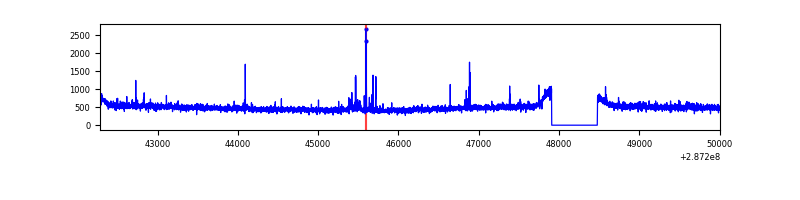 |
| B | 7722 | 7153 | 18 | 18 | 0.23% | 0.25% | 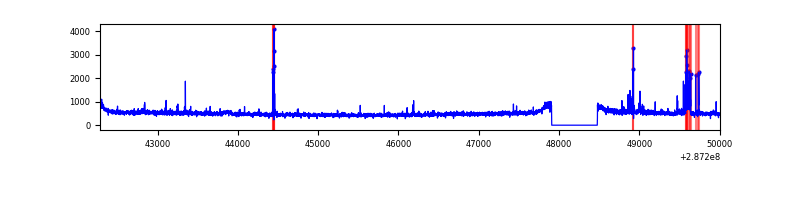 |
| C | 7722 | 7153 | 54 | 54 | 0.70% | 0.75% | 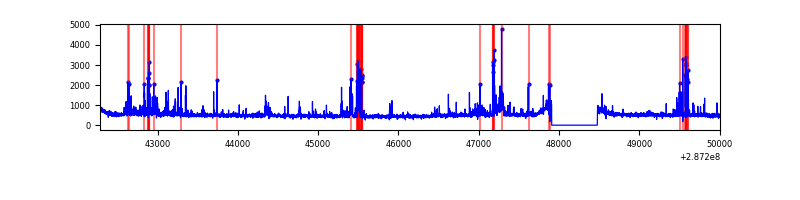 |
| D | 7722 | 7153 | 69 | 69 | 0.89% | 0.96% | 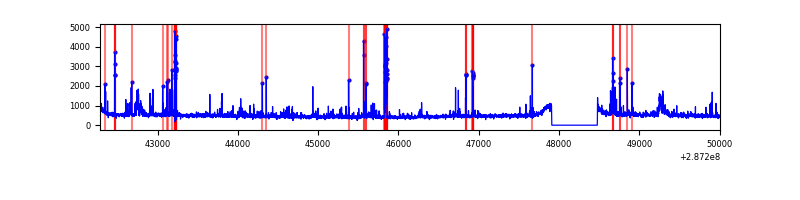 |
Top three noisy pixels from each quadrant. If the there are fewer than three noisy pixels in the level2.evt file, extra rows are filled as -1
| Pixel properties | Quadrant properties | ||||||
|---|---|---|---|---|---|---|---|
| Quadrant | DetID | PixID | Counts | Sigma | Mean | Median | Sigma |
| A | 15 | 174 | 40199 | 215.35 | 901 | 881 | 182.6 |
| A | 4 | 2 | 33628 | 179.36 | 901 | 881 | 182.6 |
| A | 0 | 226 | 7974 | 38.85 | 901 | 881 | 182.6 |
| B | 7 | 220 | 129564 | 747.53 | 896 | 873 | 172.2 |
| B | 12 | 111 | 20038 | 111.32 | 896 | 873 | 172.2 |
| B | 0 | 189 | 17757 | 98.07 | 896 | 873 | 172.2 |
| C | 4 | 254 | 562590 | 2786.24 | 858 | 863 | 201.6 |
| C | 14 | 238 | 135094 | 665.8 | 858 | 863 | 201.6 |
| C | 13 | 61 | 6146 | 26.2 | 858 | 863 | 201.6 |
| D | 7 | 238 | 291463 | 1342.98 | 878 | 852 | 216.4 |
| D | 10 | 70 | 123843 | 568.37 | 878 | 852 | 216.4 |
| D | 1 | 52 | 50862 | 231.11 | 878 | 852 | 216.4 |
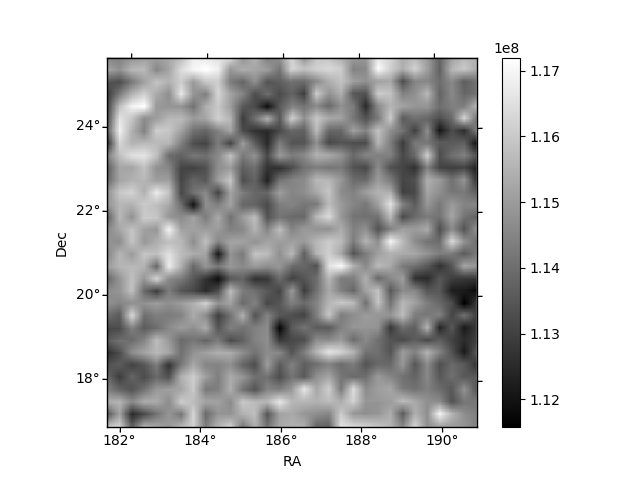
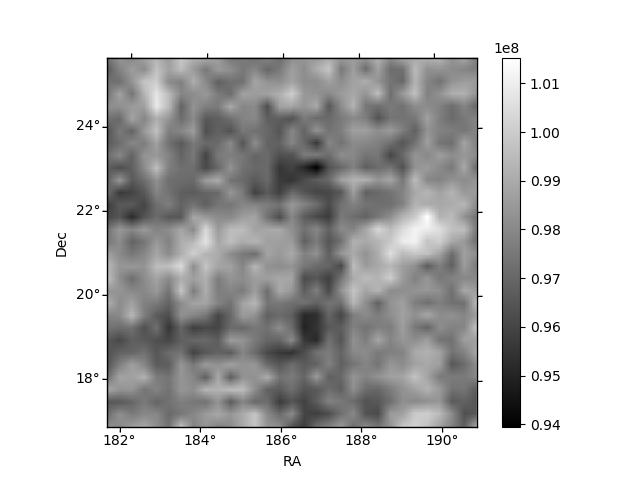
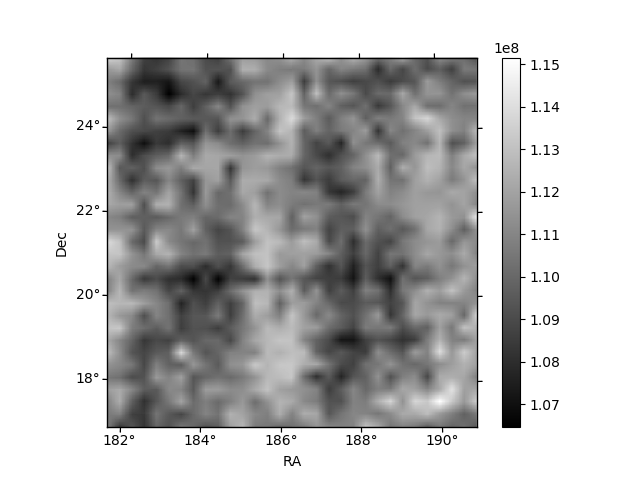
Histogram calculated using DETX and DETY for each event in the final _common_clean file
| Quadrant A | 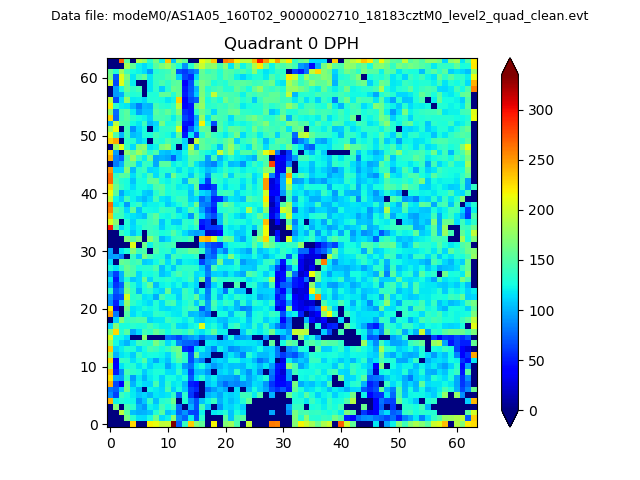 |
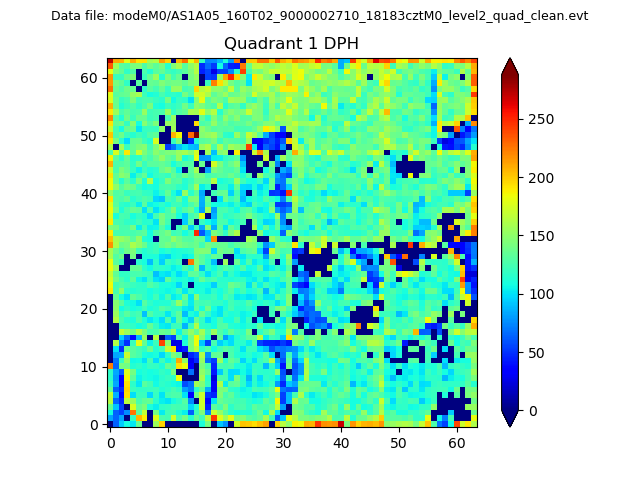 |
Quadrant B |
|---|---|---|---|
| Quadrant D | 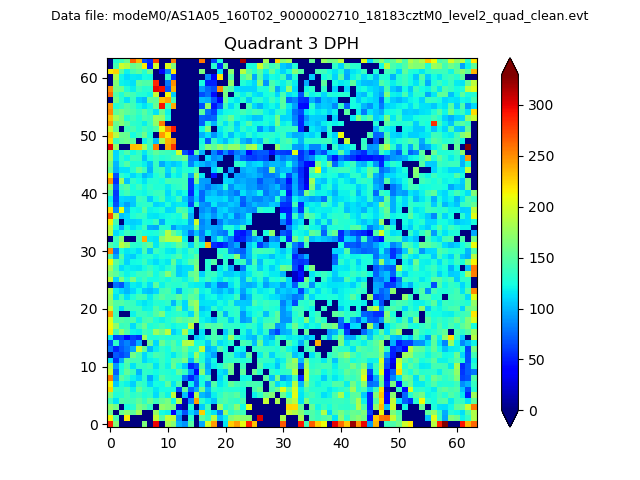 |
 |
Quadrant C |
| Plot type | Count rate plots | Images |
|---|---|---|
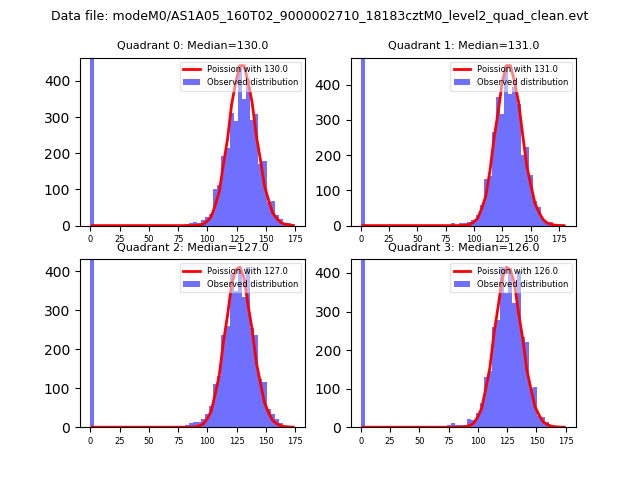
| Comparison with Poisson distribution Blue bars denote a histogram of data divided into 1 sec bins. Red curve is a Poisson curve with rate = median count rate of data. |
 |
 |
| Quadrant-wise count rates Data is divided into 100 sec bins |
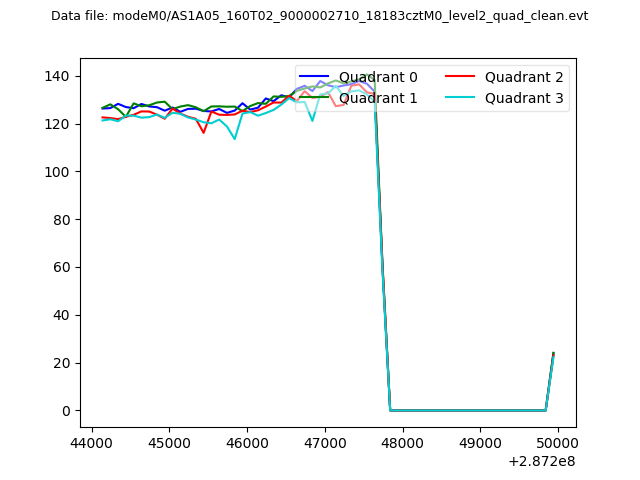 |
|
| Module-wise count rates for Quadrant A Data is divided into 100 sec bins |
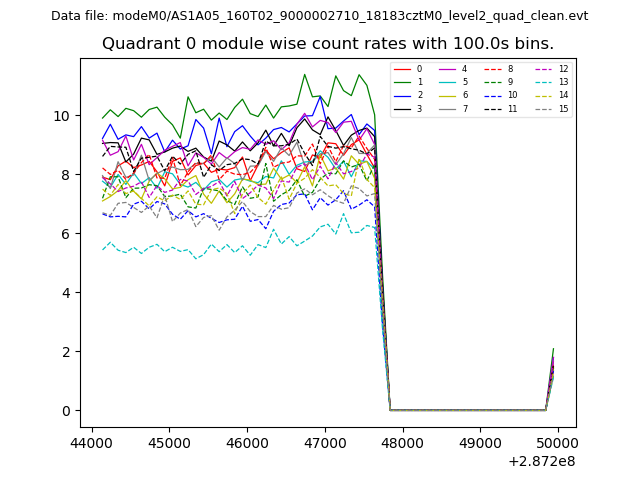 |
 |
| Module-wise count rates for Quadrant B Data is divided into 100 sec bins |
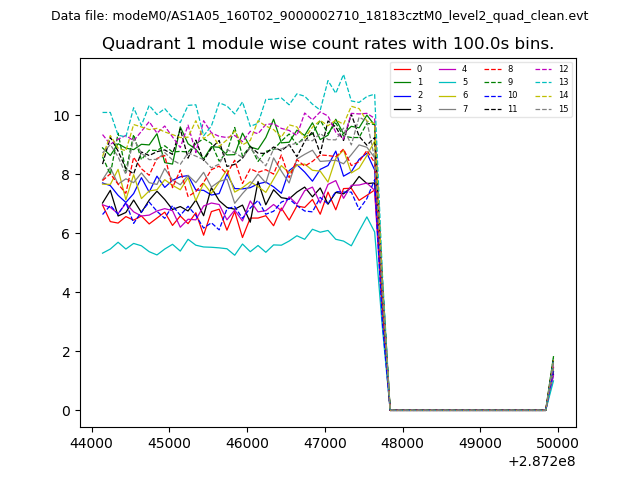 |
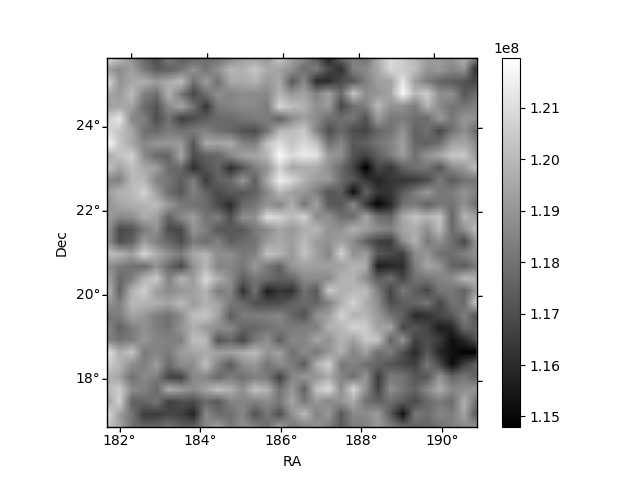 |
| Module-wise count rates for Quadrant C Data is divided into 100 sec bins |
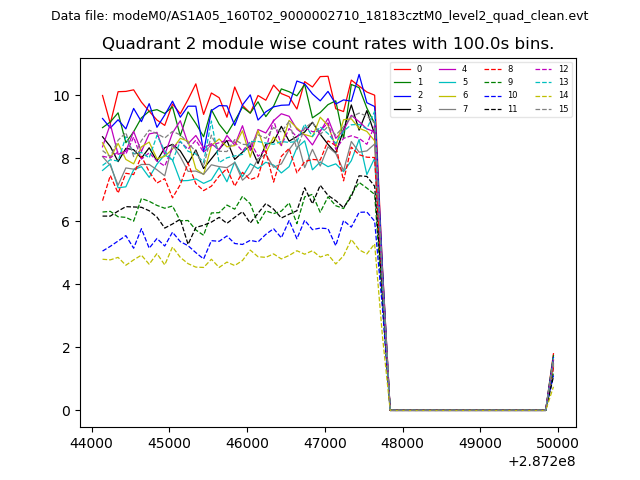 |
 |
| Module-wise count rates for Quadrant D Data is divided into 100 sec bins |
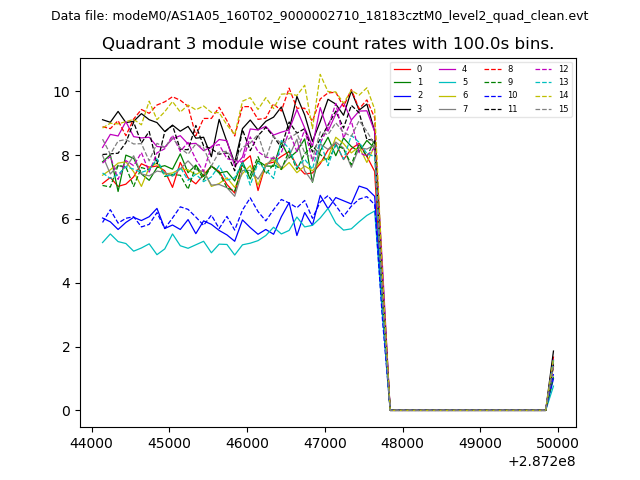 |
 |
| Parameter | Plot |
|---|---|
| CZT HV Monitor | 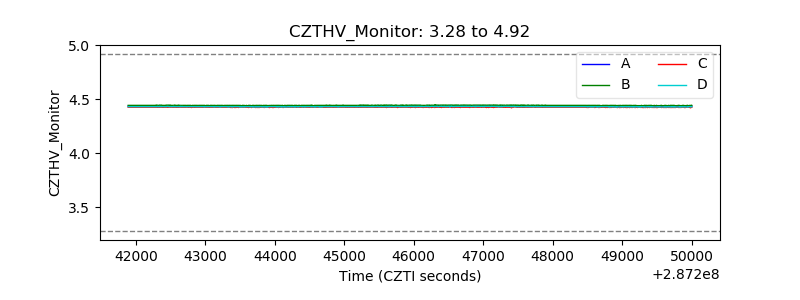 |
| D_VDD | 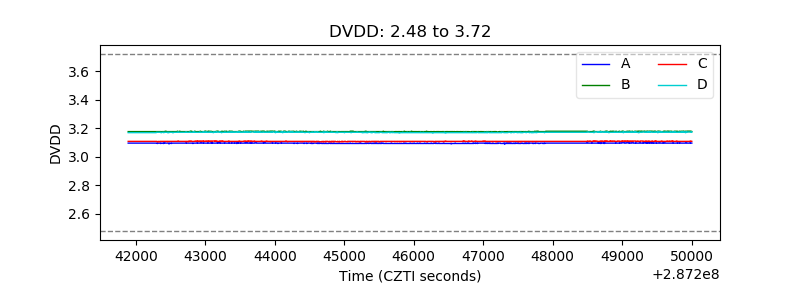 |
| Temperature 1 | 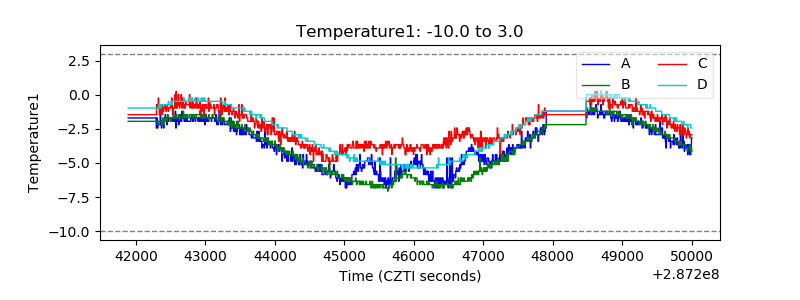 |
| Veto HV Monitor | 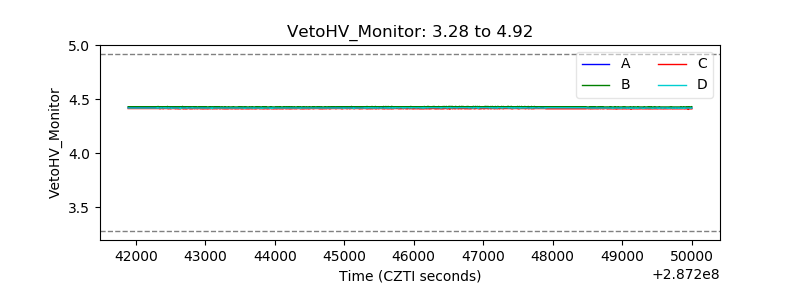 |
| Veto LLD | 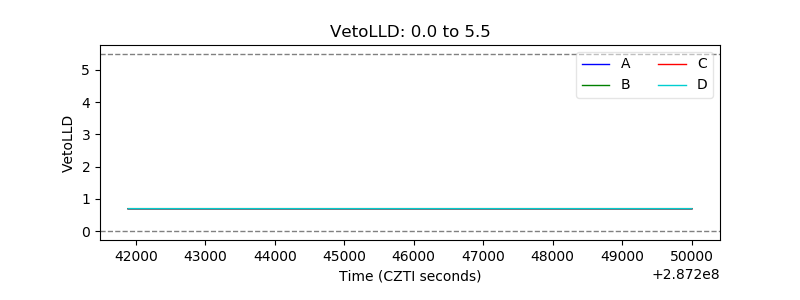 |
| Alpha Counter | 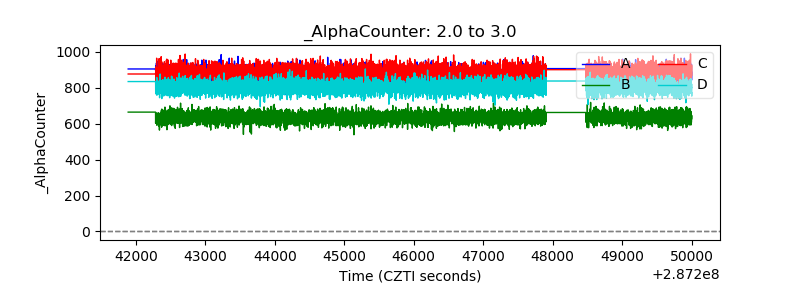 |
| _CPM_Rate | 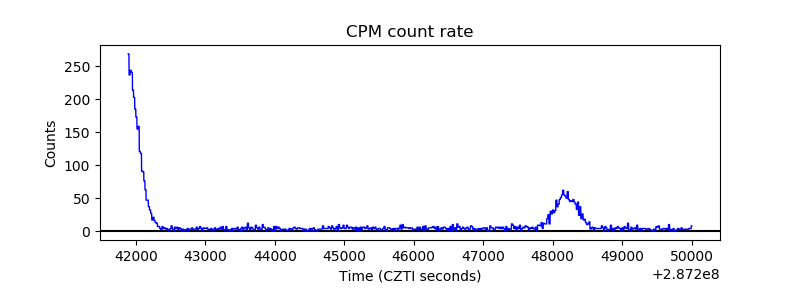 |
| CZT Counter | 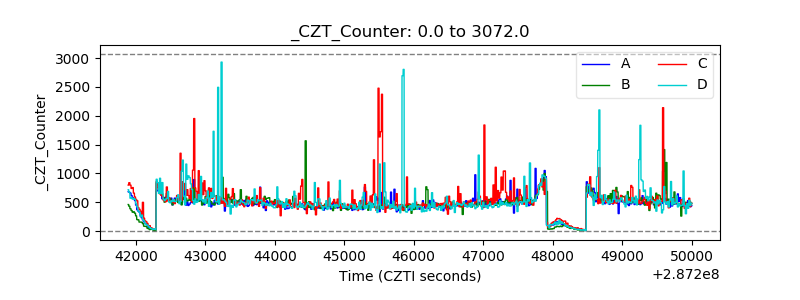 |
| +2.5 Volts monitor |  |
| +5 Volts monitor |  |
| _ROLL_ROT | 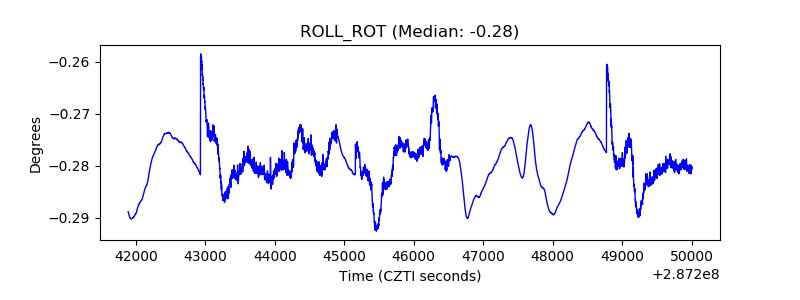 |
| _Roll_DEC | 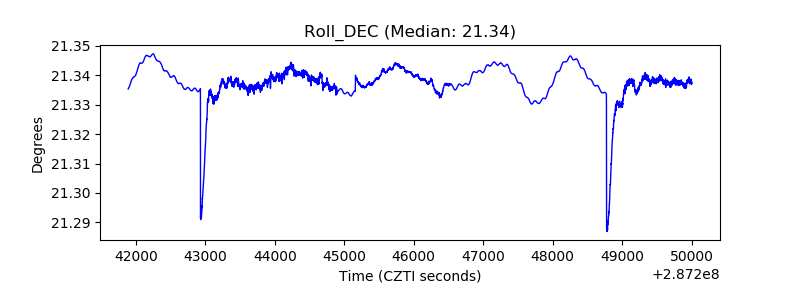 |
| _Roll_RA |  |
| Veto Counter | 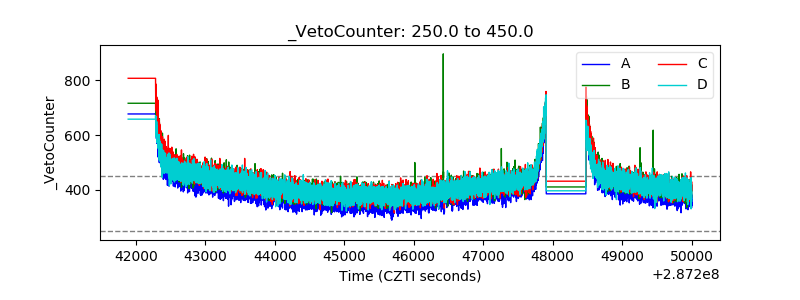 |