| Param | Original file | Final file |
|---|---|---|
| Filename | modeM0/AS1A05_160T02_9000002710_18184cztM0_level2.evt | modeM0/AS1A05_160T02_9000002710_18184cztM0_level2_quad_clean.evt |
| Size (bytes) | 541,445,760 | 82,264,320 |
| Size | 516.4 MB | 78.5 MB |
| Events in quadrant A | 3,599,271 | 501,035 |
| Events in quadrant B | 3,897,573 | 502,008 |
| Events in quadrant C | 4,089,592 | 489,570 |
| Events in quadrant D | 4,308,386 | 482,672 |
| Mode SS | |||
|---|---|---|---|
| Quadrant | BADHDUFLAG | Total packets | Discarded packets |
| A | 0 | 150 | 0 |
| B | 0 | 150 | 0 |
| C | 0 | 150 | 0 |
| D | 0 | 150 | 0 |
| Mode M9 | |||
|---|---|---|---|
| Quadrant | BADHDUFLAG | Total packets | Discarded packets |
| A | 0 | 2 | 0 |
| B | 0 | 2 | 0 |
| C | 0 | 2 | 0 |
| D | 0 | 2 | 0 |
| Mode M0 | |||
|---|---|---|---|
| Quadrant | BADHDUFLAG | Total packets | Discarded packets |
| A | 0 | 15452 | 1 |
| B | 0 | 16311 | 1 |
| C | 0 | 16888 | 1 |
| D | 0 | 17704 | 1 |
| Quadrant | Total seconds | Saturated seconds | Saturation percentage |
|---|---|---|---|
| A | 7410 | 93 | 1.255061% |
| B | 7410 | 197 | 2.658570% |
| C | 7410 | 315 | 4.251012% |
| D | 7411 | 259 | 3.494805% |
Noise dominated data is calculated using 1-second bins in cleaned event files. If a bin has >2000 counts, and if more than 50% of those come from <1% of pixels, then it is considered to be noise-dominated and hence unusable.
| Quadrant | # 1 sec bins | Bins with >0 counts | Bins with >2000 counts | High rate bins dominated by noise | Noise dominated (total time) | Noise dominated (detector-on time) | Marked lightcurve |
|---|---|---|---|---|---|---|---|
| A | 7615 | 7412 | 6 | 6 | 0.08% | 0.08% | 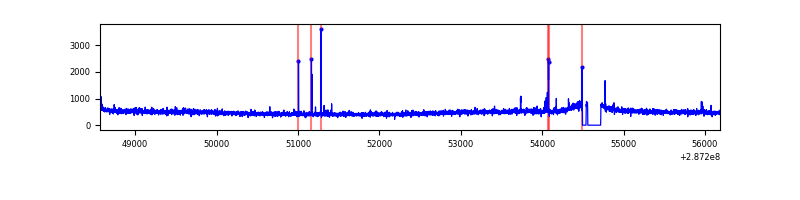 |
| B | 7615 | 7412 | 36 | 36 | 0.47% | 0.49% | 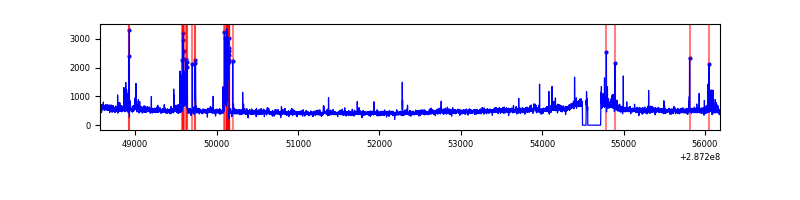 |
| C | 7615 | 7412 | 69 | 69 | 0.91% | 0.93% | 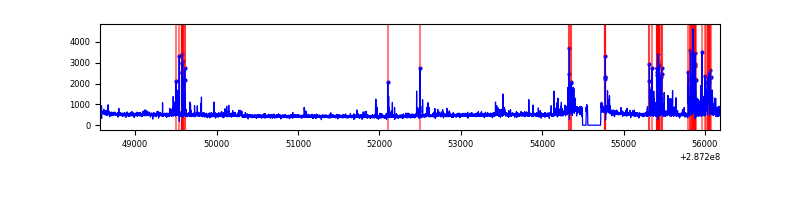 |
| D | 7616 | 7413 | 122 | 122 | 1.60% | 1.65% | 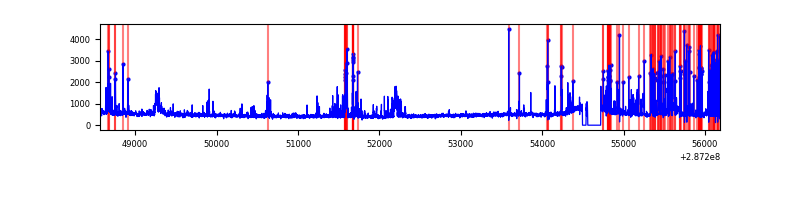 |
Top three noisy pixels from each quadrant. If the there are fewer than three noisy pixels in the level2.evt file, extra rows are filled as -1
| Pixel properties | Quadrant properties | ||||||
|---|---|---|---|---|---|---|---|
| Quadrant | DetID | PixID | Counts | Sigma | Mean | Median | Sigma |
| A | 4 | 2 | 35091 | 182.83 | 918 | 896 | 187.0 |
| A | 15 | 174 | 21942 | 112.53 | 918 | 896 | 187.0 |
| A | 15 | 192 | 10360 | 50.6 | 918 | 896 | 187.0 |
| B | 7 | 220 | 227924 | 1290.44 | 912 | 889 | 175.9 |
| B | 0 | 189 | 37170 | 206.22 | 912 | 889 | 175.9 |
| B | 0 | 229 | 21338 | 116.23 | 912 | 889 | 175.9 |
| C | 4 | 254 | 557919 | 2743.18 | 869 | 873 | 203.1 |
| C | 14 | 238 | 134057 | 655.87 | 869 | 873 | 203.1 |
| C | 13 | 61 | 6234 | 26.4 | 869 | 873 | 203.1 |
| D | 7 | 238 | 538047 | 2463.14 | 890 | 865 | 218.1 |
| D | 10 | 70 | 198466 | 906.06 | 890 | 865 | 218.1 |
| D | 1 | 52 | 48886 | 220.19 | 890 | 865 | 218.1 |
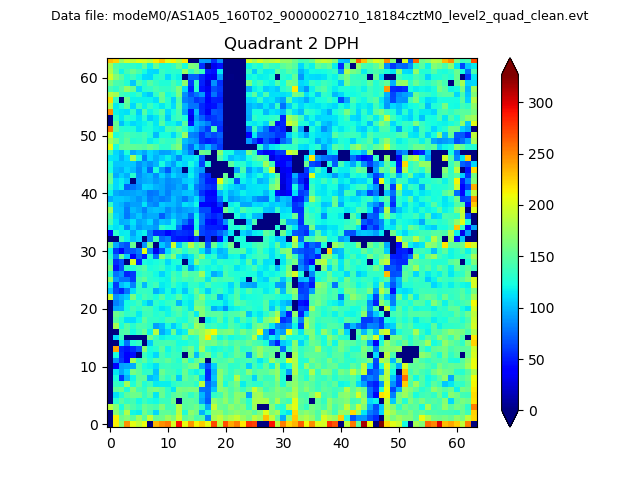
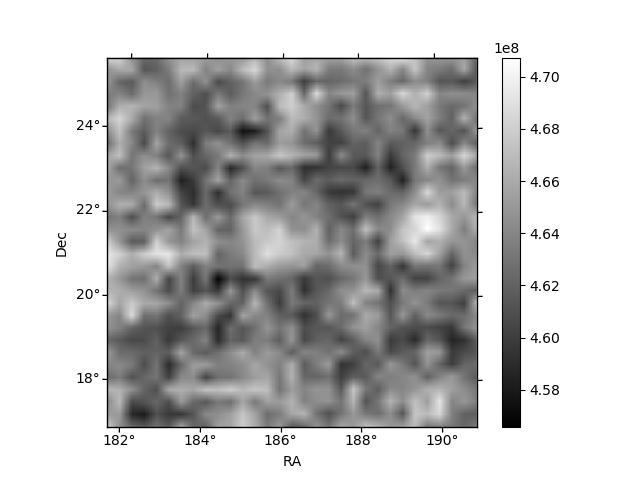
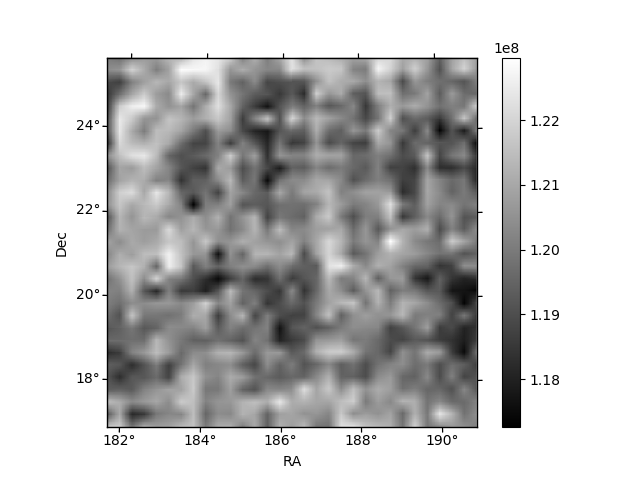
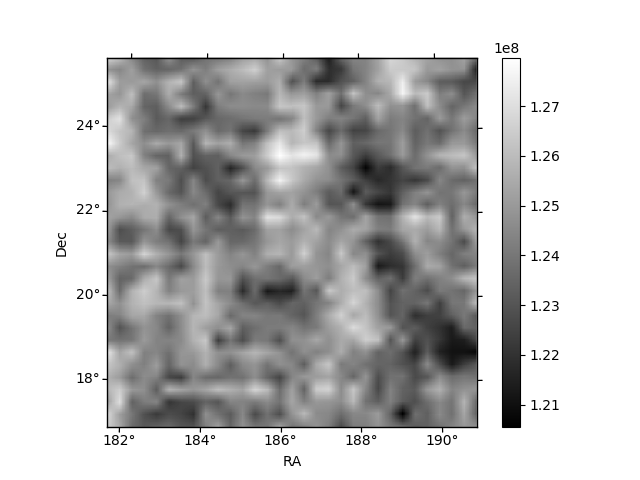
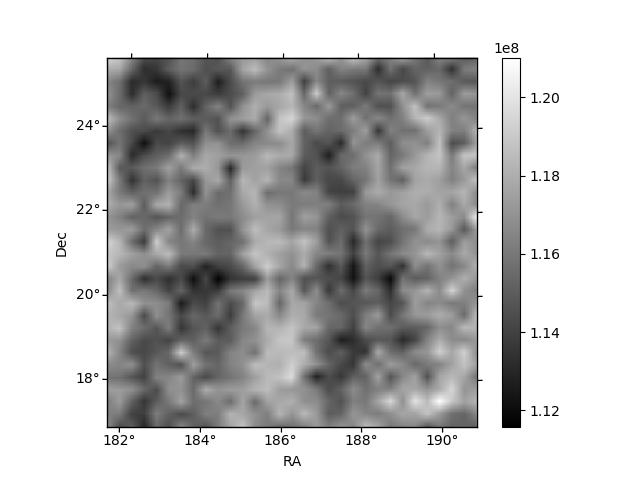
Histogram calculated using DETX and DETY for each event in the final _common_clean file
| Quadrant A | 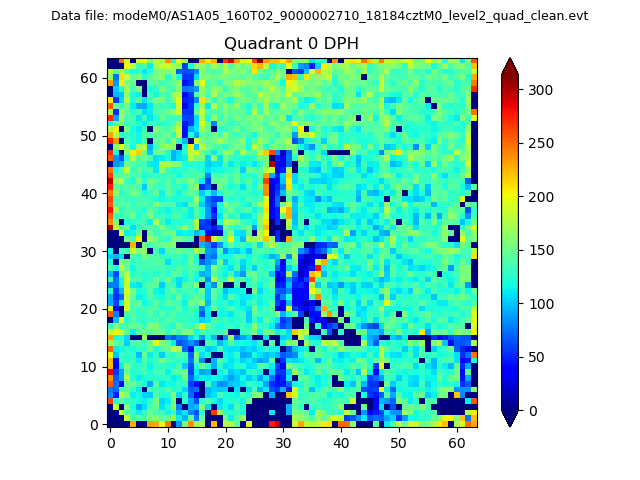 |
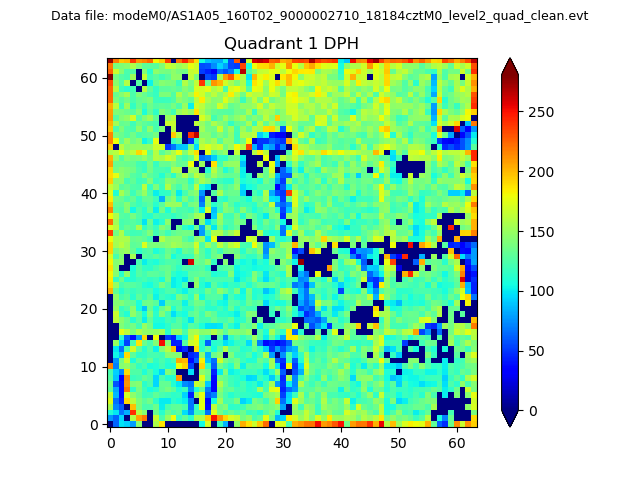 |
Quadrant B |
|---|---|---|---|
| Quadrant D | 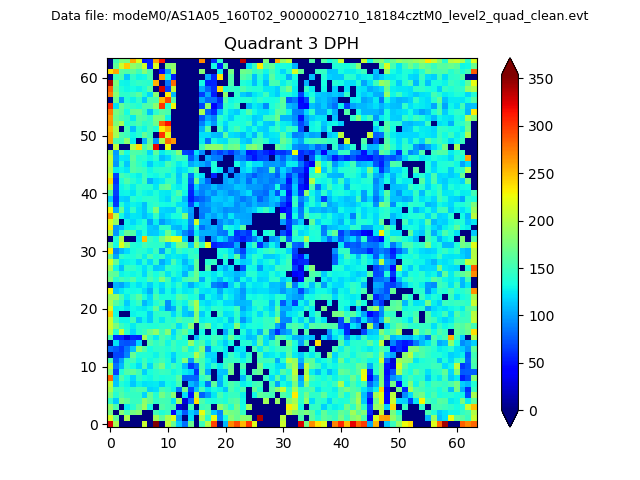 |
 |
Quadrant C |
| Plot type | Count rate plots | Images |
|---|---|---|
| Comparison with Poisson distribution Blue bars denote a histogram of data divided into 1 sec bins. Red curve is a Poisson curve with rate = median count rate of data. |
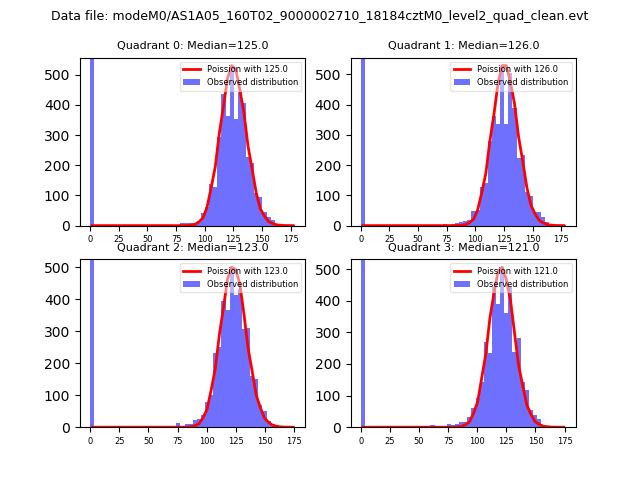 |
 |
| Quadrant-wise count rates Data is divided into 100 sec bins |
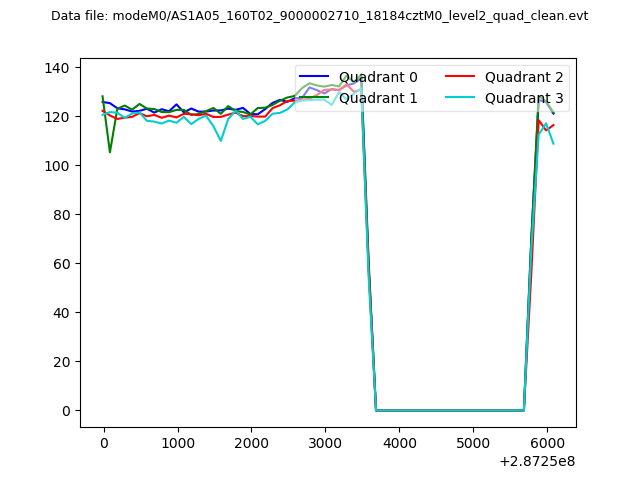 |
|
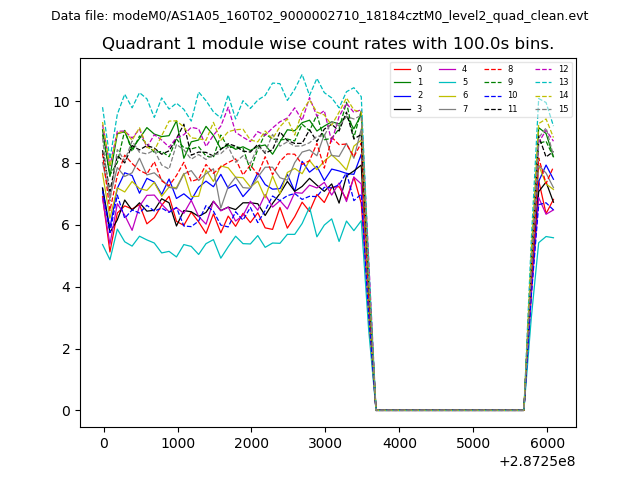
| Module-wise count rates for Quadrant A Data is divided into 100 sec bins |
 |
 |
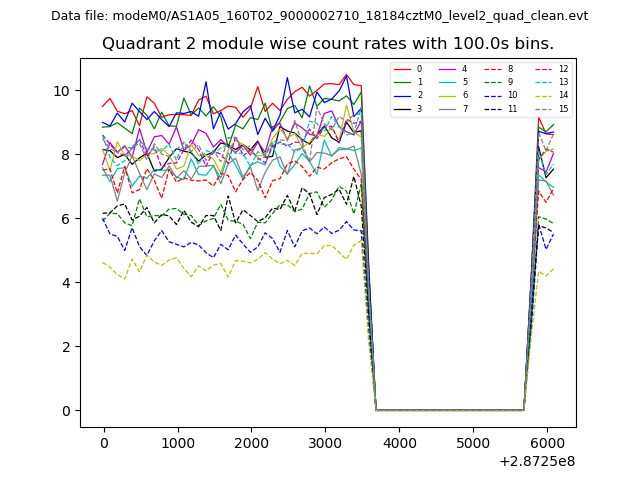
| Module-wise count rates for Quadrant B Data is divided into 100 sec bins |
 |
 |
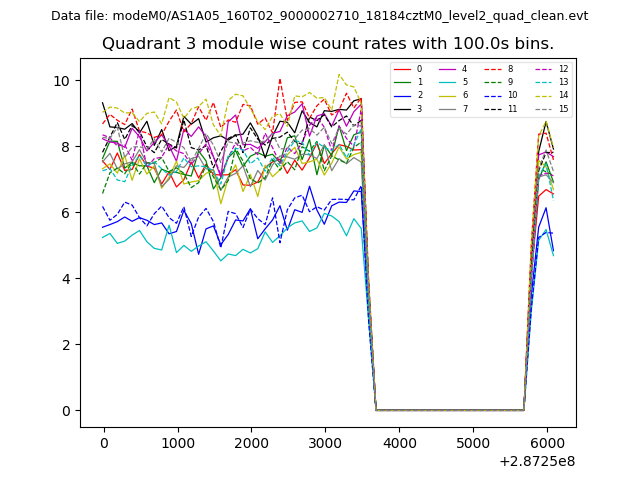
| Module-wise count rates for Quadrant C Data is divided into 100 sec bins |
 |
 |
| Module-wise count rates for Quadrant D Data is divided into 100 sec bins |
 |
 |
| Parameter | Plot |
|---|---|
| CZT HV Monitor | 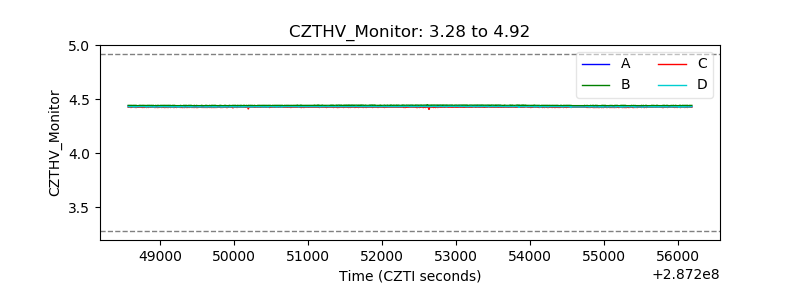 |
| D_VDD | 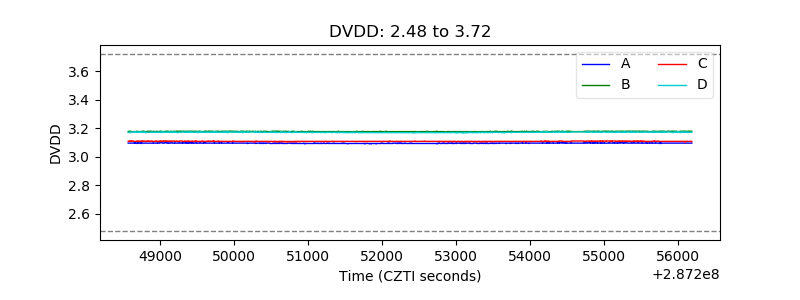 |
| Temperature 1 |  |
| Veto HV Monitor | 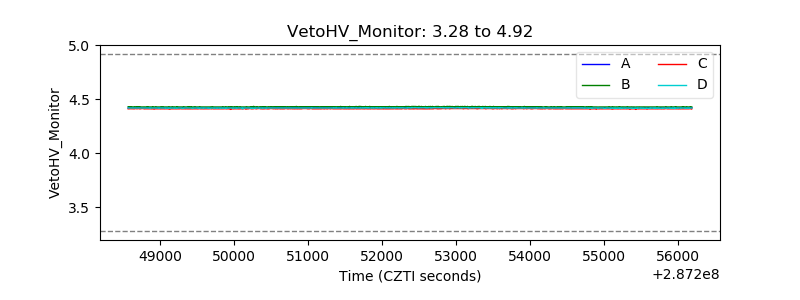 |
| Veto LLD | 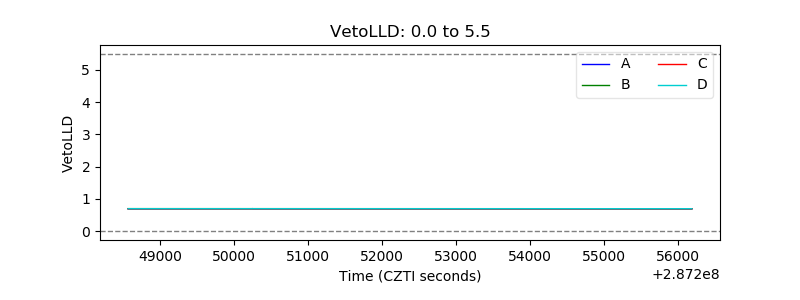 |
| Alpha Counter | 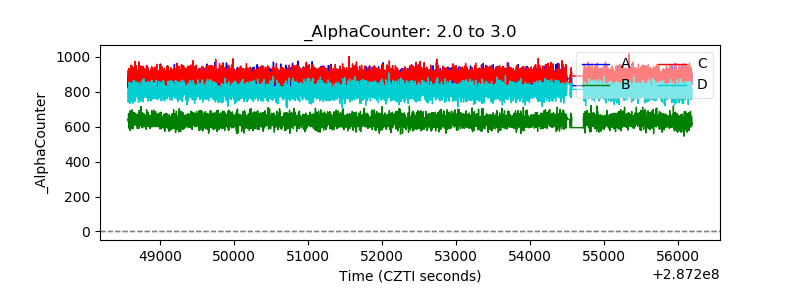 |
| _CPM_Rate | 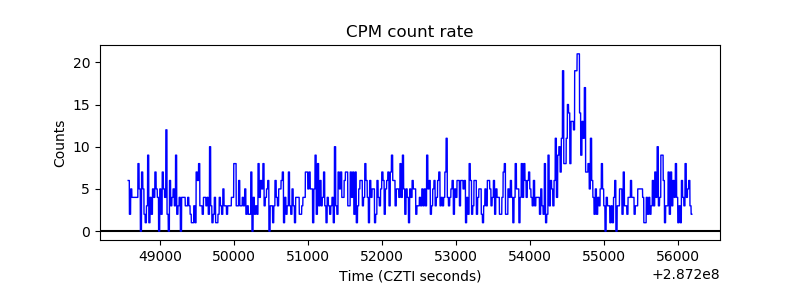 |
| CZT Counter | 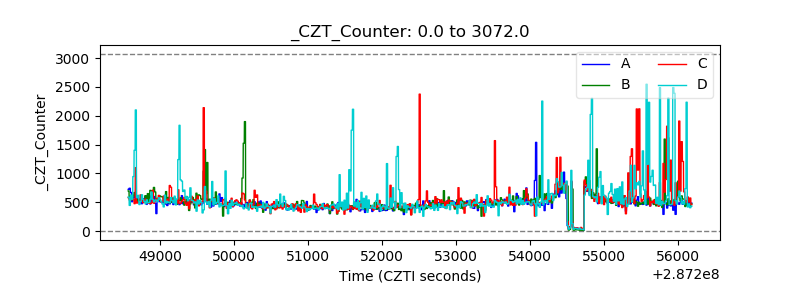 |
| +2.5 Volts monitor |  |
| +5 Volts monitor | 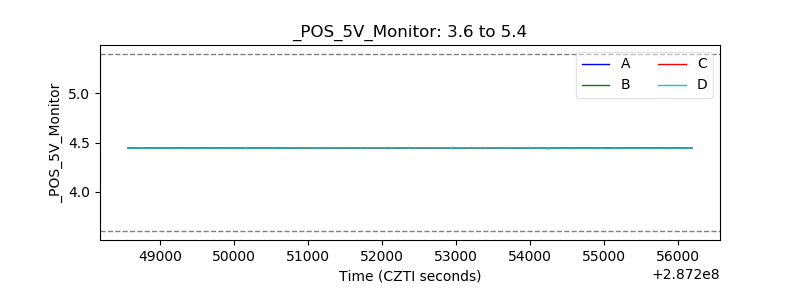 |
| _ROLL_ROT | 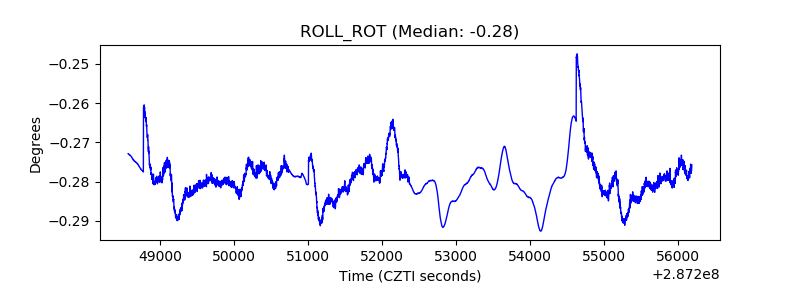 |
| _Roll_DEC | 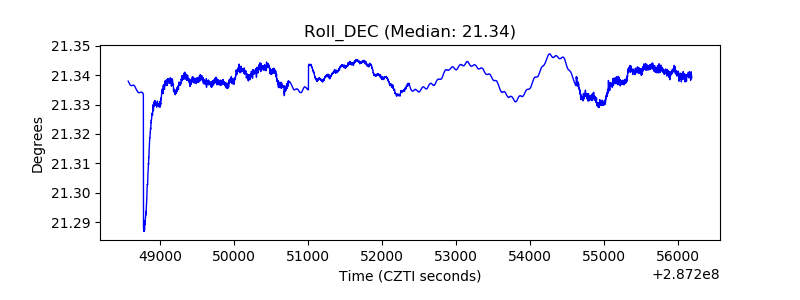 |
| _Roll_RA | 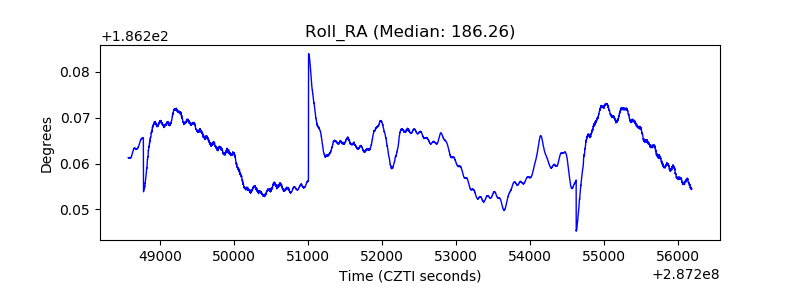 |
| Veto Counter |  |