| Param | Original file | Final file |
|---|---|---|
| Filename | modeM0/AS1A05_160T02_9000002710_18185cztM0_level2.evt | modeM0/AS1A05_160T02_9000002710_18185cztM0_level2_quad_clean.evt |
| Size (bytes) | 557,936,640 | 90,806,400 |
| Size | 532.1 MB | 86.6 MB |
| Events in quadrant A | 3,468,270 | 570,704 |
| Events in quadrant B | 3,623,441 | 577,058 |
| Events in quadrant C | 4,389,355 | 551,139 |
| Events in quadrant D | 4,921,292 | 543,023 |
| Mode SS | |||
|---|---|---|---|
| Quadrant | BADHDUFLAG | Total packets | Discarded packets |
| A | 0 | 148 | 0 |
| B | 0 | 148 | 0 |
| C | 0 | 148 | 0 |
| D | 0 | 148 | 0 |
| Mode M9 | |||
|---|---|---|---|
| Quadrant | BADHDUFLAG | Total packets | Discarded packets |
| A | 0 | 3 | 0 |
| B | 0 | 3 | 0 |
| C | 0 | 3 | 0 |
| D | 0 | 3 | 0 |
| Mode M0 | |||
|---|---|---|---|
| Quadrant | BADHDUFLAG | Total packets | Discarded packets |
| A | 0 | 15109 | 0 |
| B | 0 | 15494 | 0 |
| C | 0 | 17798 | 0 |
| D | 0 | 19609 | 0 |
| Quadrant | Total seconds | Saturated seconds | Saturation percentage |
|---|---|---|---|
| A | 7291 | 65 | 0.891510% |
| B | 7291 | 115 | 1.577287% |
| C | 7292 | 334 | 4.580362% |
| D | 7291 | 338 | 4.635852% |
Noise dominated data is calculated using 1-second bins in cleaned event files. If a bin has >2000 counts, and if more than 50% of those come from <1% of pixels, then it is considered to be noise-dominated and hence unusable.
| Quadrant | # 1 sec bins | Bins with >0 counts | Bins with >2000 counts | High rate bins dominated by noise | Noise dominated (total time) | Noise dominated (detector-on time) | Marked lightcurve |
|---|---|---|---|---|---|---|---|
| A | 7506 | 7292 | 0 | 0 | 0.00% | 0.00% | 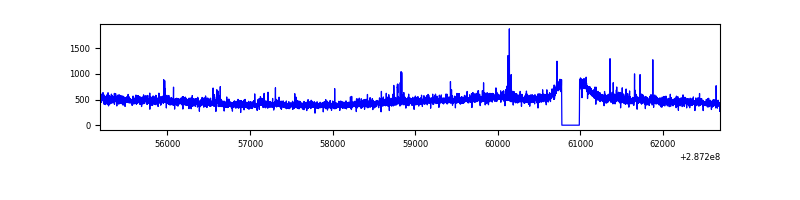 |
| B | 7506 | 7292 | 3 | 3 | 0.04% | 0.04% |  |
| C | 7507 | 7293 | 111 | 111 | 1.48% | 1.52% | 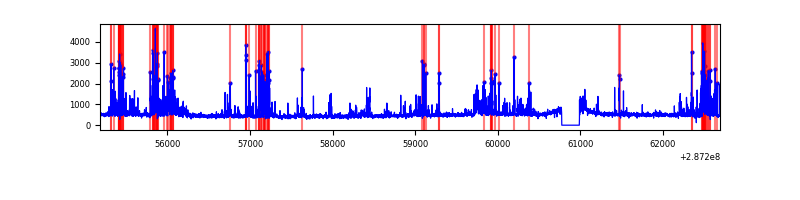 |
| D | 7506 | 7292 | 261 | 261 | 3.48% | 3.58% | 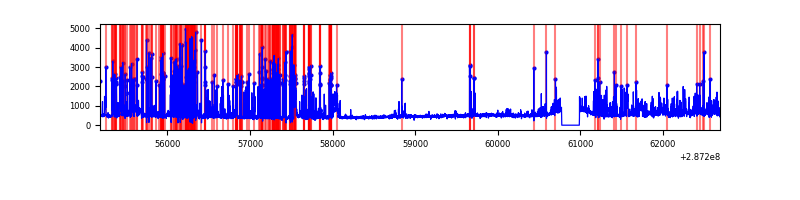 |
Top three noisy pixels from each quadrant. If the there are fewer than three noisy pixels in the level2.evt file, extra rows are filled as -1
| Pixel properties | Quadrant properties | ||||||
|---|---|---|---|---|---|---|---|
| Quadrant | DetID | PixID | Counts | Sigma | Mean | Median | Sigma |
| A | 4 | 2 | 35720 | 194.5 | 883 | 864 | 179.2 |
| A | 15 | 174 | 20935 | 112.0 | 883 | 864 | 179.2 |
| A | 15 | 192 | 13663 | 71.42 | 883 | 864 | 179.2 |
| B | 7 | 220 | 71257 | 408.56 | 884 | 859 | 172.3 |
| B | 0 | 189 | 39119 | 222.05 | 884 | 859 | 172.3 |
| B | 0 | 229 | 20435 | 113.61 | 884 | 859 | 172.3 |
| C | 4 | 254 | 977919 | 4938.53 | 838 | 841 | 197.8 |
| C | 14 | 238 | 128650 | 645.99 | 838 | 841 | 197.8 |
| C | 4 | 238 | 9245 | 42.47 | 838 | 841 | 197.8 |
| D | 7 | 238 | 1360089 | 6433.91 | 852 | 827 | 211.3 |
| D | 10 | 70 | 106301 | 499.25 | 852 | 827 | 211.3 |
| D | 13 | 168 | 70593 | 330.23 | 852 | 827 | 211.3 |
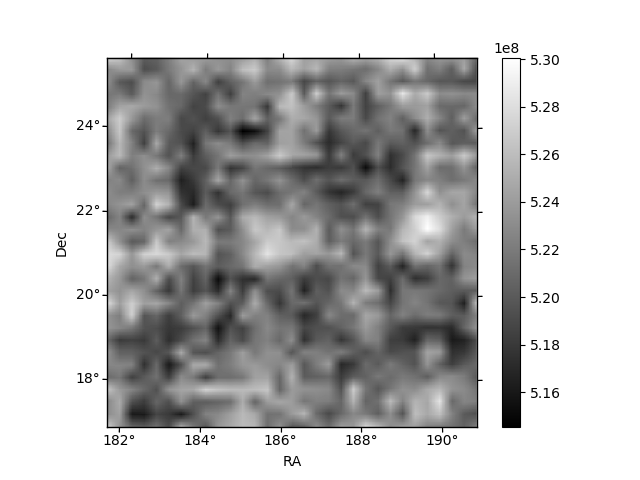
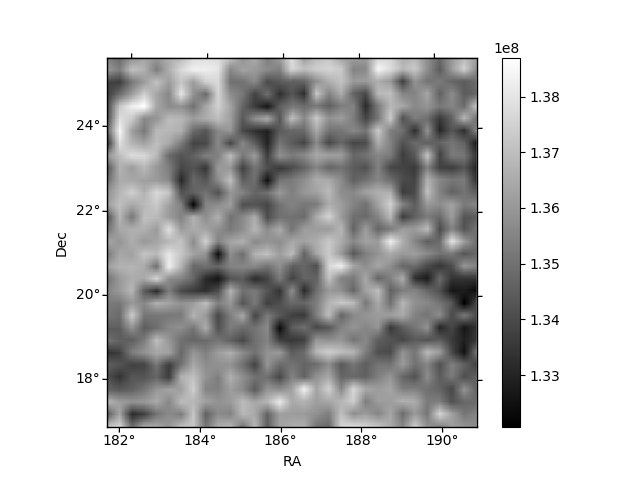
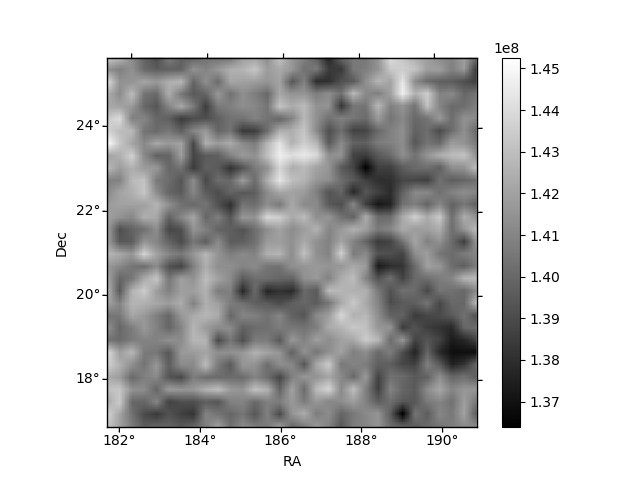
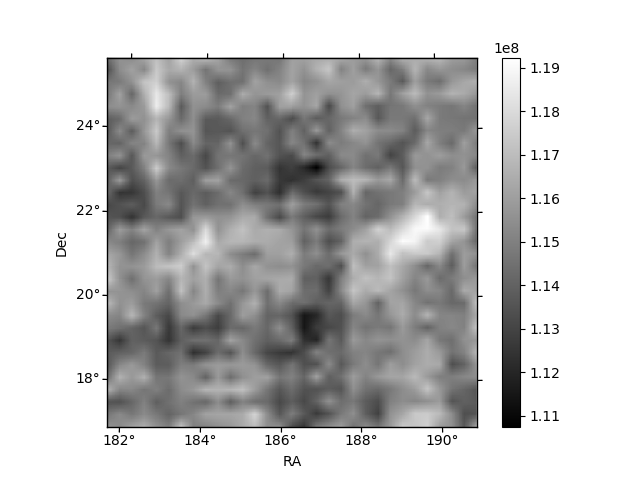
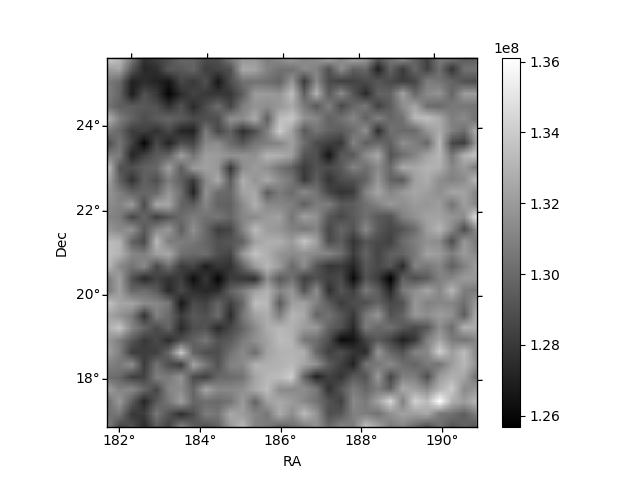
Histogram calculated using DETX and DETY for each event in the final _common_clean file
| Quadrant A | 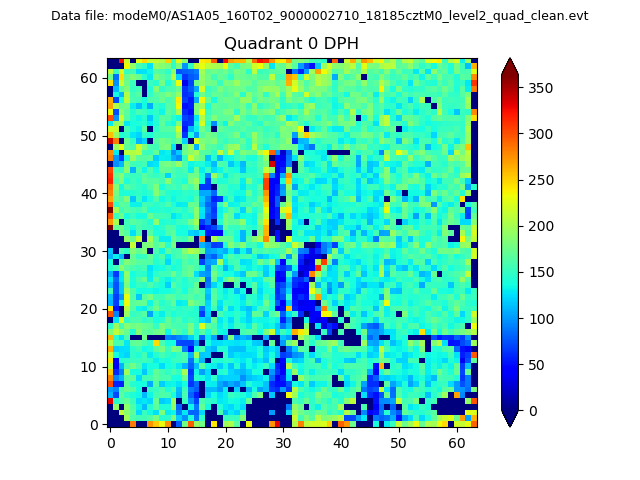 |
 |
Quadrant B |
|---|---|---|---|
| Quadrant D |  |
 |
Quadrant C |
| Plot type | Count rate plots | Images |
|---|---|---|
| Comparison with Poisson distribution Blue bars denote a histogram of data divided into 1 sec bins. Red curve is a Poisson curve with rate = median count rate of data. |
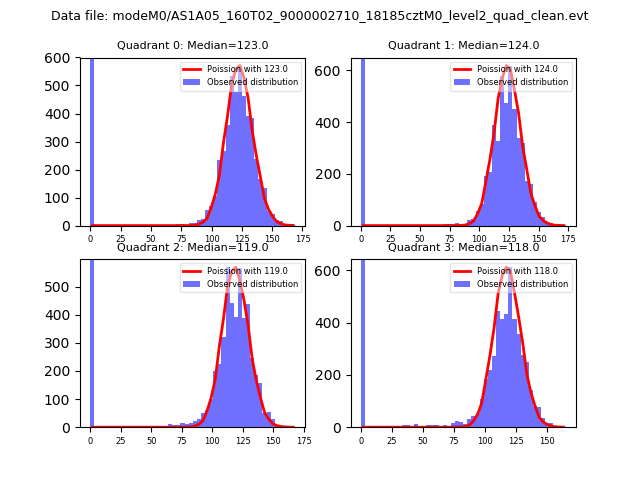 |
 |
| Quadrant-wise count rates Data is divided into 100 sec bins |
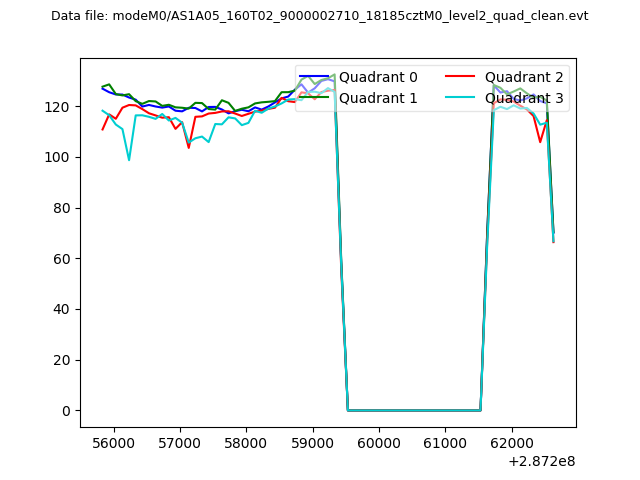 |
|
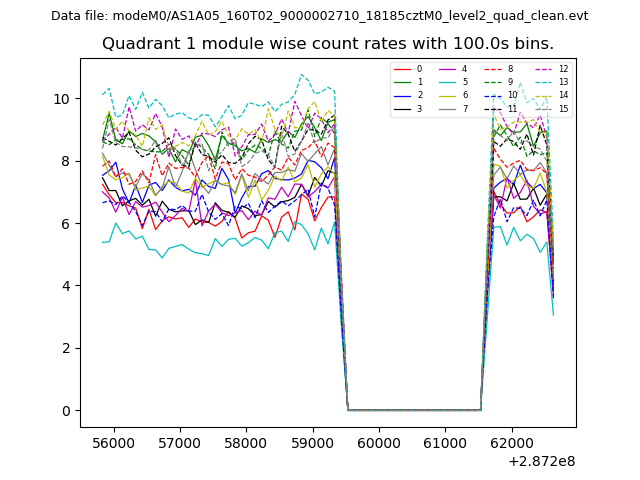
| Module-wise count rates for Quadrant A Data is divided into 100 sec bins |
 |
 |
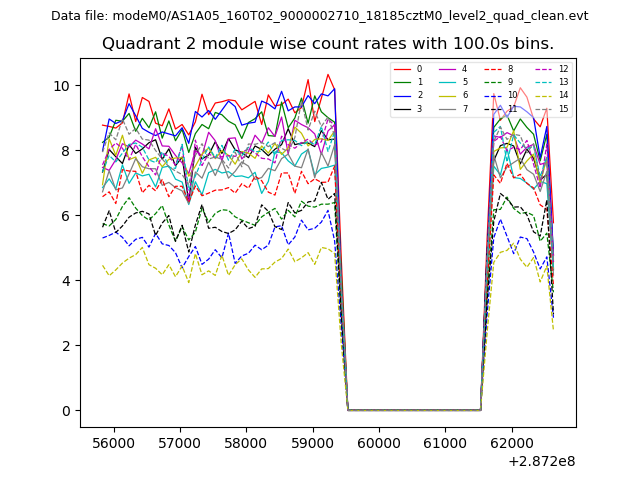
| Module-wise count rates for Quadrant B Data is divided into 100 sec bins |
 |
 |
| Module-wise count rates for Quadrant C Data is divided into 100 sec bins |
 |
 |
| Module-wise count rates for Quadrant D Data is divided into 100 sec bins |
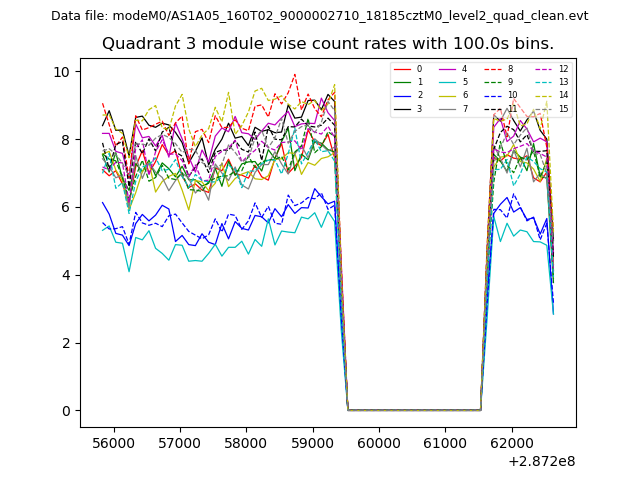 |
 |
| Parameter | Plot |
|---|---|
| CZT HV Monitor |  |
| D_VDD | 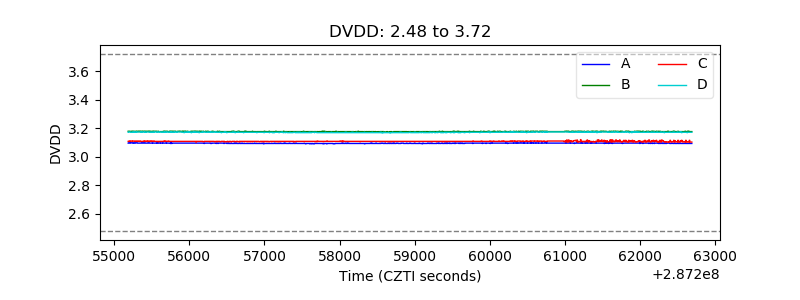 |
| Temperature 1 | 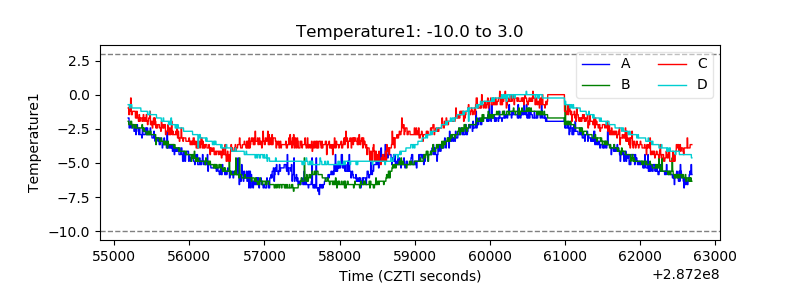 |
| Veto HV Monitor | 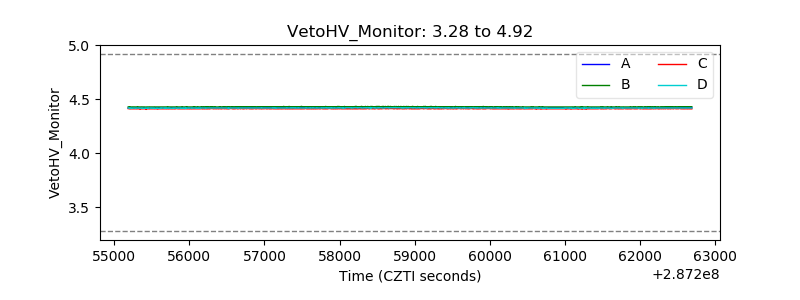 |
| Veto LLD | 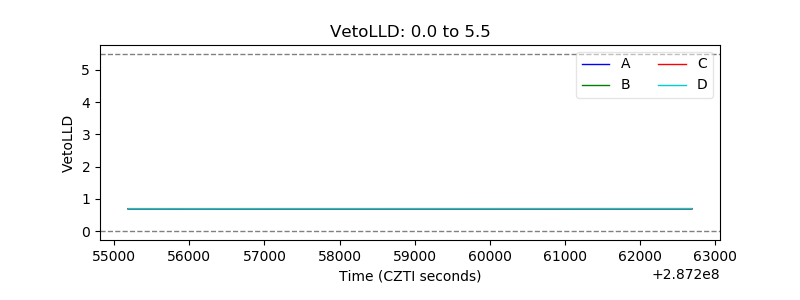 |
| Alpha Counter | 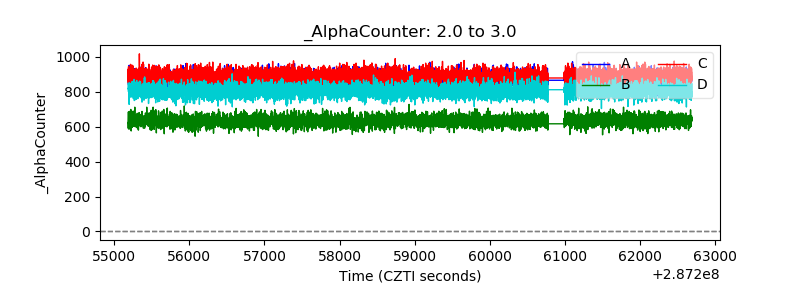 |
| _CPM_Rate | 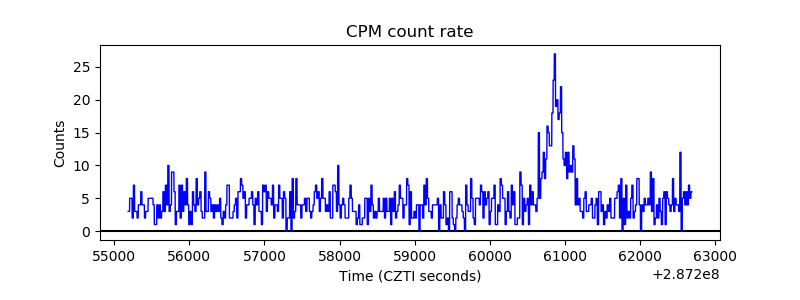 |
| CZT Counter | 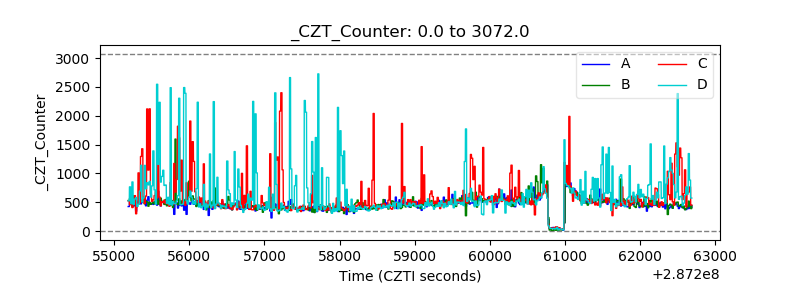 |
| +2.5 Volts monitor |  |
| +5 Volts monitor | 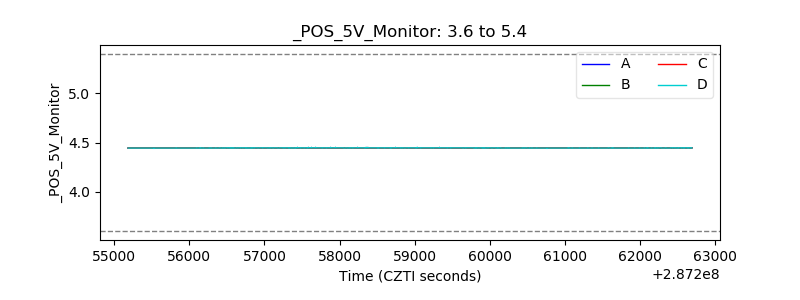 |
| _ROLL_ROT | 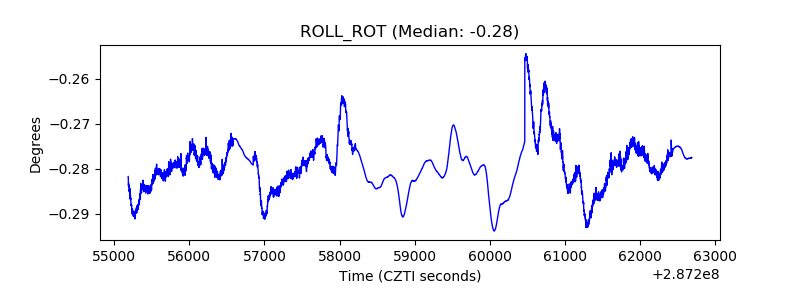 |
| _Roll_DEC | 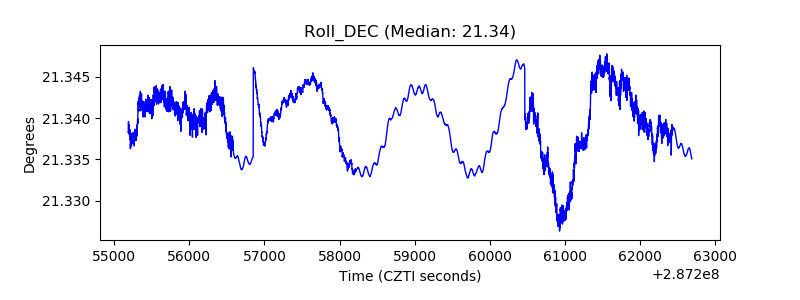 |
| _Roll_RA | 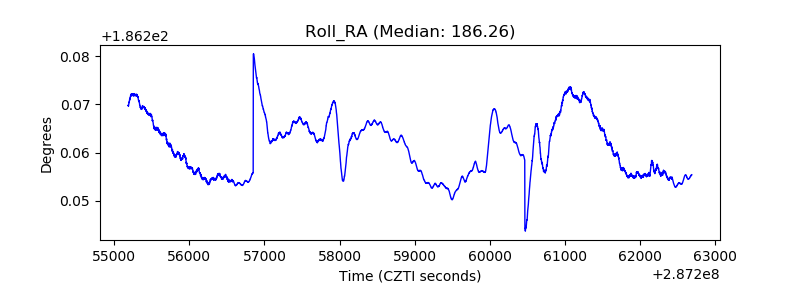 |
| Veto Counter | 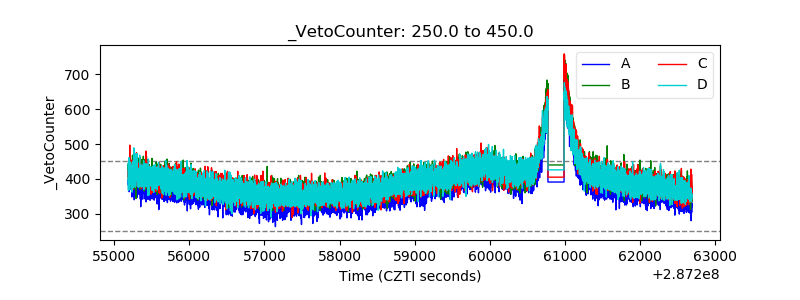 |