| Param | Original file | Final file |
|---|---|---|
| Filename | modeM0/AS1A05_160T02_9000002710_18188cztM0_level2.evt | modeM0/AS1A05_160T02_9000002710_18188cztM0_level2_quad_clean.evt |
| Size (bytes) | 431,112,960 | 89,363,520 |
| Size | 411.1 MB | 85.2 MB |
| Events in quadrant A | 2,803,165 | 584,925 |
| Events in quadrant B | 2,911,169 | 597,372 |
| Events in quadrant C | 3,364,802 | 550,969 |
| Events in quadrant D | 3,555,572 | 541,214 |
| Mode SS | |||
|---|---|---|---|
| Quadrant | BADHDUFLAG | Total packets | Discarded packets |
| A | 0 | 170 | 40 |
| B | 0 | 170 | 28 |
| C | 0 | 170 | 38 |
| D | 0 | 170 | 42 |
| Mode M9 | |||
|---|---|---|---|
| Quadrant | BADHDUFLAG | Total packets | Discarded packets |
| A | 0 | 4 | 3 |
| B | 0 | 4 | 2 |
| C | 0 | 4 | 1 |
| D | 0 | 4 | 1 |
| Mode M0 | |||
|---|---|---|---|
| Quadrant | BADHDUFLAG | Total packets | Discarded packets |
| A | 0 | 17149 | 4399 |
| B | 0 | 17424 | 4495 |
| C | 0 | 21158 | 7093 |
| D | 0 | 21608 | 6814 |
| Quadrant | Total seconds | Saturated seconds | Saturation percentage |
|---|---|---|---|
| A | 6266 | 10 | 0.159591% |
| B | 6292 | 15 | 0.238398% |
| C | 6017 | 167 | 2.775470% |
| D | 5948 | 69 | 1.160054% |
Noise dominated data is calculated using 1-second bins in cleaned event files. If a bin has >2000 counts, and if more than 50% of those come from <1% of pixels, then it is considered to be noise-dominated and hence unusable.
| Quadrant | # 1 sec bins | Bins with >0 counts | Bins with >2000 counts | High rate bins dominated by noise | Noise dominated (total time) | Noise dominated (detector-on time) | Marked lightcurve |
|---|---|---|---|---|---|---|---|
| A | 8782 | 7367 | 0 | 0 | 0.00% | 0.00% | 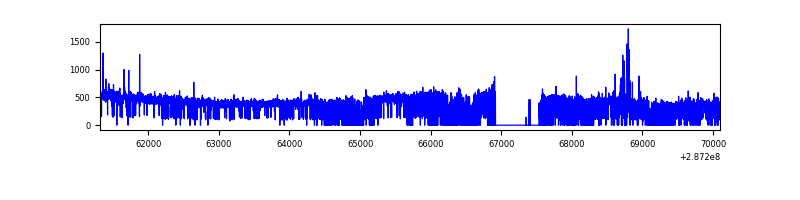 |
| B | 8783 | 7351 | 0 | 0 | 0.00% | 0.00% | 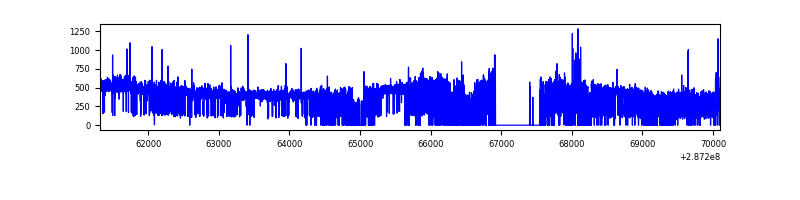 |
| C | 8781 | 7127 | 60 | 60 | 0.68% | 0.84% | 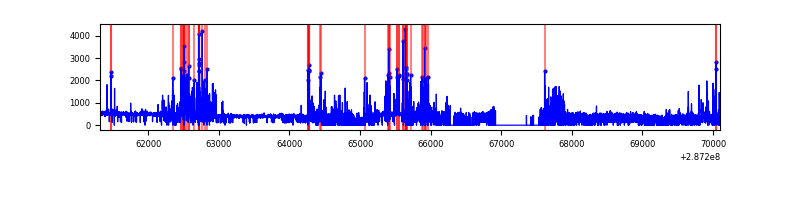 |
| D | 8782 | 7075 | 46 | 46 | 0.52% | 0.65% | 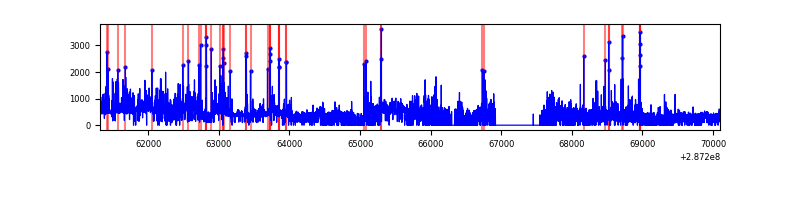 |
Top three noisy pixels from each quadrant. If the there are fewer than three noisy pixels in the level2.evt file, extra rows are filled as -1
| Pixel properties | Quadrant properties | ||||||
|---|---|---|---|---|---|---|---|
| Quadrant | DetID | PixID | Counts | Sigma | Mean | Median | Sigma |
| A | 15 | 174 | 35459 | 238.62 | 714 | 698 | 145.7 |
| A | 4 | 2 | 17391 | 114.59 | 714 | 698 | 145.7 |
| A | 0 | 226 | 6151 | 37.43 | 714 | 698 | 145.7 |
| B | 3 | 64 | 22673 | 155.96 | 722 | 703 | 140.9 |
| B | 0 | 189 | 21329 | 146.42 | 722 | 703 | 140.9 |
| B | 0 | 229 | 17874 | 121.89 | 722 | 703 | 140.9 |
| C | 4 | 254 | 697866 | 4504.63 | 654 | 659 | 154.8 |
| C | 14 | 238 | 100703 | 646.38 | 654 | 659 | 154.8 |
| C | 8 | 128 | 7478 | 44.06 | 654 | 659 | 154.8 |
| D | 7 | 238 | 512268 | 3150.05 | 656 | 636 | 162.4 |
| D | 5 | 222 | 139499 | 854.96 | 656 | 636 | 162.4 |
| D | 10 | 70 | 128368 | 786.43 | 656 | 636 | 162.4 |
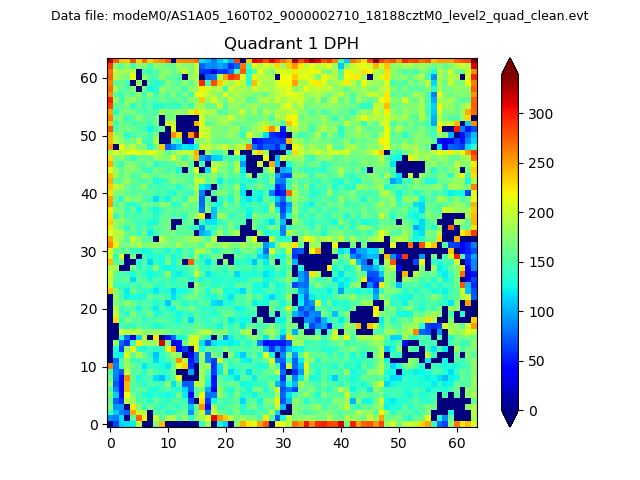
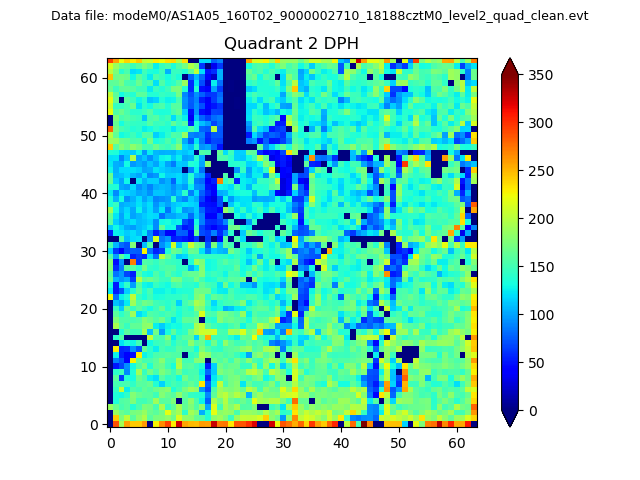
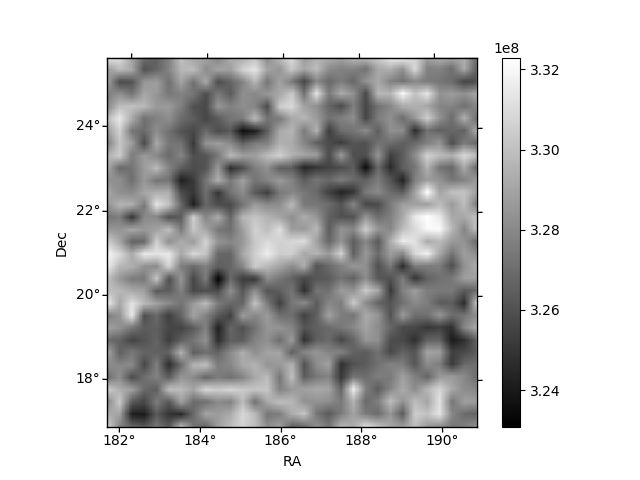
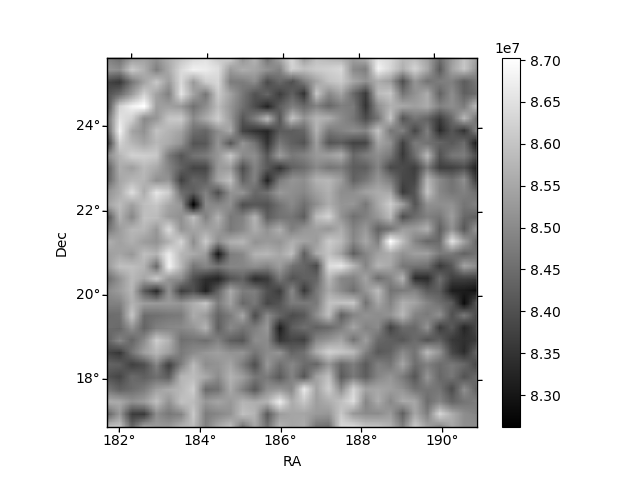
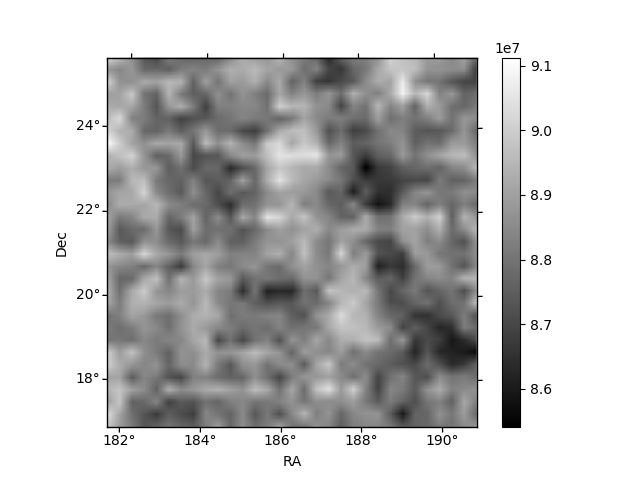
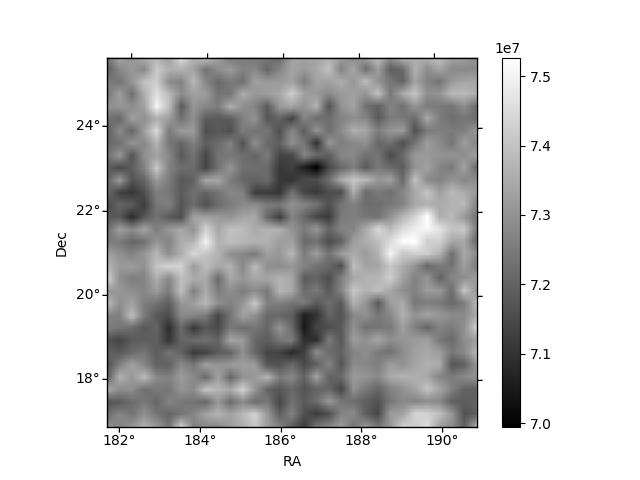
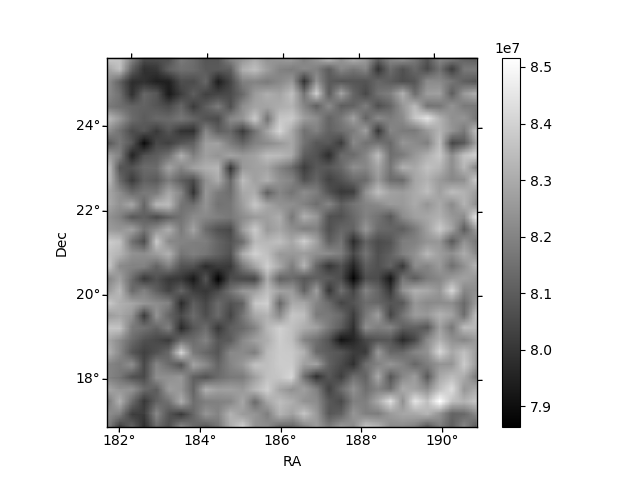
Histogram calculated using DETX and DETY for each event in the final _common_clean file
| Quadrant A |  |
 |
Quadrant B |
|---|---|---|---|
| Quadrant D | 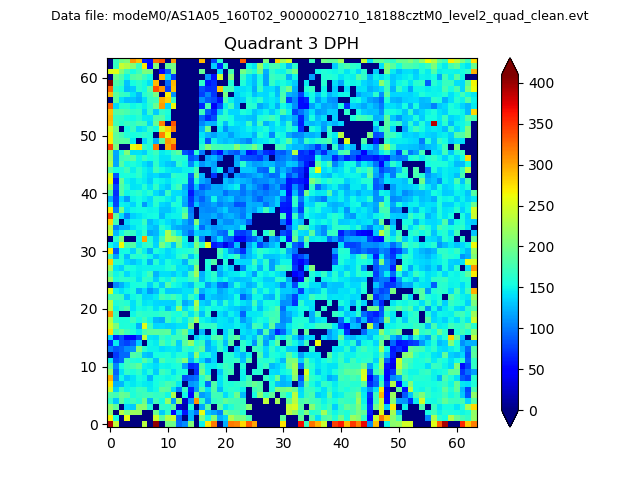 |
 |
Quadrant C |
| Plot type | Count rate plots | Images |
|---|---|---|
| Comparison with Poisson distribution Blue bars denote a histogram of data divided into 1 sec bins. Red curve is a Poisson curve with rate = median count rate of data. |
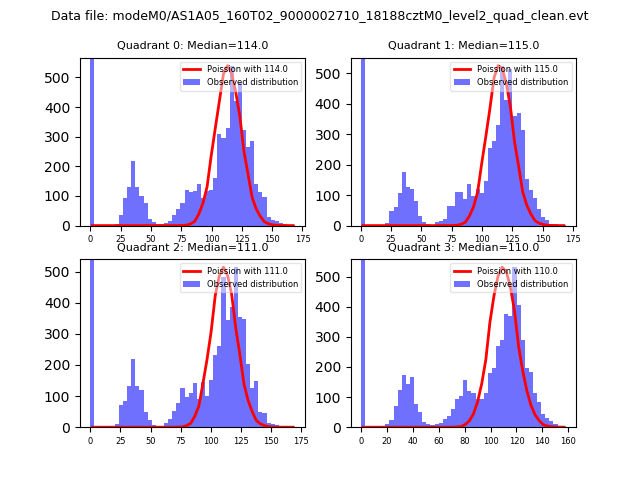 |
 |
| Quadrant-wise count rates Data is divided into 100 sec bins |
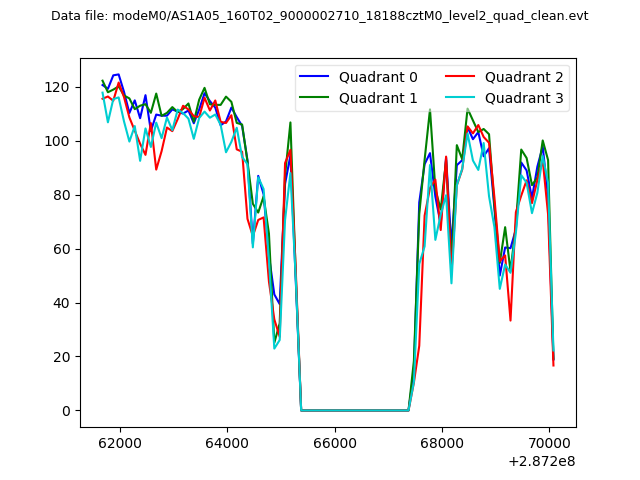 |
|
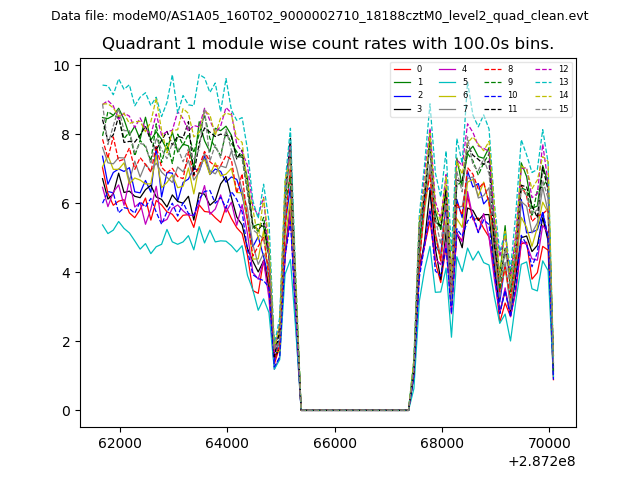
| Module-wise count rates for Quadrant A Data is divided into 100 sec bins |
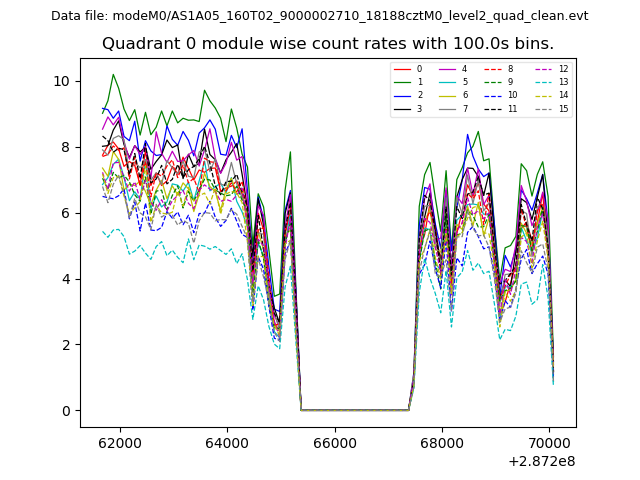 |
 |
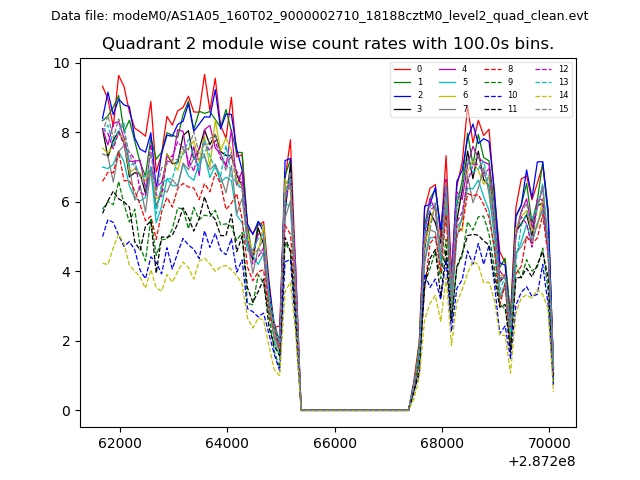
| Module-wise count rates for Quadrant B Data is divided into 100 sec bins |
 |
 |
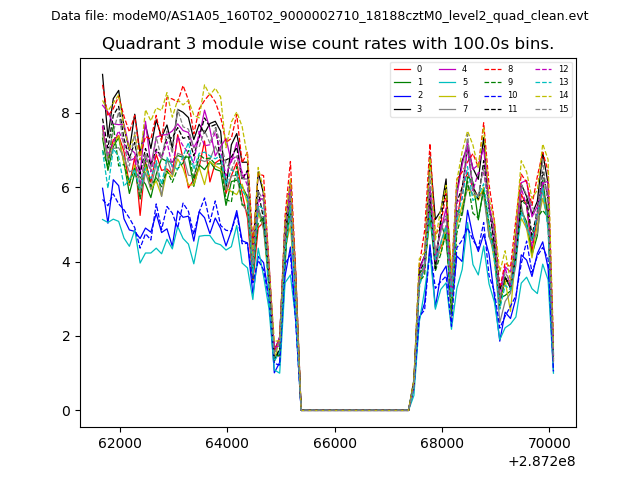
| Module-wise count rates for Quadrant C Data is divided into 100 sec bins |
 |
 |
| Module-wise count rates for Quadrant D Data is divided into 100 sec bins |
 |
 |
| Parameter | Plot |
|---|---|
| CZT HV Monitor | 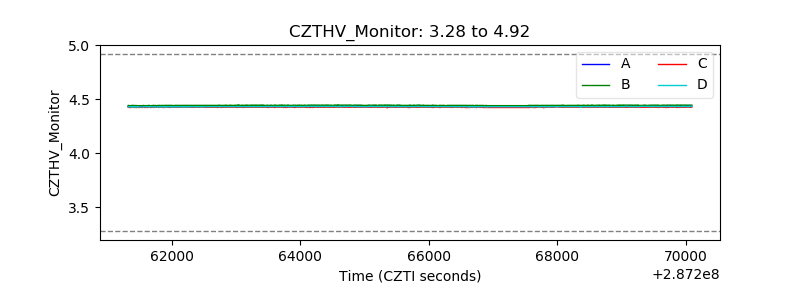 |
| D_VDD | 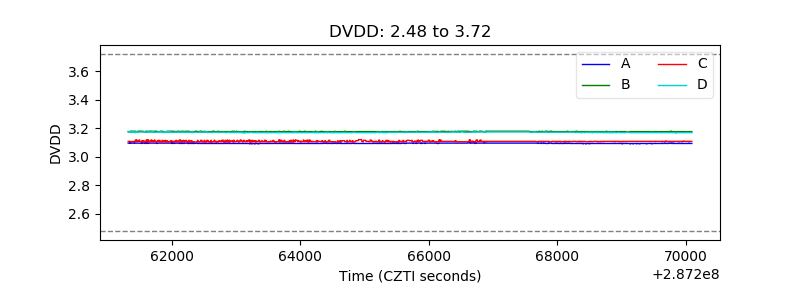 |
| Temperature 1 | 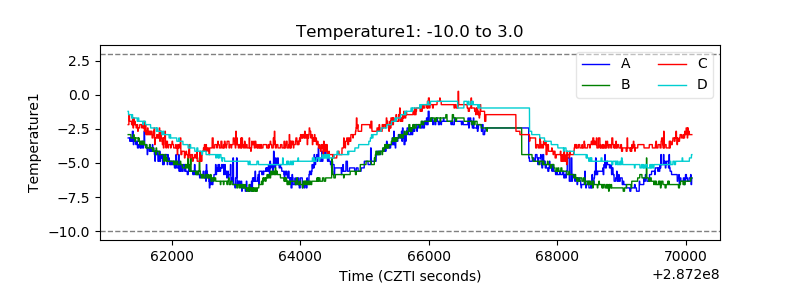 |
| Veto HV Monitor | 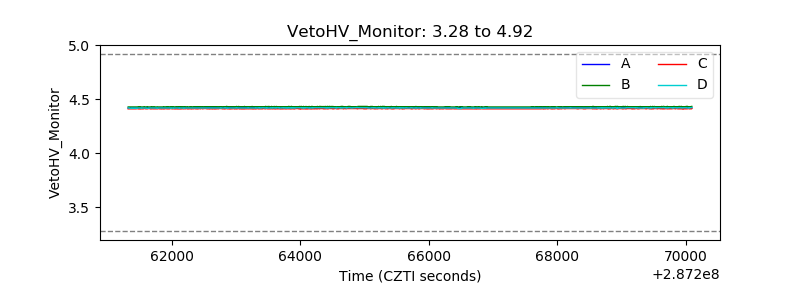 |
| Veto LLD | 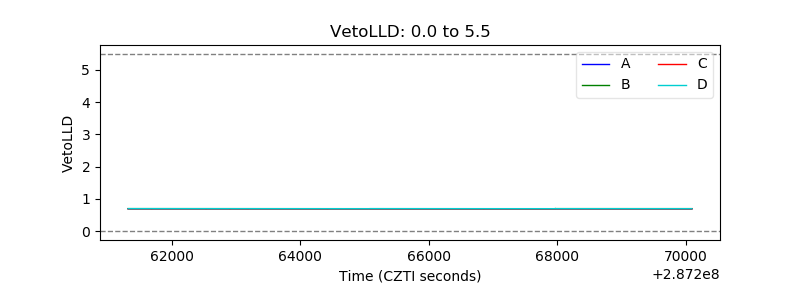 |
| Alpha Counter | 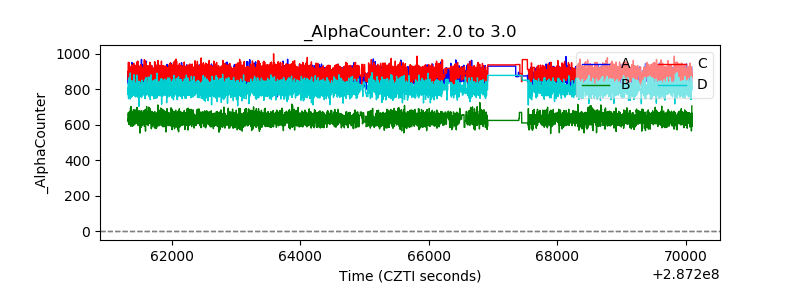 |
| _CPM_Rate | 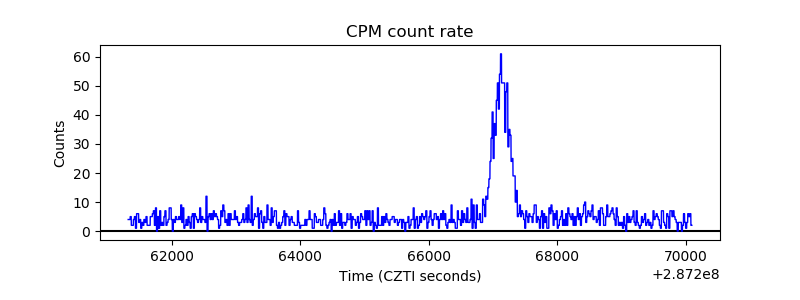 |
| CZT Counter | 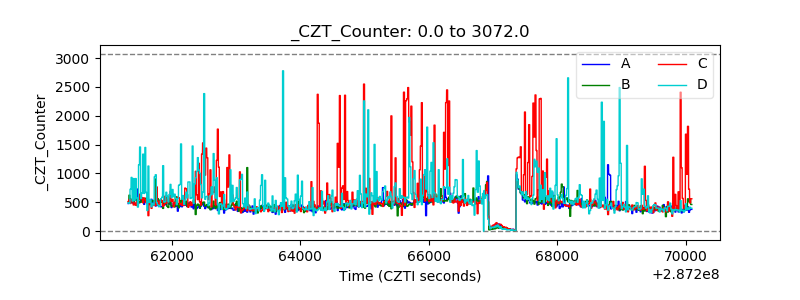 |
| +2.5 Volts monitor |  |
| +5 Volts monitor |  |
| _ROLL_ROT | 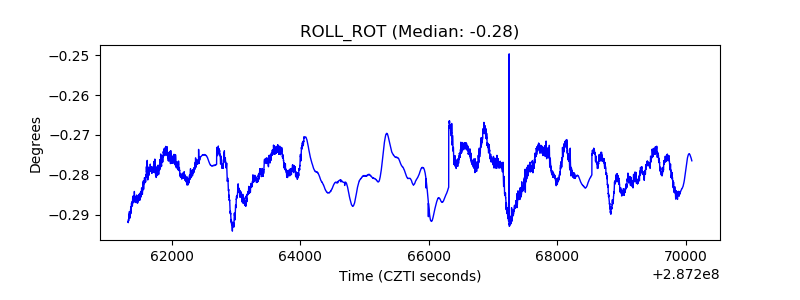 |
| _Roll_DEC | 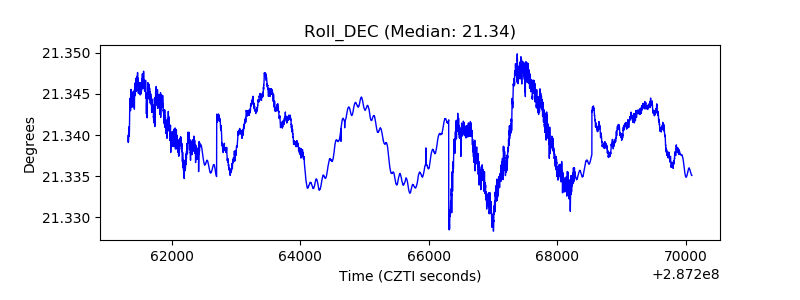 |
| _Roll_RA | 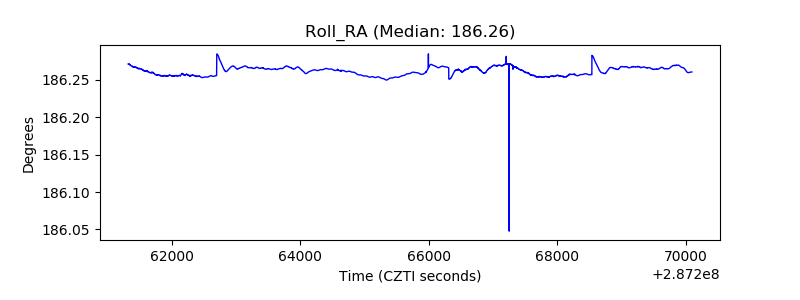 |
| Veto Counter | 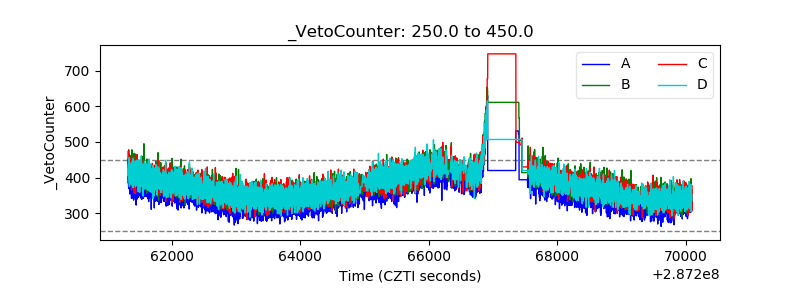 |