| Param | Original file | Final file |
|---|---|---|
| Filename | modeM0/AS1A05_160T02_9000002710_18189cztM0_level2.evt | modeM0/AS1A05_160T02_9000002710_18189cztM0_level2_quad_clean.evt |
| Size (bytes) | 1,223,709,120 | 203,198,400 |
| Size | 1.1 GB | 193.8 MB |
| Events in quadrant A | 7,652,028 | 1,263,803 |
| Events in quadrant B | 7,992,600 | 1,285,805 |
| Events in quadrant C | 9,373,046 | 1,246,791 |
| Events in quadrant D | 10,919,164 | 1,211,646 |
| Mode SS | |||
|---|---|---|---|
| Quadrant | BADHDUFLAG | Total packets | Discarded packets |
| A | 0 | 342 | 0 |
| B | 0 | 342 | 0 |
| C | 0 | 342 | 0 |
| D | 0 | 342 | 0 |
| Mode M9 | |||
|---|---|---|---|
| Quadrant | BADHDUFLAG | Total packets | Discarded packets |
| A | 0 | 22 | 0 |
| B | 0 | 22 | 0 |
| C | 0 | 22 | 0 |
| D | 0 | 22 | 0 |
| Mode M0 | |||
|---|---|---|---|
| Quadrant | BADHDUFLAG | Total packets | Discarded packets |
| A | 0 | 33991 | 3 |
| B | 0 | 34771 | 3 |
| C | 0 | 39019 | 3 |
| D | 0 | 43764 | 3 |
| Quadrant | Total seconds | Saturated seconds | Saturation percentage |
|---|---|---|---|
| A | 16608 | 110 | 0.662331% |
| B | 16609 | 150 | 0.903125% |
| C | 16609 | 640 | 3.853333% |
| D | 16609 | 598 | 3.600458% |
Noise dominated data is calculated using 1-second bins in cleaned event files. If a bin has >2000 counts, and if more than 50% of those come from <1% of pixels, then it is considered to be noise-dominated and hence unusable.
| Quadrant | # 1 sec bins | Bins with >0 counts | Bins with >2000 counts | High rate bins dominated by noise | Noise dominated (total time) | Noise dominated (detector-on time) | Marked lightcurve |
|---|---|---|---|---|---|---|---|
| A | 18943 | 16611 | 1 | 1 | 0.01% | 0.01% | 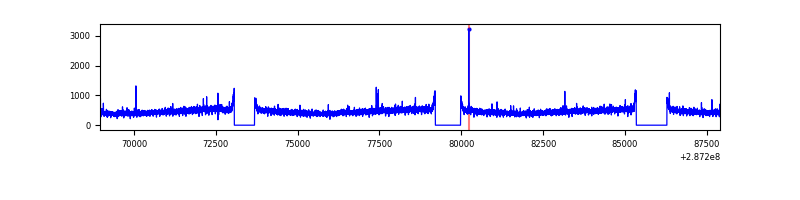 |
| B | 18944 | 16612 | 11 | 11 | 0.06% | 0.07% | 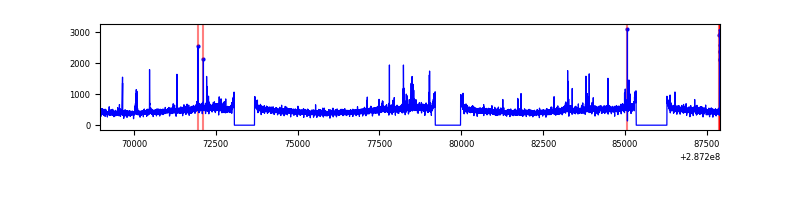 |
| C | 18944 | 16612 | 201 | 201 | 1.06% | 1.21% | 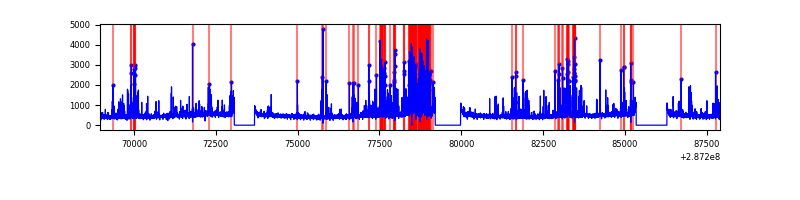 |
| D | 18944 | 16612 | 428 | 428 | 2.26% | 2.58% | 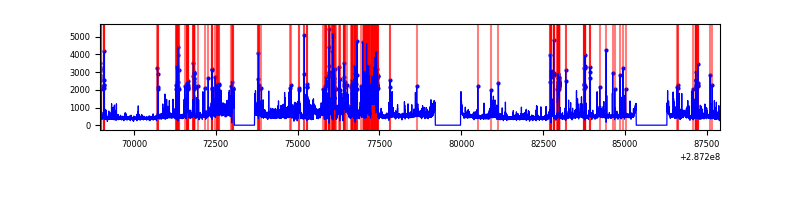 |
Top three noisy pixels from each quadrant. If the there are fewer than three noisy pixels in the level2.evt file, extra rows are filled as -1
| Pixel properties | Quadrant properties | ||||||
|---|---|---|---|---|---|---|---|
| Quadrant | DetID | PixID | Counts | Sigma | Mean | Median | Sigma |
| A | 4 | 2 | 39062 | 93.12 | 1977 | 1932 | 398.7 |
| A | 15 | 174 | 17939 | 40.14 | 1977 | 1932 | 398.7 |
| A | 0 | 226 | 17011 | 37.82 | 1977 | 1932 | 398.7 |
| B | 0 | 229 | 90856 | 235.84 | 1970 | 1919 | 377.1 |
| B | 12 | 111 | 45652 | 115.97 | 1970 | 1919 | 377.1 |
| B | 0 | 189 | 44455 | 112.79 | 1970 | 1919 | 377.1 |
| C | 4 | 254 | 1776342 | 4044.92 | 1872 | 1882 | 438.7 |
| C | 14 | 238 | 290224 | 657.28 | 1872 | 1882 | 438.7 |
| C | 13 | 61 | 13301 | 26.03 | 1872 | 1882 | 438.7 |
| D | 7 | 238 | 1521518 | 3296.72 | 1899 | 1844 | 461.0 |
| D | 5 | 222 | 1041534 | 2255.46 | 1899 | 1844 | 461.0 |
| D | 8 | 230 | 619877 | 1340.73 | 1899 | 1844 | 461.0 |
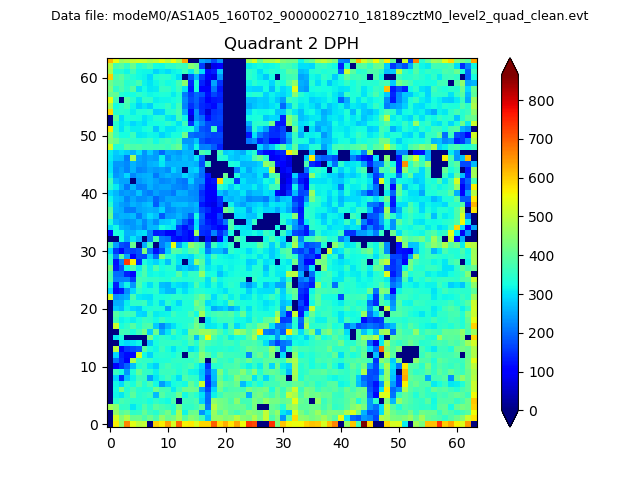
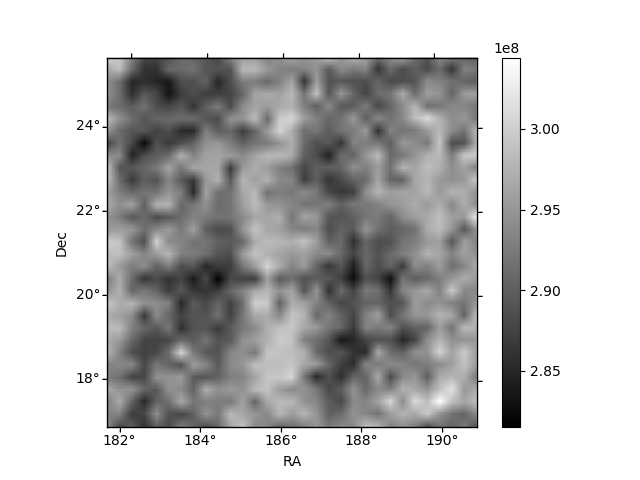
Histogram calculated using DETX and DETY for each event in the final _common_clean file
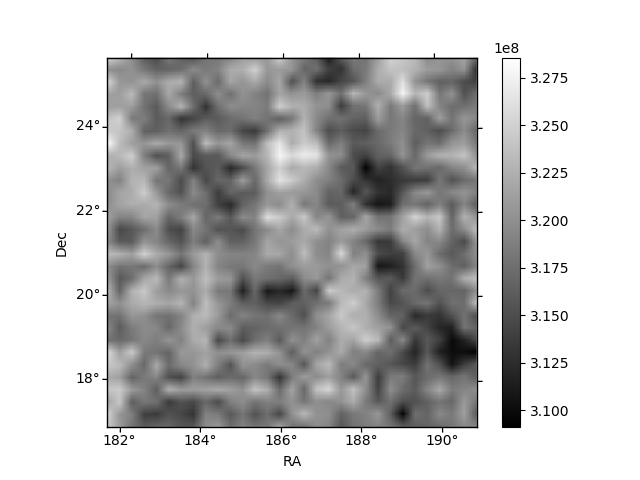
| Quadrant A | 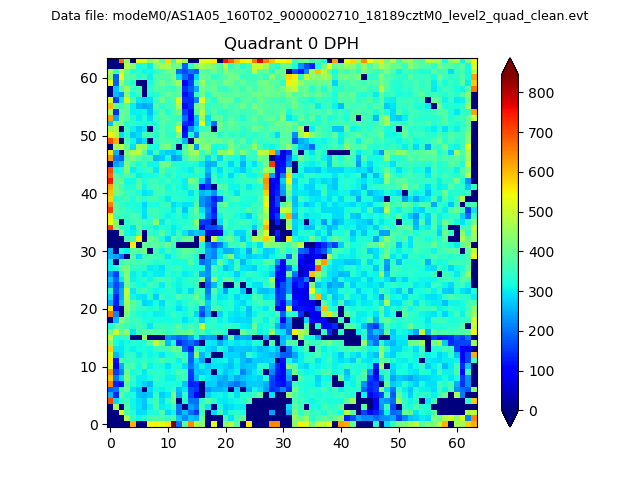 |
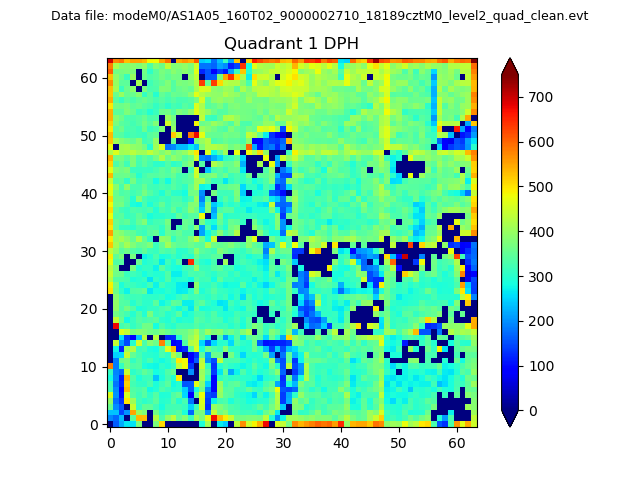 |
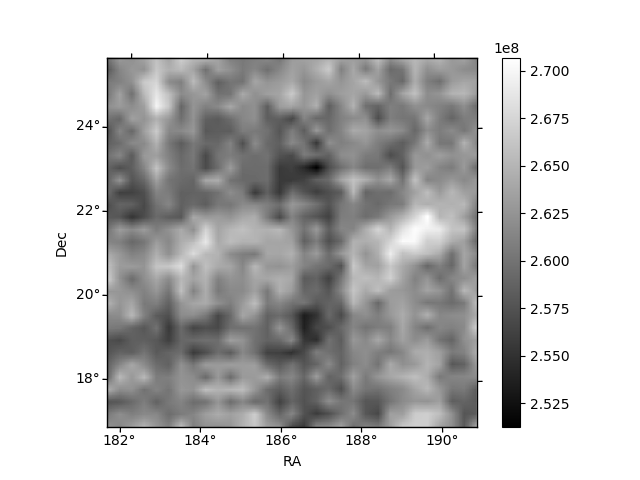
Quadrant B |
|---|---|---|---|
| Quadrant D | 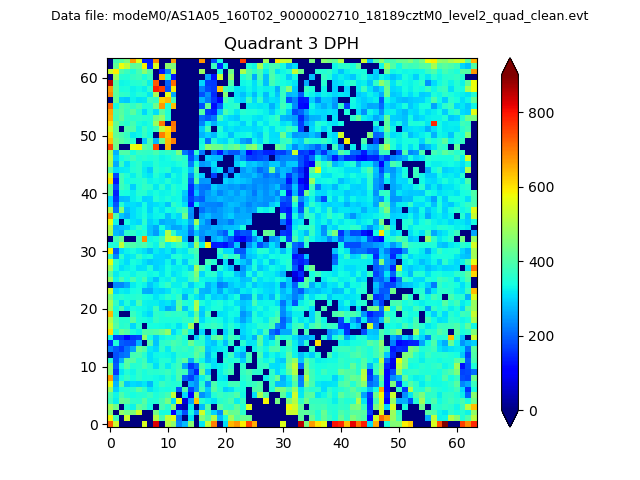 |
 |
Quadrant C |
| Plot type | Count rate plots | Images |
|---|---|---|
| Comparison with Poisson distribution Blue bars denote a histogram of data divided into 1 sec bins. Red curve is a Poisson curve with rate = median count rate of data. |
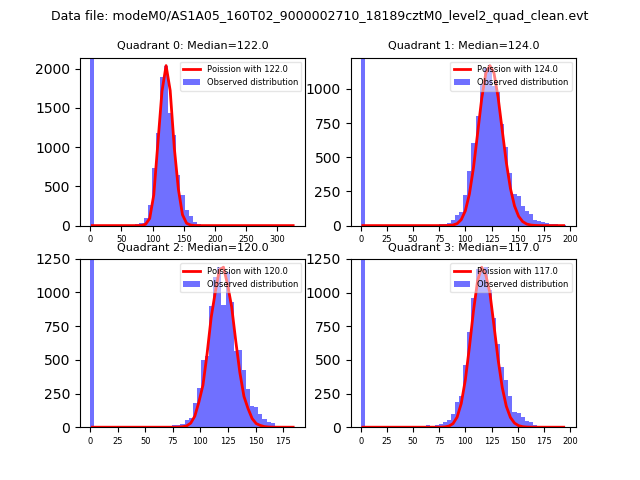 |
 |
| Quadrant-wise count rates Data is divided into 100 sec bins |
 |
|
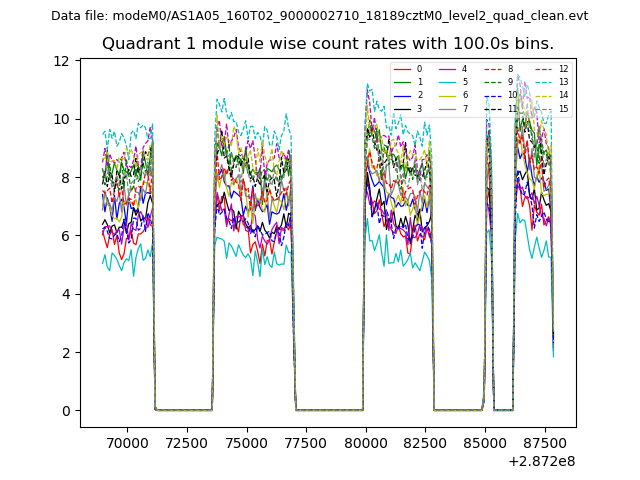
| Module-wise count rates for Quadrant A Data is divided into 100 sec bins |
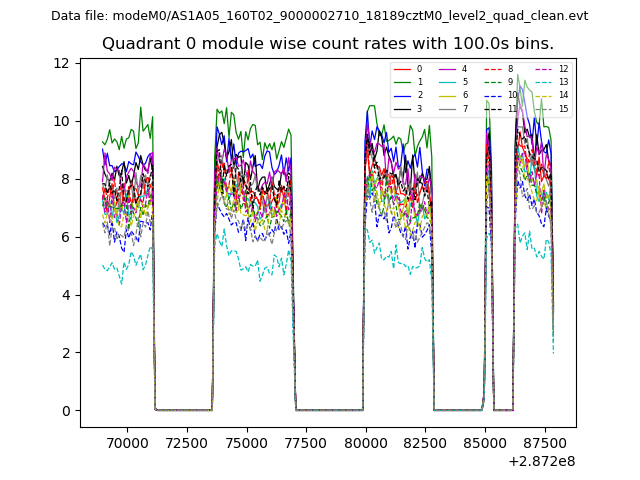 |
 |
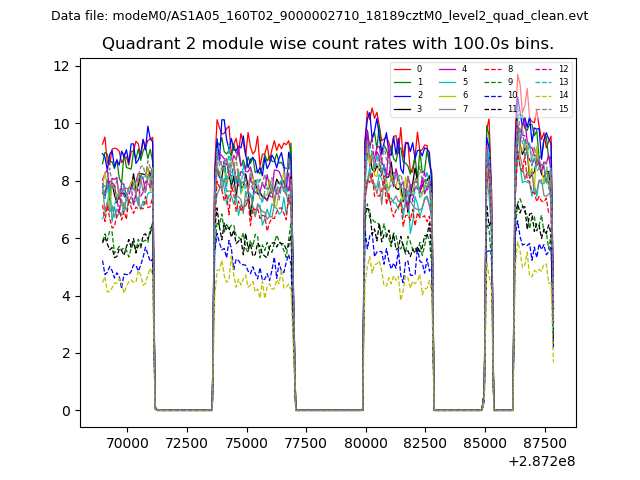
| Module-wise count rates for Quadrant B Data is divided into 100 sec bins |
 |
 |
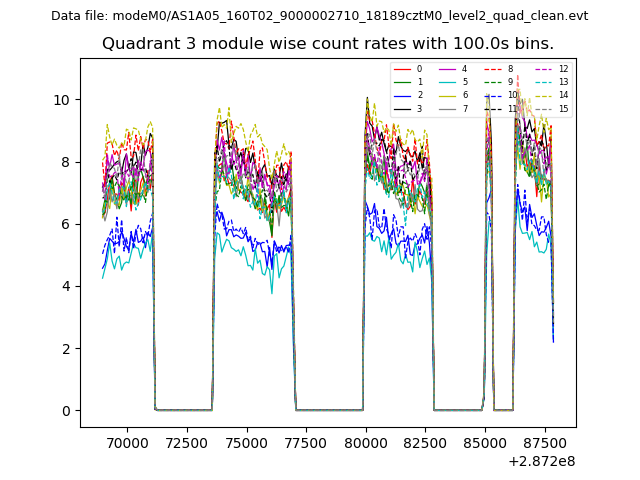
| Module-wise count rates for Quadrant C Data is divided into 100 sec bins |
 |
 |
| Module-wise count rates for Quadrant D Data is divided into 100 sec bins |
 |
 |
| Parameter | Plot |
|---|---|
| CZT HV Monitor | 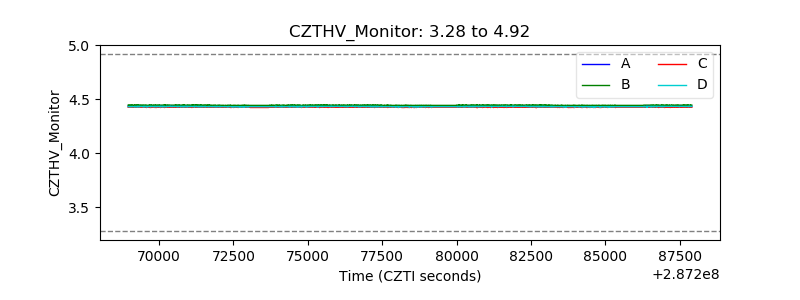 |
| D_VDD | 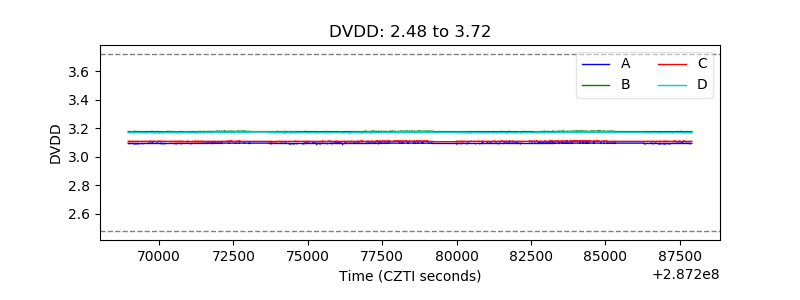 |
| Temperature 1 | 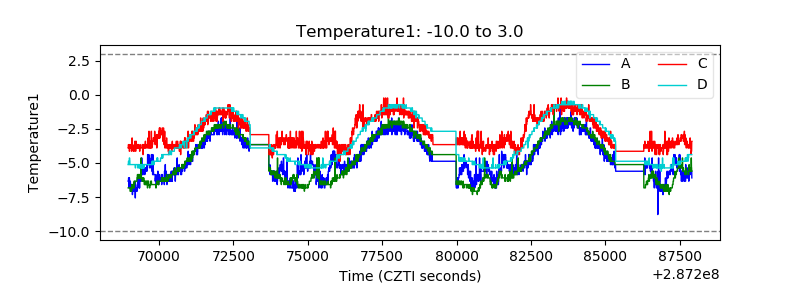 |
| Veto HV Monitor |  |
| Veto LLD |  |
| Alpha Counter | 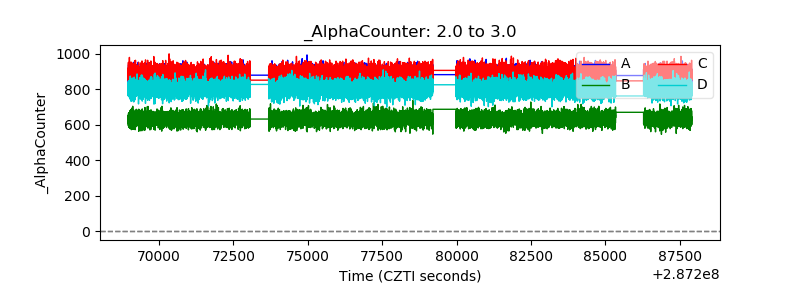 |
| _CPM_Rate | 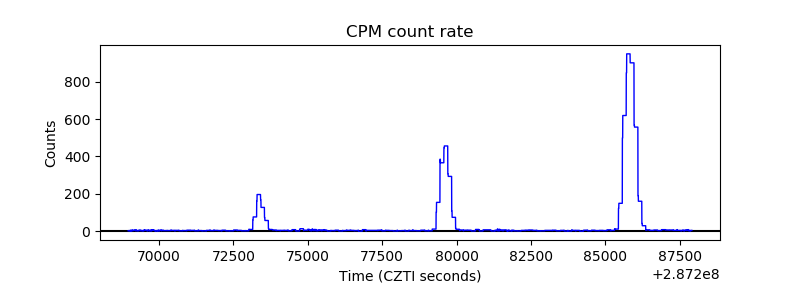 |
| CZT Counter | 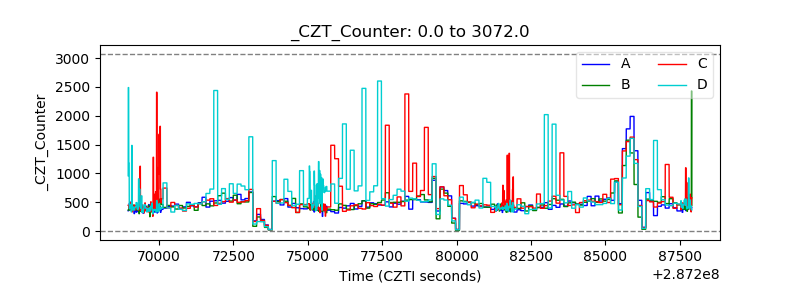 |
| +2.5 Volts monitor |  |
| +5 Volts monitor |  |
| _ROLL_ROT | 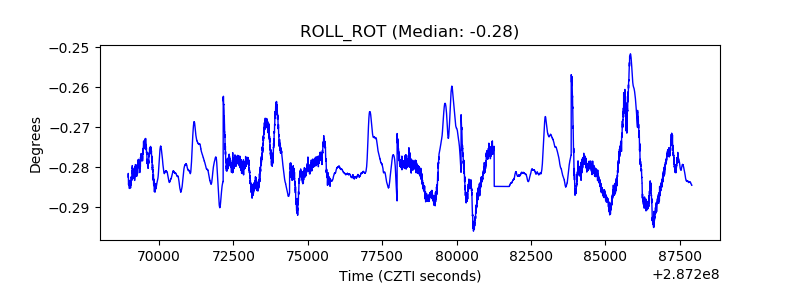 |
| _Roll_DEC | 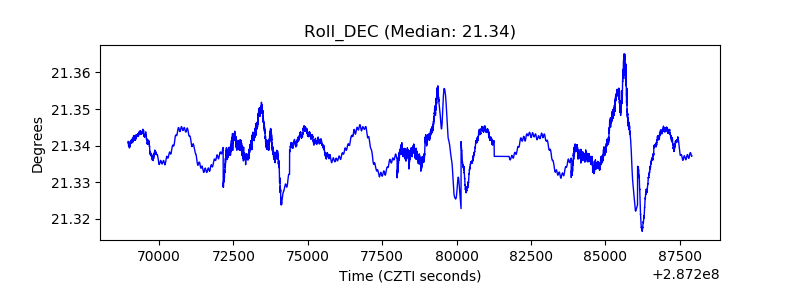 |
| _Roll_RA | 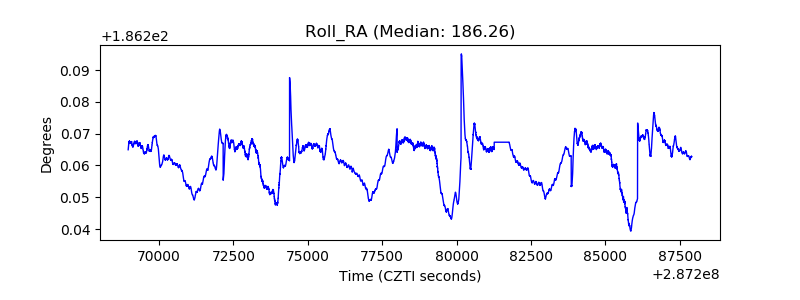 |
| Veto Counter |  |