| Param | Original file | Final file |
|---|---|---|
| Filename | modeM0/AS1A05_160T02_9000002710_18191cztM0_level2.evt | modeM0/AS1A05_160T02_9000002710_18191cztM0_level2_quad_clean.evt |
| Size (bytes) | 494,861,760 | 96,667,200 |
| Size | 471.9 MB | 92.2 MB |
| Events in quadrant A | 3,359,316 | 622,344 |
| Events in quadrant B | 3,388,899 | 631,847 |
| Events in quadrant C | 3,737,529 | 605,411 |
| Events in quadrant D | 4,041,170 | 595,829 |
| Mode SS | |||
|---|---|---|---|
| Quadrant | BADHDUFLAG | Total packets | Discarded packets |
| A | 0 | 140 | 0 |
| B | 0 | 140 | 0 |
| C | 0 | 140 | 0 |
| D | 0 | 140 | 0 |
| Mode M9 | |||
|---|---|---|---|
| Quadrant | BADHDUFLAG | Total packets | Discarded packets |
| A | 0 | 20 | 0 |
| B | 0 | 20 | 0 |
| C | 0 | 20 | 0 |
| D | 0 | 20 | 0 |
| Mode M0 | |||
|---|---|---|---|
| Quadrant | BADHDUFLAG | Total packets | Discarded packets |
| A | 0 | 14306 | 2 |
| B | 0 | 14269 | 2 |
| C | 0 | 15460 | 2 |
| D | 0 | 16568 | 2 |
| Quadrant | Total seconds | Saturated seconds | Saturation percentage |
|---|---|---|---|
| A | 6770 | 118 | 1.742984% |
| B | 6770 | 90 | 1.329394% |
| C | 6770 | 187 | 2.762186% |
| D | 6771 | 118 | 1.742726% |
Noise dominated data is calculated using 1-second bins in cleaned event files. If a bin has >2000 counts, and if more than 50% of those come from <1% of pixels, then it is considered to be noise-dominated and hence unusable.
| Quadrant | # 1 sec bins | Bins with >0 counts | Bins with >2000 counts | High rate bins dominated by noise | Noise dominated (total time) | Noise dominated (detector-on time) | Marked lightcurve |
|---|---|---|---|---|---|---|---|
| A | 8815 | 6772 | 37 | 37 | 0.42% | 0.55% | 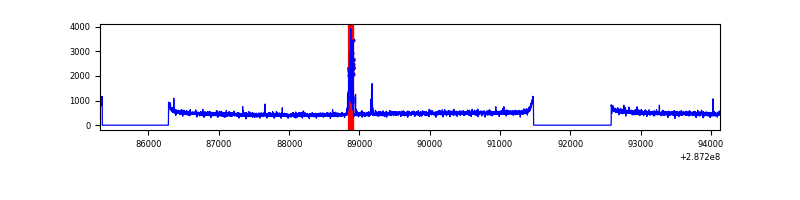 |
| B | 8815 | 6772 | 16 | 16 | 0.18% | 0.24% | 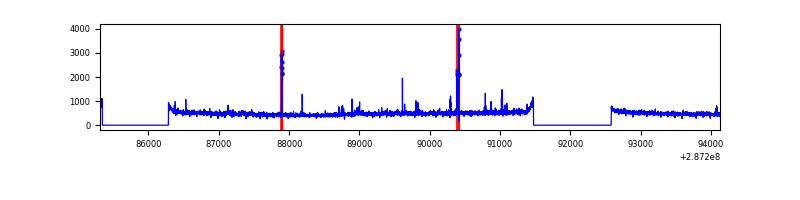 |
| C | 8815 | 6772 | 35 | 35 | 0.40% | 0.52% | 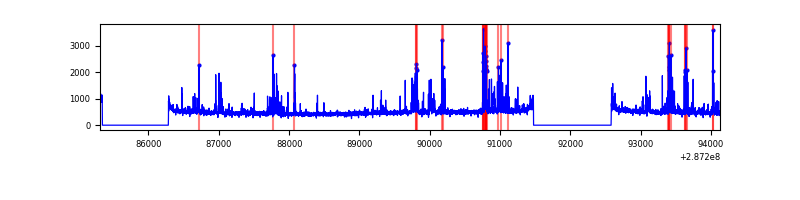 |
| D | 8816 | 6773 | 57 | 57 | 0.65% | 0.84% | 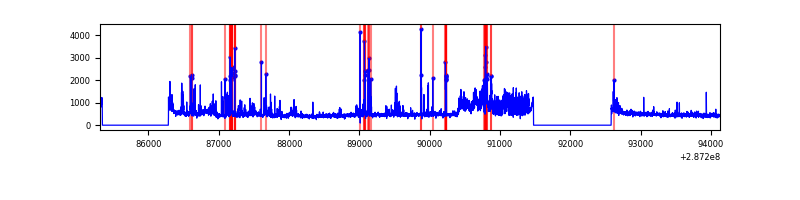 |
Top three noisy pixels from each quadrant. If the there are fewer than three noisy pixels in the level2.evt file, extra rows are filled as -1
| Pixel properties | Quadrant properties | ||||||
|---|---|---|---|---|---|---|---|
| Quadrant | DetID | PixID | Counts | Sigma | Mean | Median | Sigma |
| A | 15 | 174 | 154306 | 912.86 | 832 | 813 | 168.1 |
| A | 0 | 226 | 7273 | 38.42 | 832 | 813 | 168.1 |
| A | 4 | 2 | 6726 | 35.17 | 832 | 813 | 168.1 |
| B | 0 | 229 | 76140 | 474.11 | 829 | 809 | 158.9 |
| B | 7 | 220 | 40736 | 251.29 | 829 | 809 | 158.9 |
| B | 12 | 111 | 18671 | 112.42 | 829 | 809 | 158.9 |
| C | 4 | 254 | 529591 | 2849.65 | 790 | 795 | 185.6 |
| C | 14 | 238 | 124094 | 664.45 | 790 | 795 | 185.6 |
| C | 13 | 61 | 5637 | 26.09 | 790 | 795 | 185.6 |
| D | 5 | 222 | 458524 | 2318.5 | 805 | 782 | 197.4 |
| D | 7 | 238 | 415534 | 2100.75 | 805 | 782 | 197.4 |
| D | 10 | 70 | 46498 | 231.56 | 805 | 782 | 197.4 |
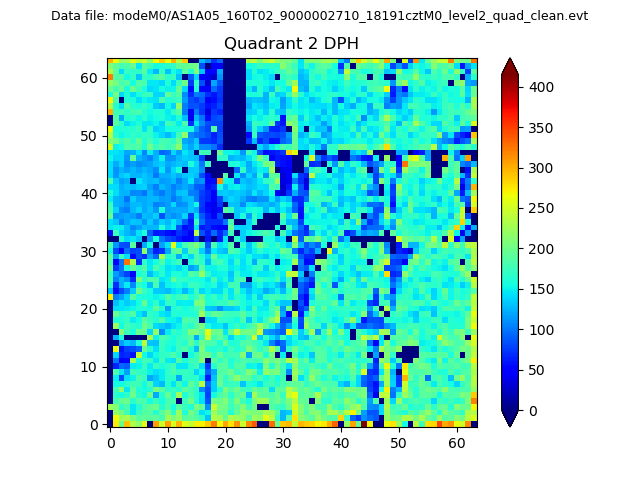
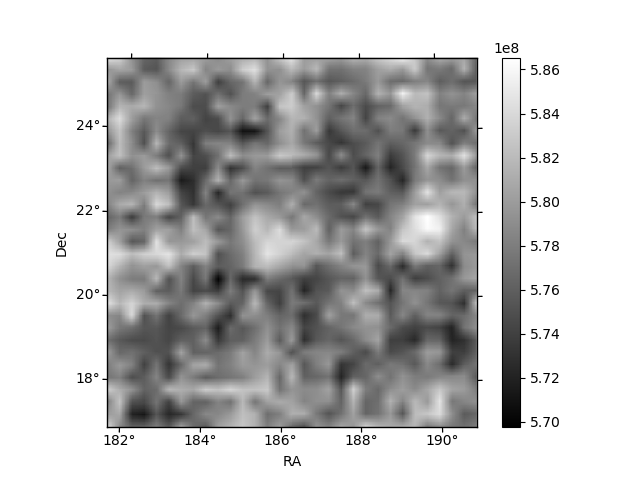
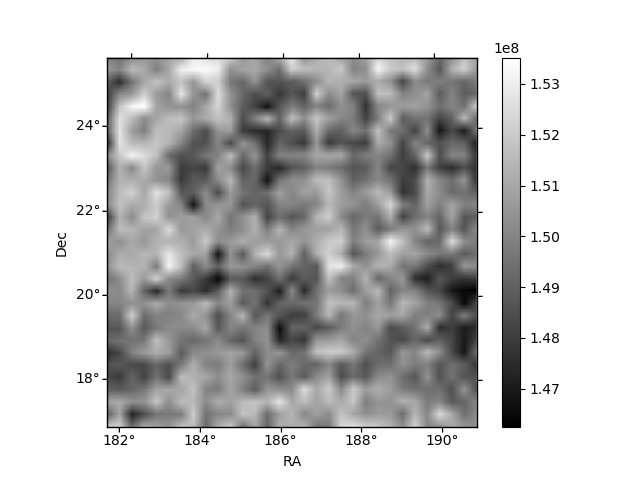
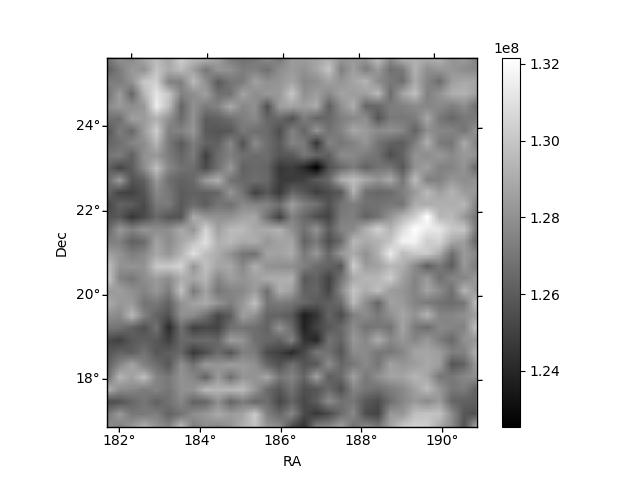
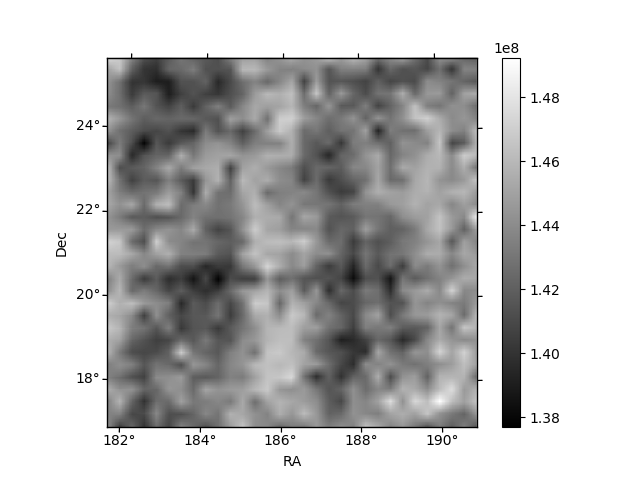
Histogram calculated using DETX and DETY for each event in the final _common_clean file
| Quadrant A | 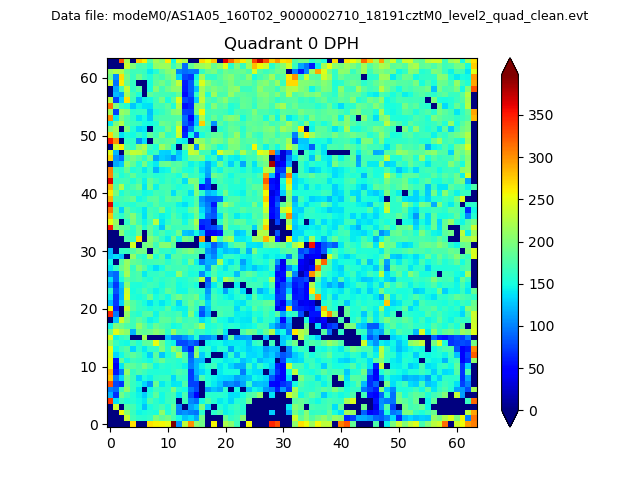 |
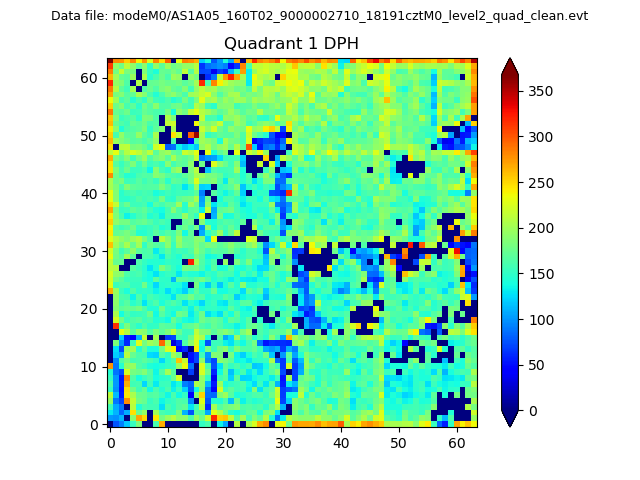 |
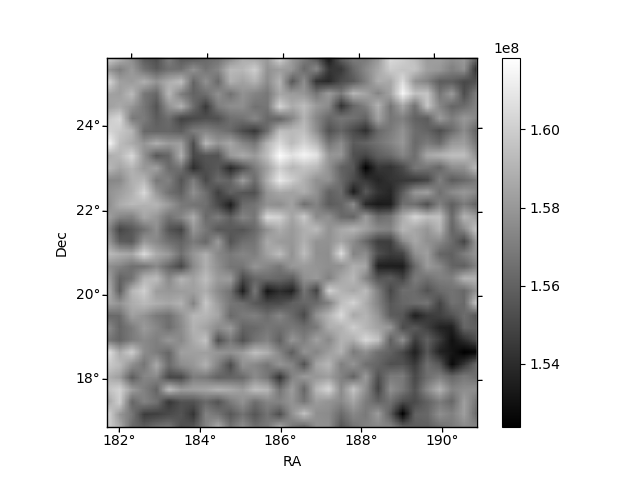
Quadrant B |
|---|---|---|---|
| Quadrant D | 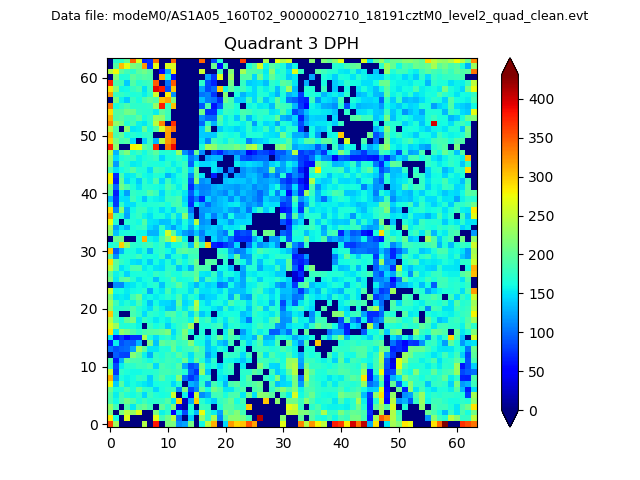 |
 |
Quadrant C |
| Plot type | Count rate plots | Images |
|---|---|---|
| Comparison with Poisson distribution Blue bars denote a histogram of data divided into 1 sec bins. Red curve is a Poisson curve with rate = median count rate of data. |
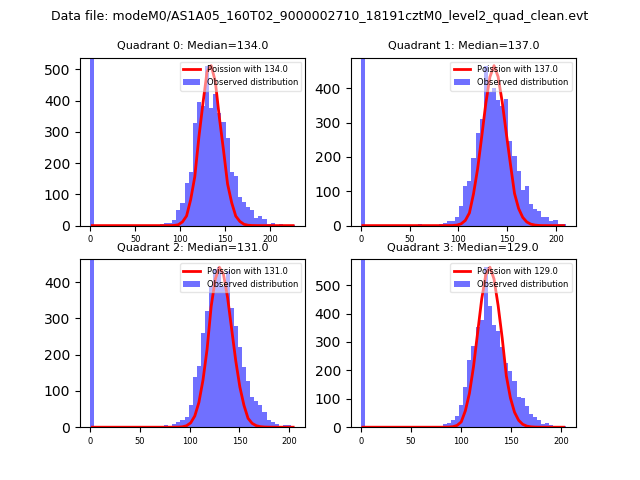 |
 |
| Quadrant-wise count rates Data is divided into 100 sec bins |
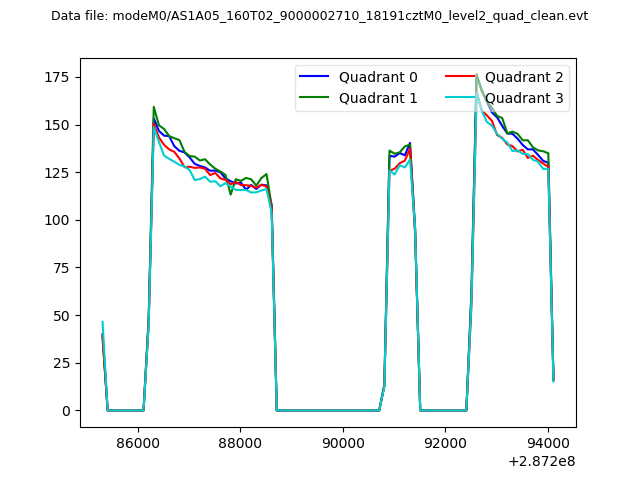 |
|
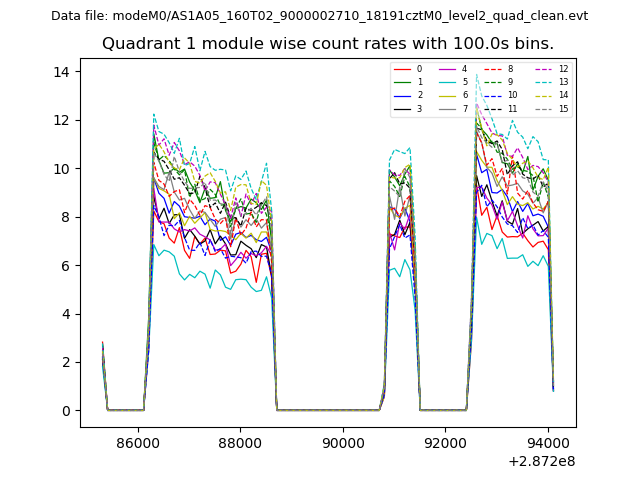
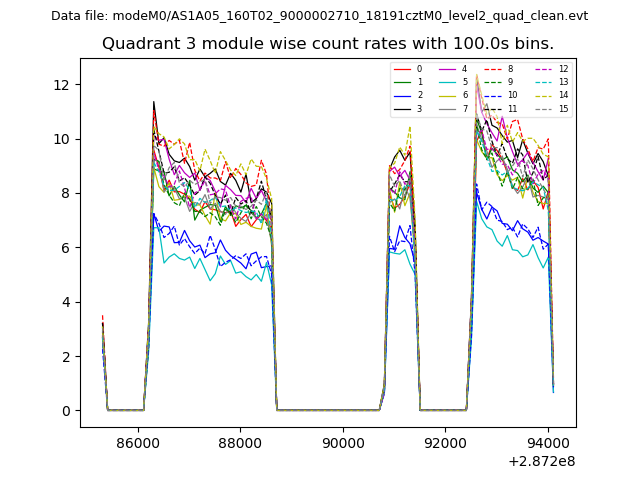
| Module-wise count rates for Quadrant A Data is divided into 100 sec bins |
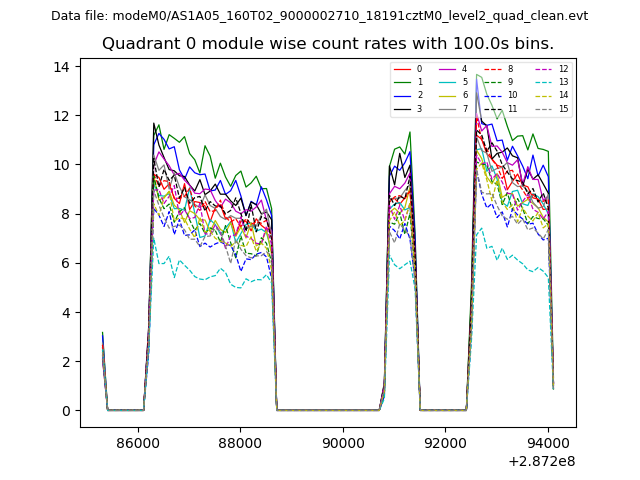 |
 |
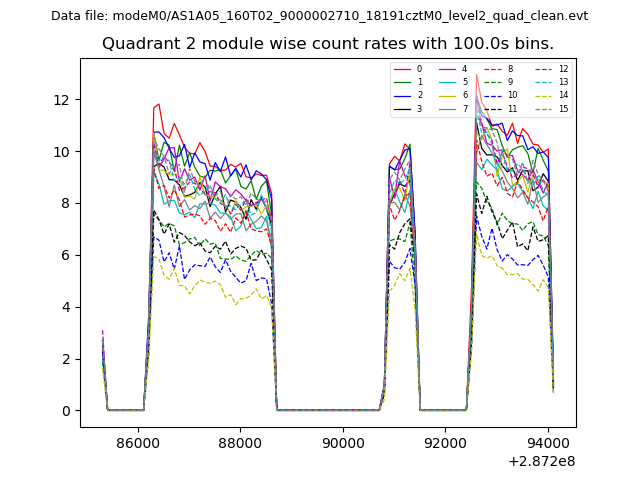
| Module-wise count rates for Quadrant B Data is divided into 100 sec bins |
 |
 |
| Module-wise count rates for Quadrant C Data is divided into 100 sec bins |
 |
 |
| Module-wise count rates for Quadrant D Data is divided into 100 sec bins |
 |
 |
| Parameter | Plot |
|---|---|
| CZT HV Monitor | 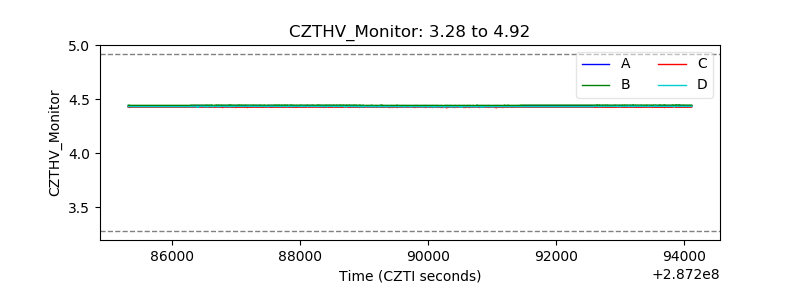 |
| D_VDD | 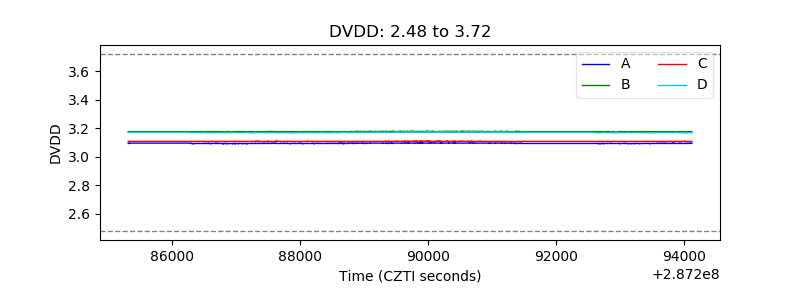 |
| Temperature 1 | 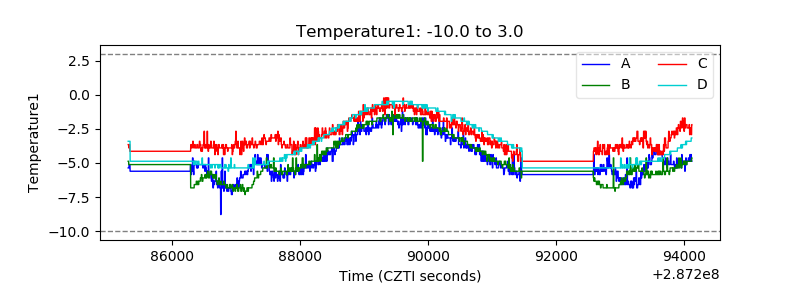 |
| Veto HV Monitor | 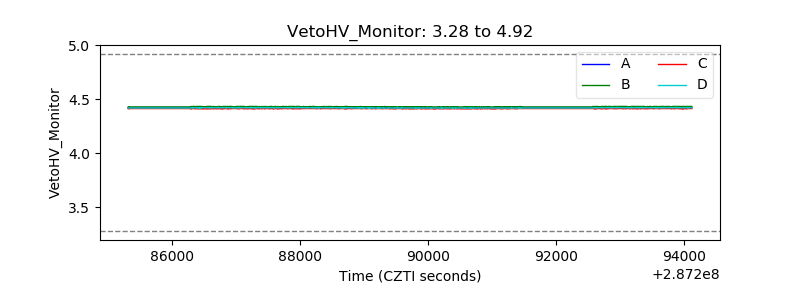 |
| Veto LLD | 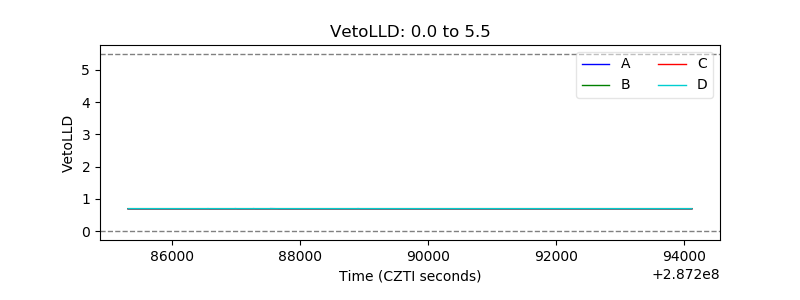 |
| Alpha Counter | 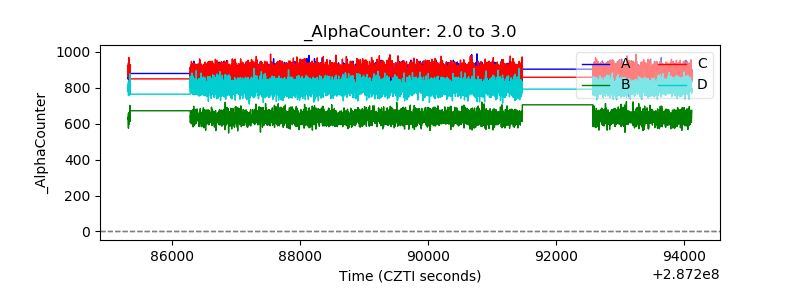 |
| _CPM_Rate | 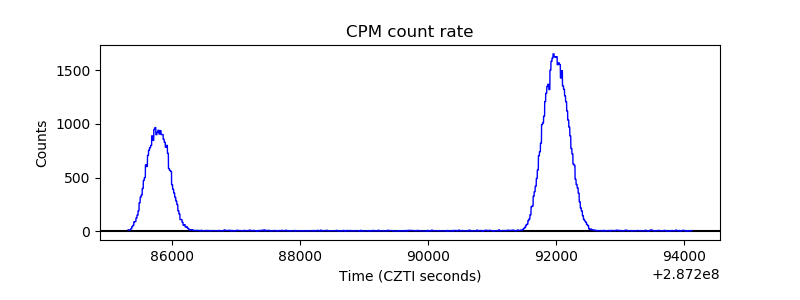 |
| CZT Counter | 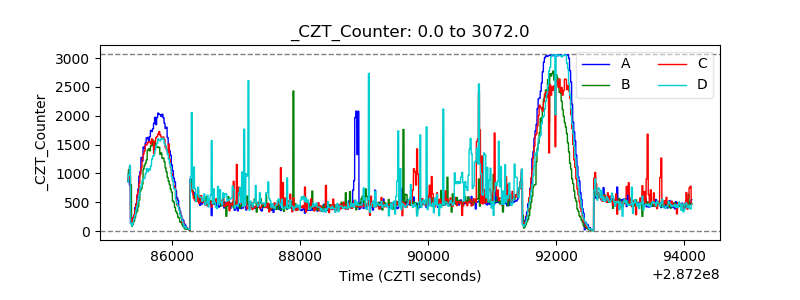 |
| +2.5 Volts monitor |  |
| +5 Volts monitor |  |
| _ROLL_ROT | 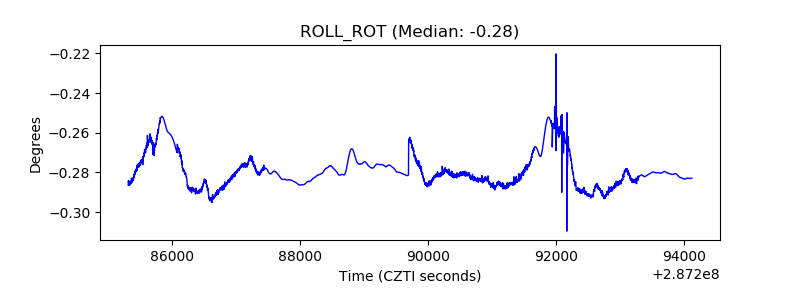 |
| _Roll_DEC | 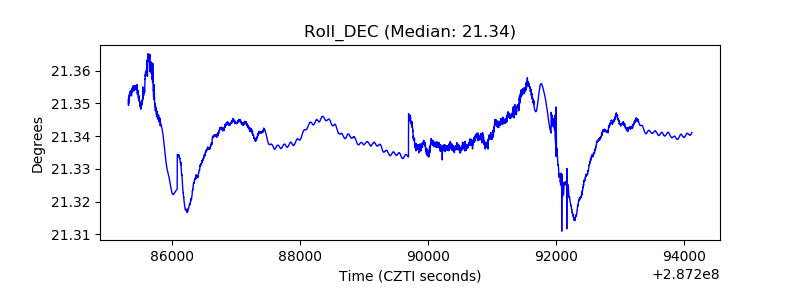 |
| _Roll_RA | 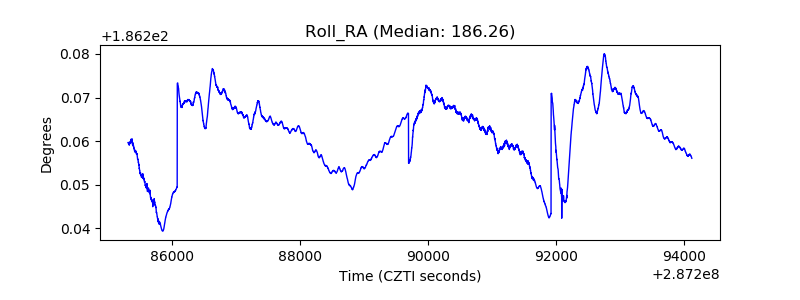 |
| Veto Counter | 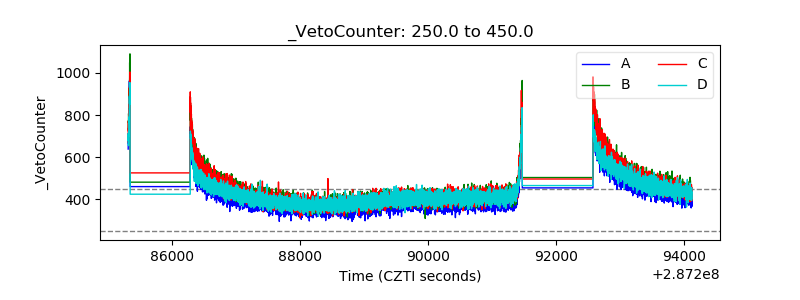 |