| Param | Original file | Final file |
|---|---|---|
| Filename | modeM0/AS1A05_160T02_9000002710_18192cztM0_level2.evt | modeM0/AS1A05_160T02_9000002710_18192cztM0_level2_quad_clean.evt |
| Size (bytes) | 2,475,423,360 | 413,311,680 |
| Size | 2.3 GB | 394.2 MB |
| Events in quadrant A | 15,570,457 | 2,601,427 |
| Events in quadrant B | 16,061,928 | 2,641,791 |
| Events in quadrant C | 19,390,035 | 2,535,753 |
| Events in quadrant D | 21,732,327 | 2,484,577 |
| Mode SS | |||
|---|---|---|---|
| Quadrant | BADHDUFLAG | Total packets | Discarded packets |
| A | 0 | 672 | 0 |
| B | 0 | 672 | 0 |
| C | 0 | 672 | 0 |
| D | 0 | 672 | 0 |
| Mode M9 | |||
|---|---|---|---|
| Quadrant | BADHDUFLAG | Total packets | Discarded packets |
| A | 0 | 49 | 0 |
| B | 0 | 49 | 0 |
| C | 0 | 49 | 0 |
| D | 0 | 49 | 0 |
| Mode M0 | |||
|---|---|---|---|
| Quadrant | BADHDUFLAG | Total packets | Discarded packets |
| A | 0 | 67833 | 6 |
| B | 0 | 68896 | 6 |
| C | 0 | 79324 | 6 |
| D | 0 | 87106 | 6 |
| Quadrant | Total seconds | Saturated seconds | Saturation percentage |
|---|---|---|---|
| A | 32806 | 253 | 0.771200% |
| B | 32806 | 288 | 0.877888% |
| C | 32806 | 1491 | 4.544900% |
| D | 32806 | 991 | 3.020789% |
Noise dominated data is calculated using 1-second bins in cleaned event files. If a bin has >2000 counts, and if more than 50% of those come from <1% of pixels, then it is considered to be noise-dominated and hence unusable.
| Quadrant | # 1 sec bins | Bins with >0 counts | Bins with >2000 counts | High rate bins dominated by noise | Noise dominated (total time) | Noise dominated (detector-on time) | Marked lightcurve |
|---|---|---|---|---|---|---|---|
| A | 37911 | 32812 | 38 | 38 | 0.10% | 0.12% | 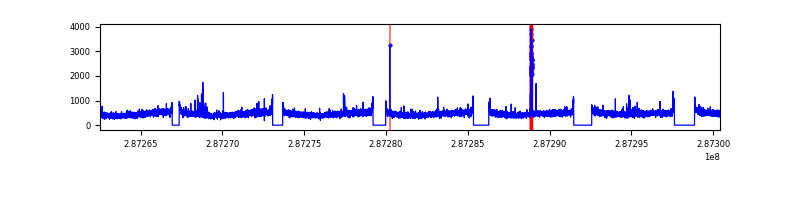 |
| B | 37911 | 32812 | 23 | 23 | 0.06% | 0.07% | 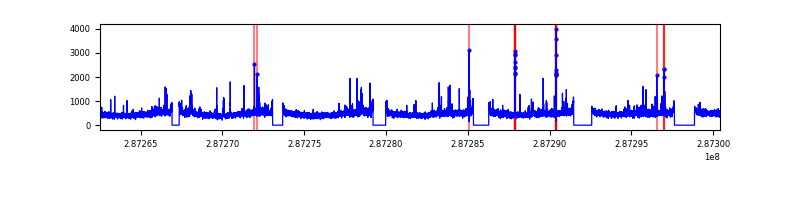 |
| C | 37911 | 32812 | 550 | 550 | 1.45% | 1.68% | 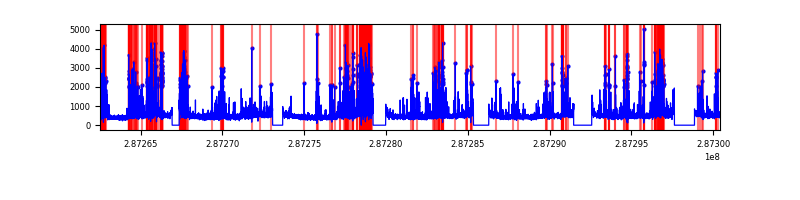 |
| D | 37911 | 32812 | 692 | 692 | 1.83% | 2.11% | 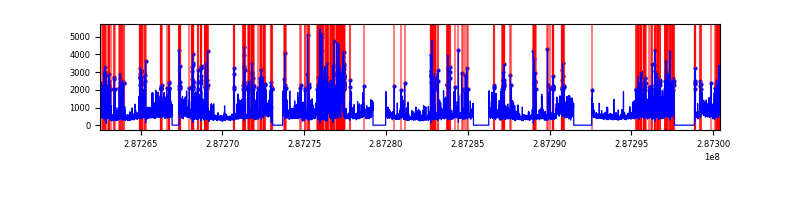 |
Top three noisy pixels from each quadrant. If the there are fewer than three noisy pixels in the level2.evt file, extra rows are filled as -1
| Pixel properties | Quadrant properties | ||||||
|---|---|---|---|---|---|---|---|
| Quadrant | DetID | PixID | Counts | Sigma | Mean | Median | Sigma |
| A | 15 | 174 | 223437 | 273.81 | 3978 | 3891 | 801.8 |
| A | 4 | 2 | 64246 | 75.27 | 3978 | 3891 | 801.8 |
| A | 0 | 226 | 34652 | 38.36 | 3978 | 3891 | 801.8 |
| B | 0 | 229 | 154877 | 200.95 | 3957 | 3856 | 751.5 |
| B | 7 | 220 | 123379 | 159.04 | 3957 | 3856 | 751.5 |
| B | 0 | 189 | 105334 | 135.03 | 3957 | 3856 | 751.5 |
| C | 4 | 254 | 4194166 | 4795.04 | 3742 | 3761 | 873.9 |
| C | 14 | 238 | 580920 | 660.44 | 3742 | 3761 | 873.9 |
| C | 13 | 61 | 26772 | 26.33 | 3742 | 3761 | 873.9 |
| D | 7 | 238 | 3289305 | 3539.38 | 3829 | 3720 | 928.3 |
| D | 5 | 222 | 1921330 | 2065.74 | 3829 | 3720 | 928.3 |
| D | 8 | 230 | 658726 | 705.6 | 3829 | 3720 | 928.3 |
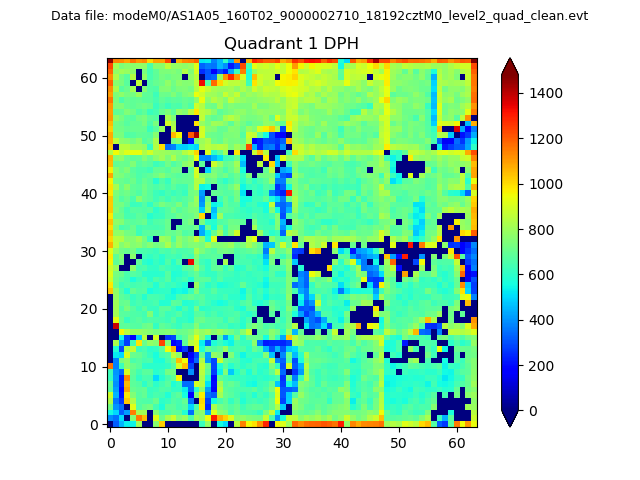
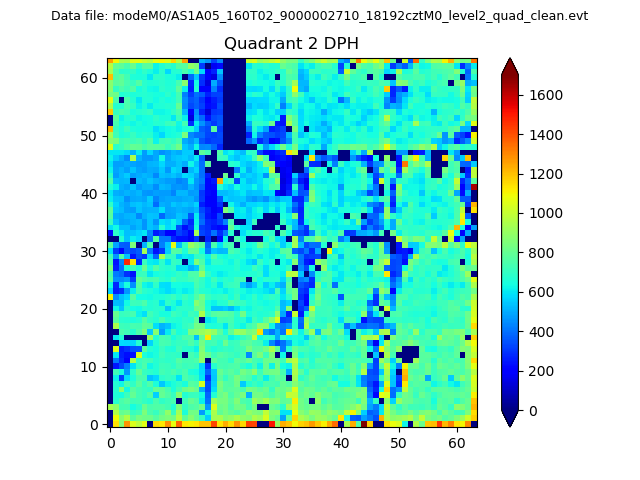
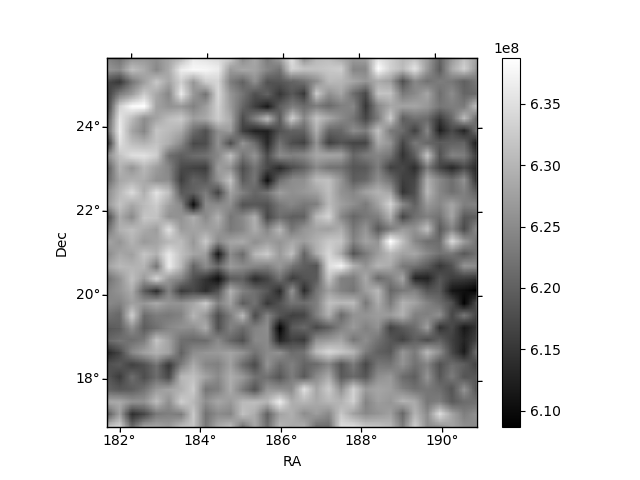
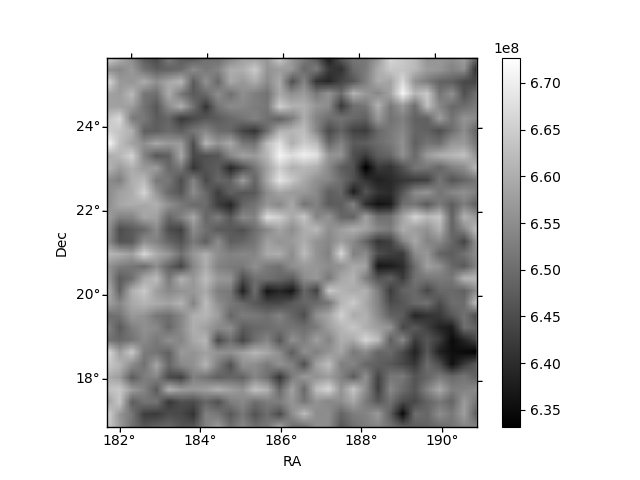
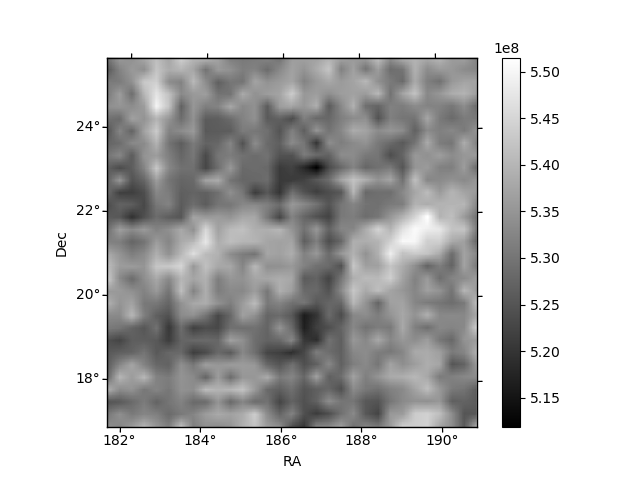
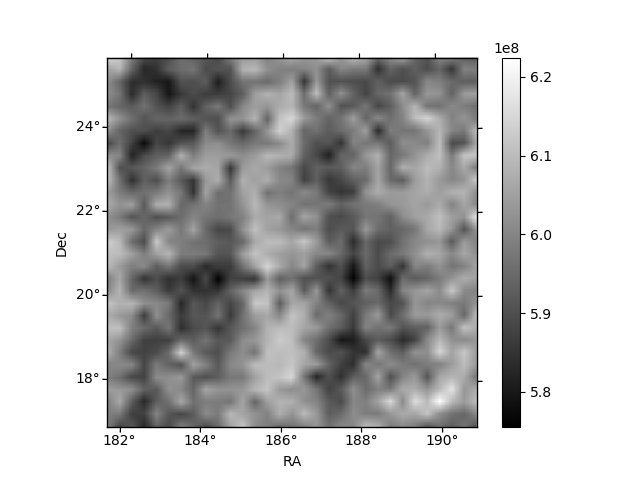
Histogram calculated using DETX and DETY for each event in the final _common_clean file
| Quadrant A |  |
 |
Quadrant B |
|---|---|---|---|
| Quadrant D | 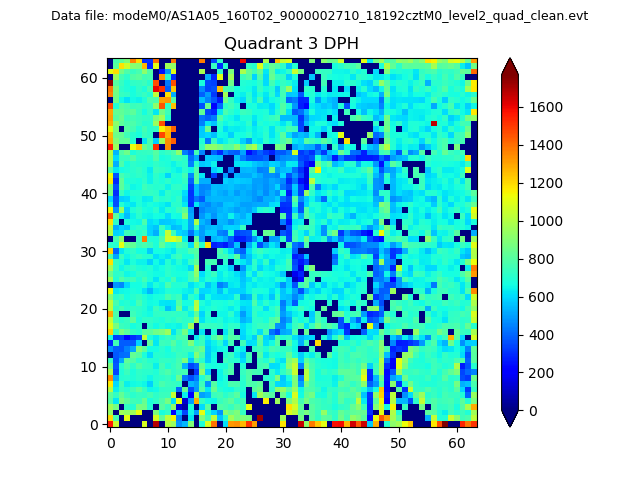 |
 |
Quadrant C |
| Plot type | Count rate plots | Images |
|---|---|---|
| Comparison with Poisson distribution Blue bars denote a histogram of data divided into 1 sec bins. Red curve is a Poisson curve with rate = median count rate of data. |
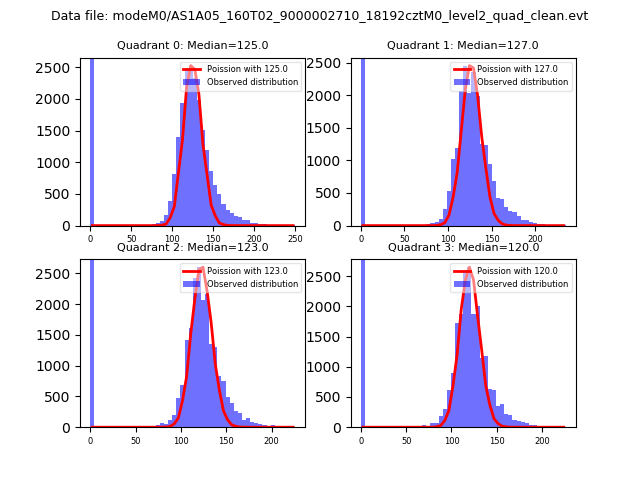 |
 |
| Quadrant-wise count rates Data is divided into 100 sec bins |
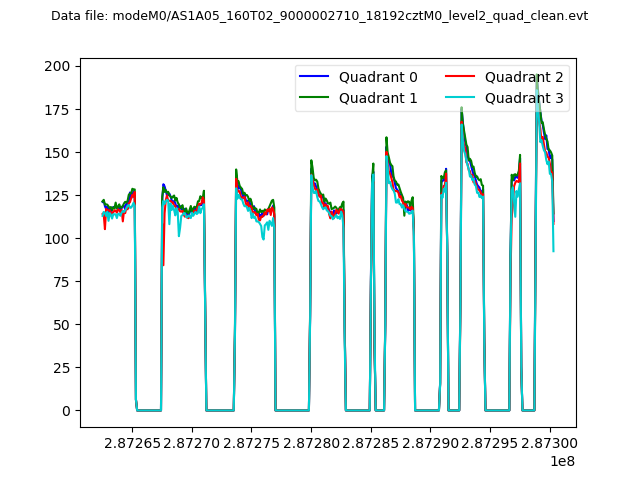 |
|
| Module-wise count rates for Quadrant A Data is divided into 100 sec bins |
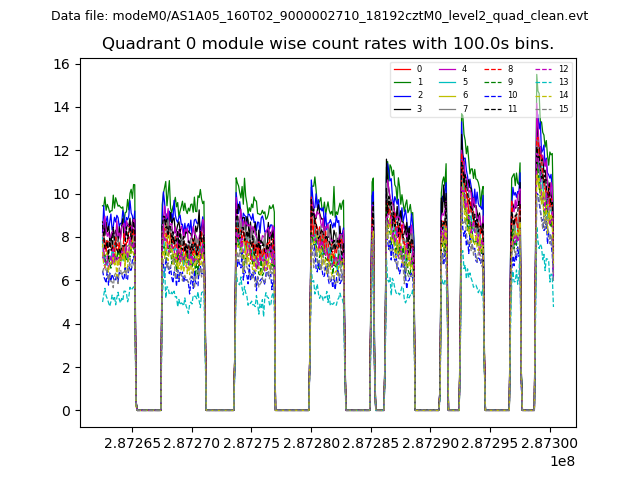 |
 |
| Module-wise count rates for Quadrant B Data is divided into 100 sec bins |
 |
 |
| Module-wise count rates for Quadrant C Data is divided into 100 sec bins |
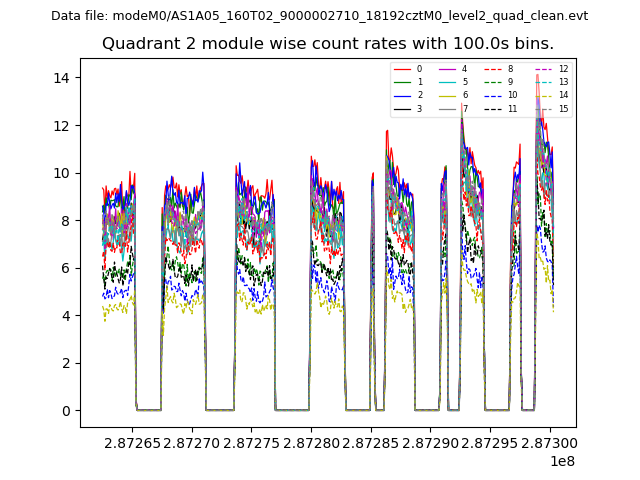 |
 |
| Module-wise count rates for Quadrant D Data is divided into 100 sec bins |
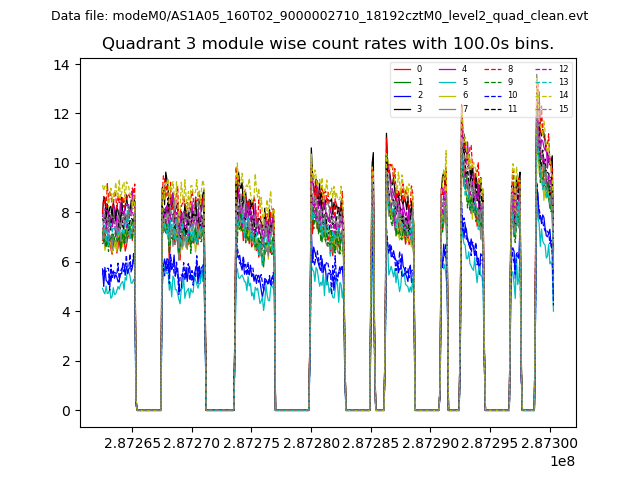 |
 |
| Parameter | Plot |
|---|---|
| CZT HV Monitor | 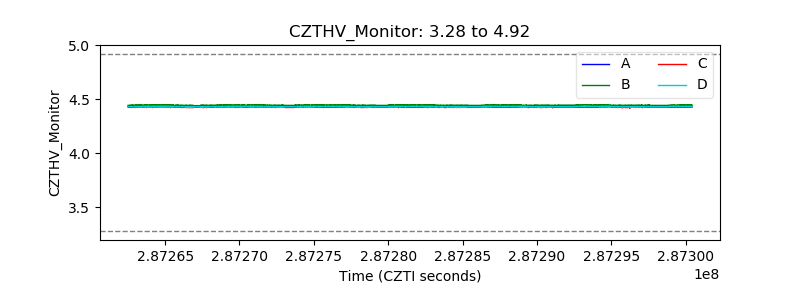 |
| D_VDD | 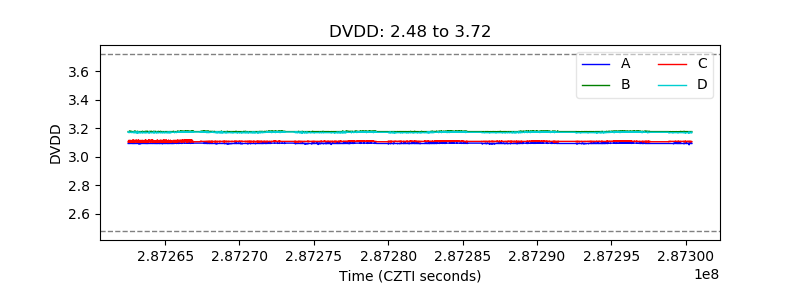 |
| Temperature 1 | 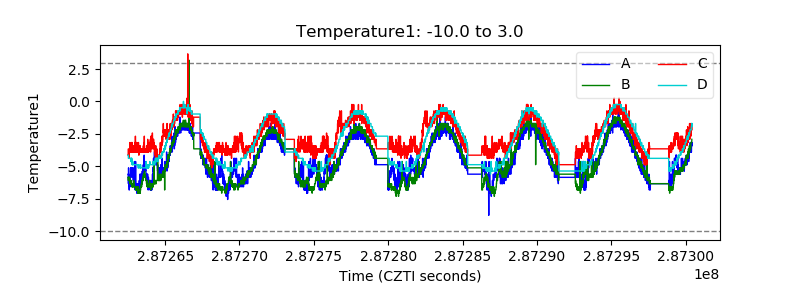 |
| Veto HV Monitor | 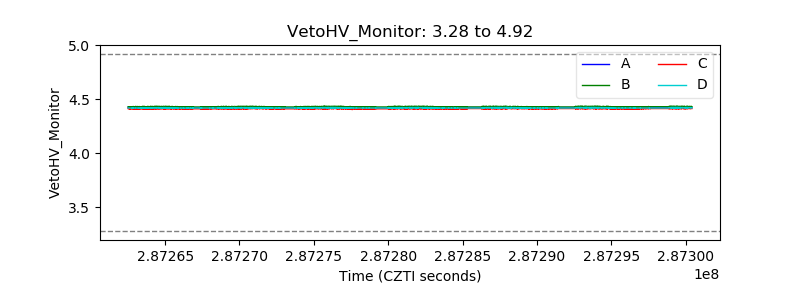 |
| Veto LLD | 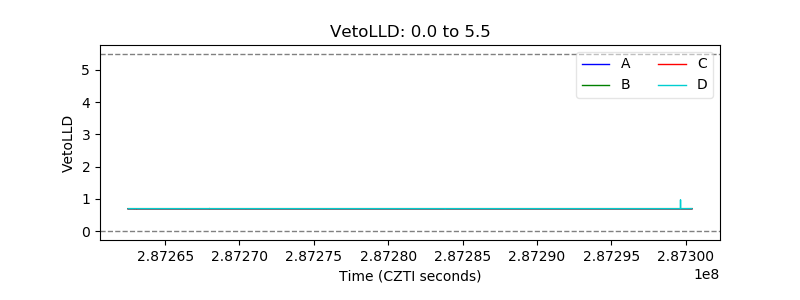 |
| Alpha Counter | 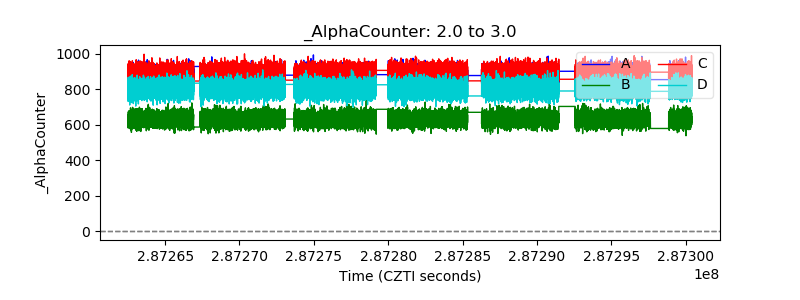 |
| _CPM_Rate | 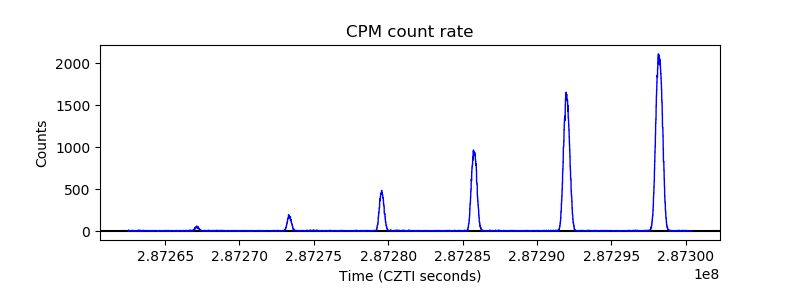 |
| CZT Counter | 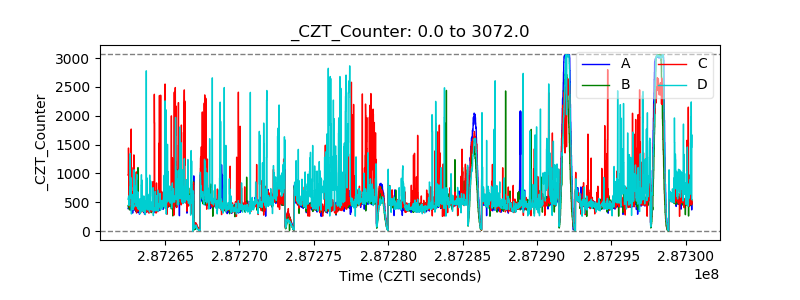 |
| +2.5 Volts monitor | 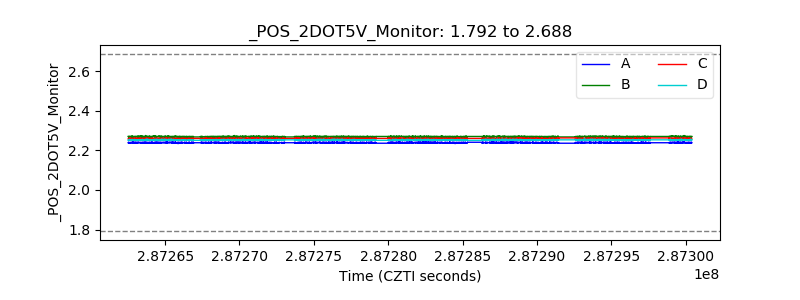 |
| +5 Volts monitor |  |
| _ROLL_ROT | 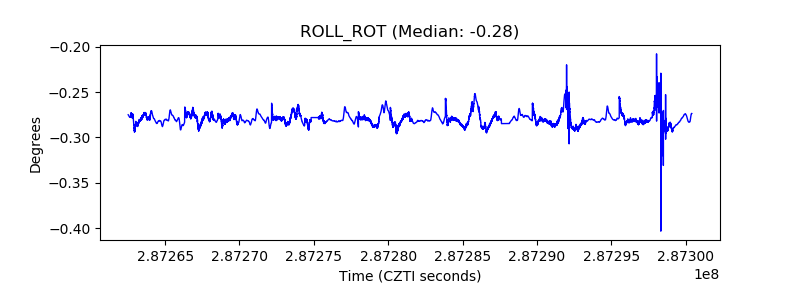 |
| _Roll_DEC | 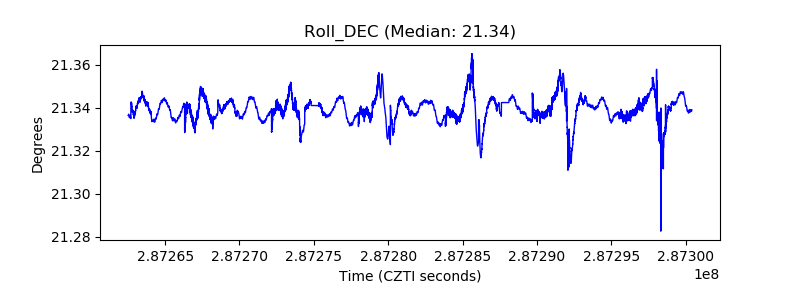 |
| _Roll_RA | 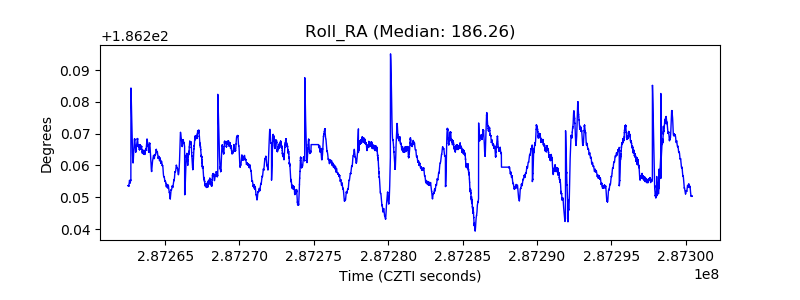 |
| Veto Counter | 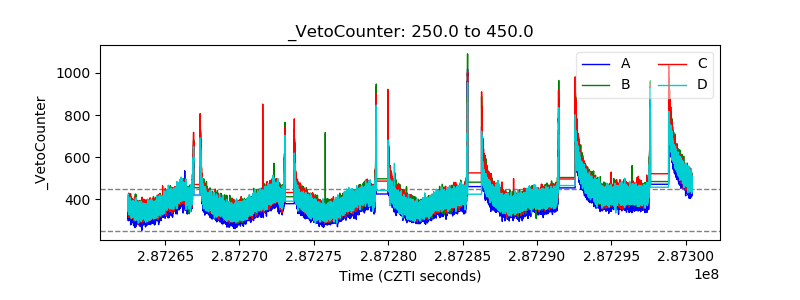 |