| Param | Original file | Final file |
|---|---|---|
| Filename | modeM0/AS1A05_160T02_9000002710_18193cztM0_level2.evt | modeM0/AS1A05_160T02_9000002710_18193cztM0_level2_quad_clean.evt |
| Size (bytes) | 484,689,600 | 89,864,640 |
| Size | 462.2 MB | 85.7 MB |
| Events in quadrant A | 3,127,512 | 591,379 |
| Events in quadrant B | 3,201,465 | 595,448 |
| Events in quadrant C | 3,498,508 | 563,069 |
| Events in quadrant D | 4,445,559 | 553,756 |
| Mode SS | |||
|---|---|---|---|
| Quadrant | BADHDUFLAG | Total packets | Discarded packets |
| A | 0 | 124 | 0 |
| B | 0 | 124 | 0 |
| C | 0 | 124 | 0 |
| D | 0 | 124 | 0 |
| Mode M9 | |||
|---|---|---|---|
| Quadrant | BADHDUFLAG | Total packets | Discarded packets |
| A | 0 | 12 | 0 |
| B | 0 | 12 | 0 |
| C | 0 | 12 | 0 |
| D | 0 | 12 | 0 |
| Mode M0 | |||
|---|---|---|---|
| Quadrant | BADHDUFLAG | Total packets | Discarded packets |
| A | 0 | 12705 | 1 |
| B | 0 | 12859 | 1 |
| C | 0 | 13910 | 1 |
| D | 0 | 17201 | 2 |
| Quadrant | Total seconds | Saturated seconds | Saturation percentage |
|---|---|---|---|
| A | 5973 | 63 | 1.054746% |
| B | 5974 | 76 | 1.272179% |
| C | 5974 | 136 | 2.276532% |
| D | 5973 | 196 | 3.281433% |
Noise dominated data is calculated using 1-second bins in cleaned event files. If a bin has >2000 counts, and if more than 50% of those come from <1% of pixels, then it is considered to be noise-dominated and hence unusable.
| Quadrant | # 1 sec bins | Bins with >0 counts | Bins with >2000 counts | High rate bins dominated by noise | Noise dominated (total time) | Noise dominated (detector-on time) | Marked lightcurve |
|---|---|---|---|---|---|---|---|
| A | 7258 | 5974 | 1 | 1 | 0.01% | 0.02% | 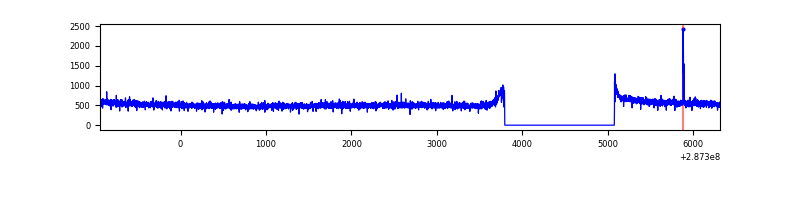 |
| B | 7259 | 5975 | 2 | 2 | 0.03% | 0.03% | 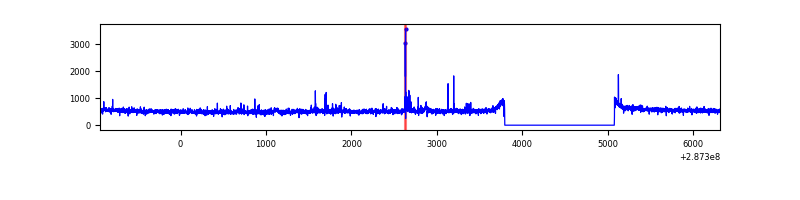 |
| C | 7259 | 5975 | 37 | 37 | 0.51% | 0.62% | 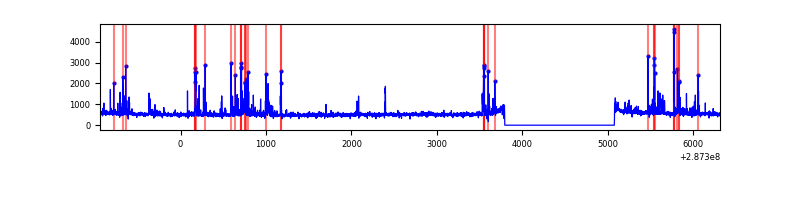 |
| D | 7258 | 5974 | 132 | 132 | 1.82% | 2.21% | 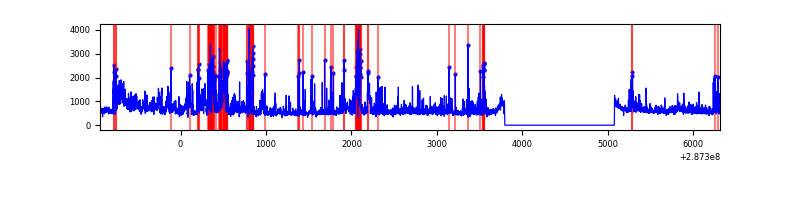 |
Top three noisy pixels from each quadrant. If the there are fewer than three noisy pixels in the level2.evt file, extra rows are filled as -1
| Pixel properties | Quadrant properties | ||||||
|---|---|---|---|---|---|---|---|
| Quadrant | DetID | PixID | Counts | Sigma | Mean | Median | Sigma |
| A | 15 | 174 | 15224 | 89.16 | 809 | 794 | 161.8 |
| A | 0 | 226 | 7222 | 39.72 | 809 | 794 | 161.8 |
| A | 12 | 194 | 6147 | 33.08 | 809 | 794 | 161.8 |
| B | 7 | 220 | 40852 | 264.09 | 795 | 778 | 151.7 |
| B | 0 | 189 | 20643 | 130.91 | 795 | 778 | 151.7 |
| B | 12 | 111 | 16890 | 106.18 | 795 | 778 | 151.7 |
| C | 4 | 254 | 419281 | 2384.08 | 758 | 764 | 175.5 |
| C | 14 | 238 | 119552 | 676.68 | 758 | 764 | 175.5 |
| C | 13 | 61 | 5283 | 25.74 | 758 | 764 | 175.5 |
| D | 7 | 238 | 664101 | 3566.52 | 776 | 754 | 186.0 |
| D | 5 | 222 | 341021 | 1829.46 | 776 | 754 | 186.0 |
| D | 1 | 52 | 295823 | 1586.45 | 776 | 754 | 186.0 |
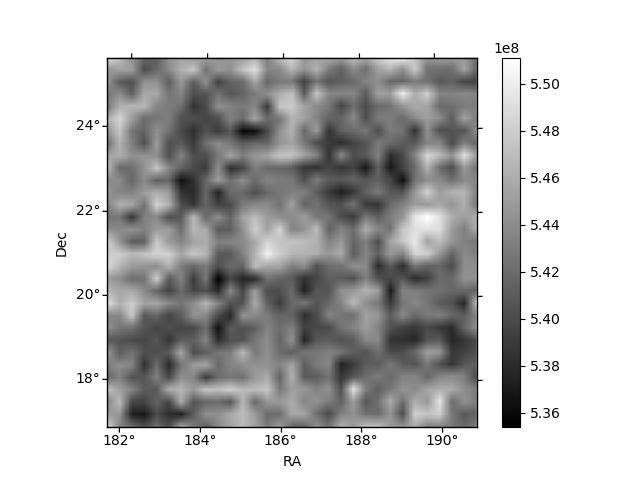
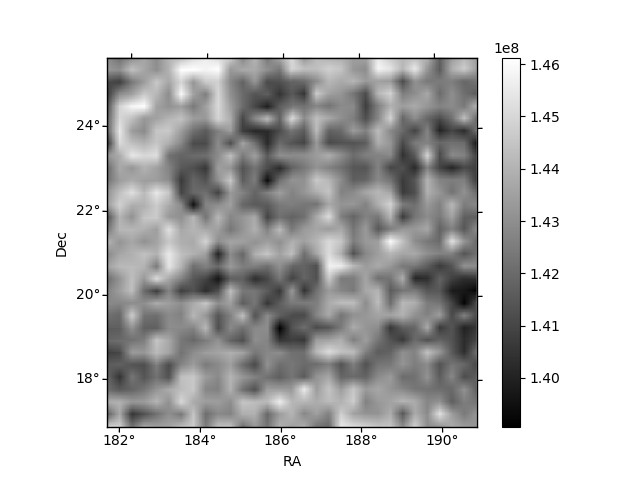
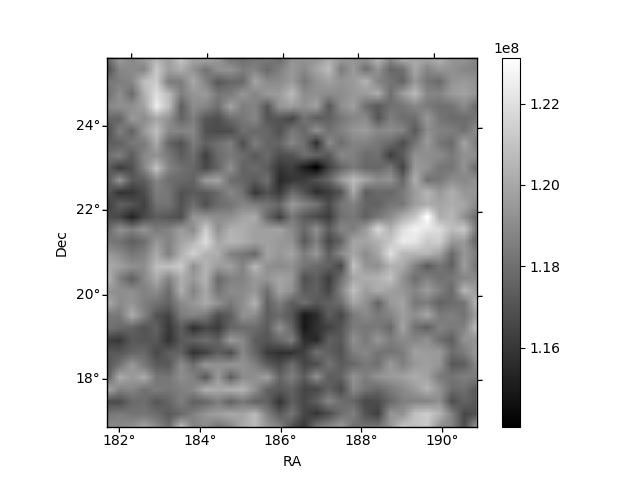
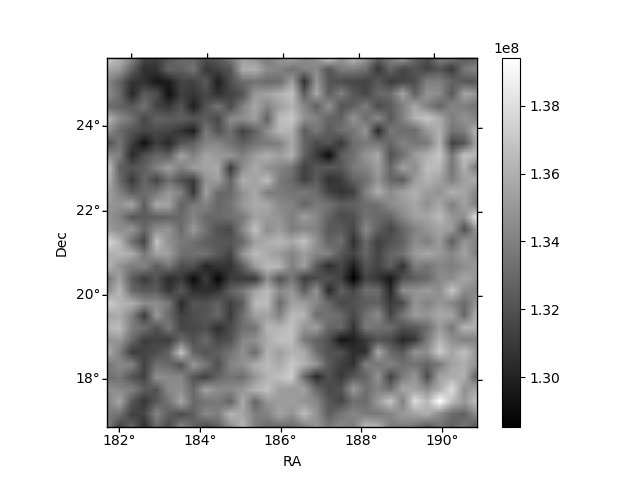
Histogram calculated using DETX and DETY for each event in the final _common_clean file
| Quadrant A | 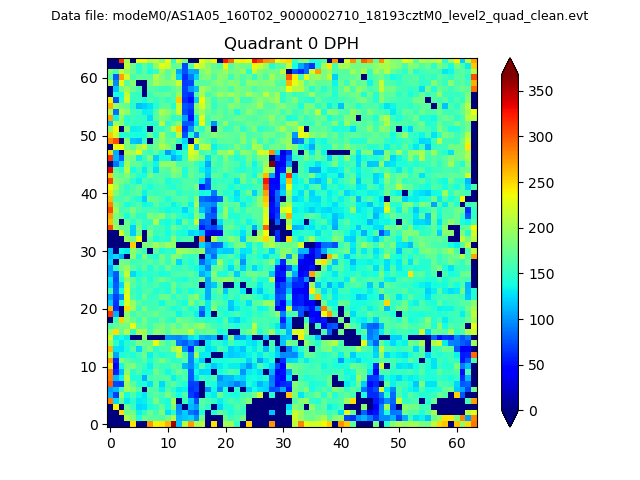 |
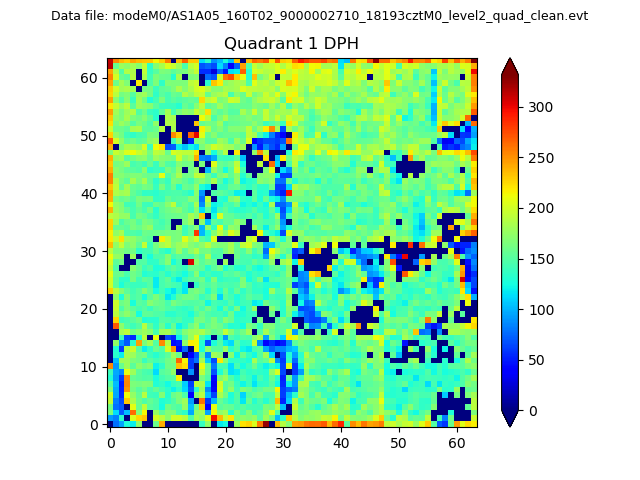 |
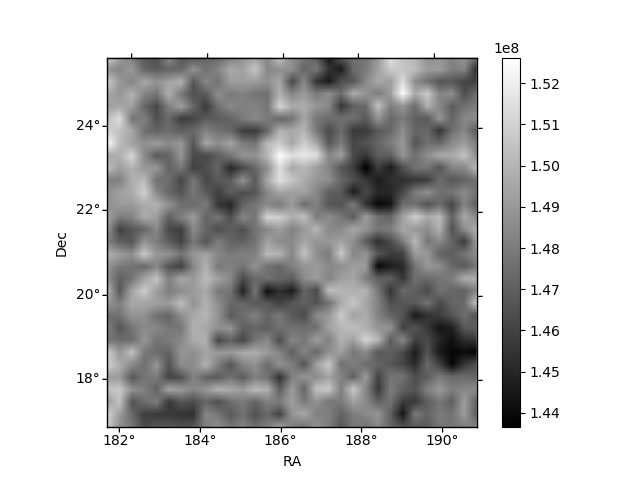
Quadrant B |
|---|---|---|---|
| Quadrant D | 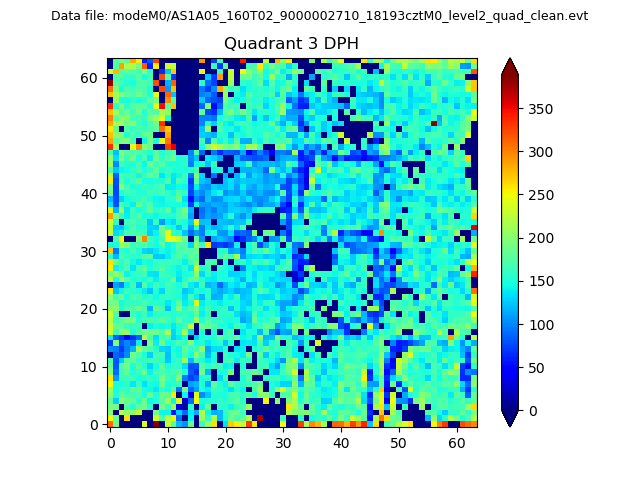 |
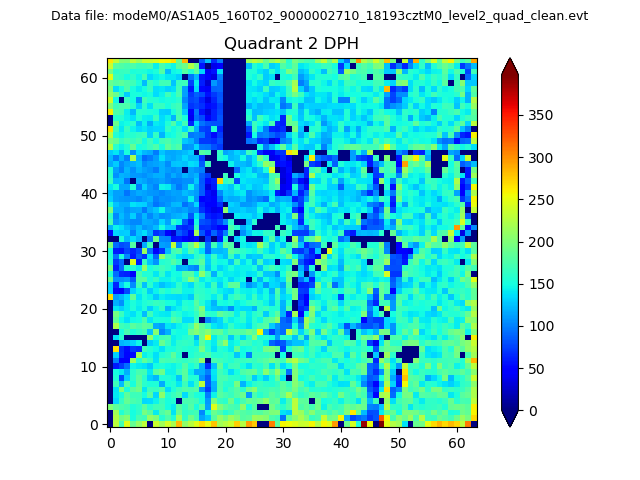 |
Quadrant C |
| Plot type | Count rate plots | Images |
|---|---|---|
| Comparison with Poisson distribution Blue bars denote a histogram of data divided into 1 sec bins. Red curve is a Poisson curve with rate = median count rate of data. |
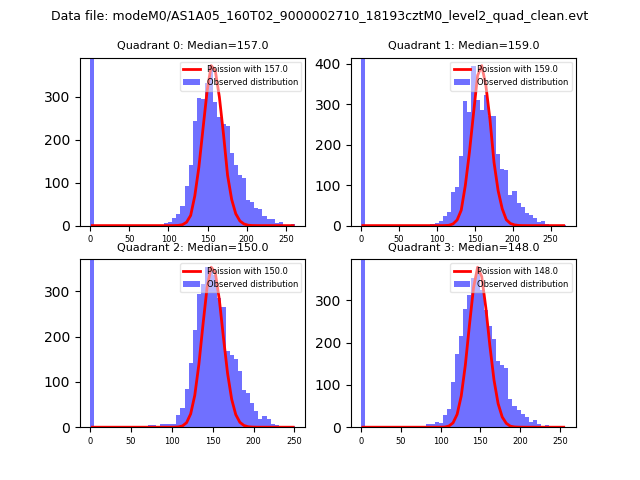 |
 |
| Quadrant-wise count rates Data is divided into 100 sec bins |
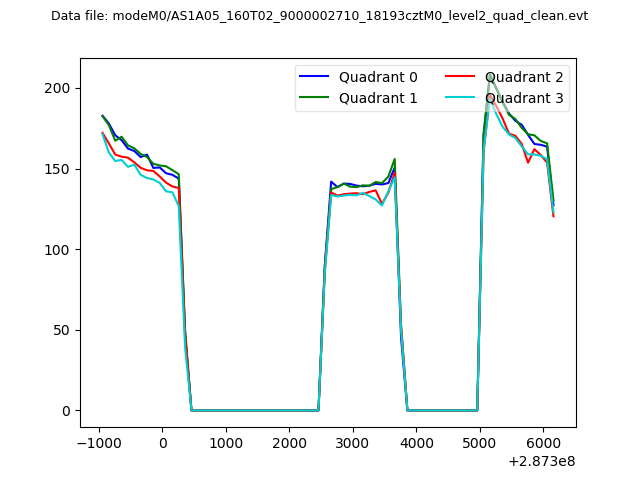 |
|
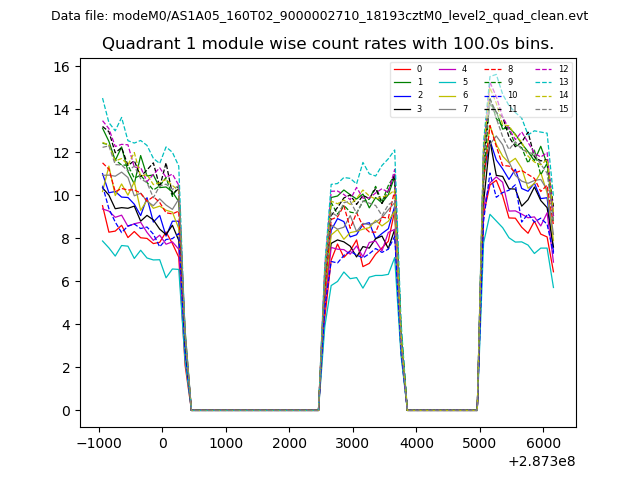
| Module-wise count rates for Quadrant A Data is divided into 100 sec bins |
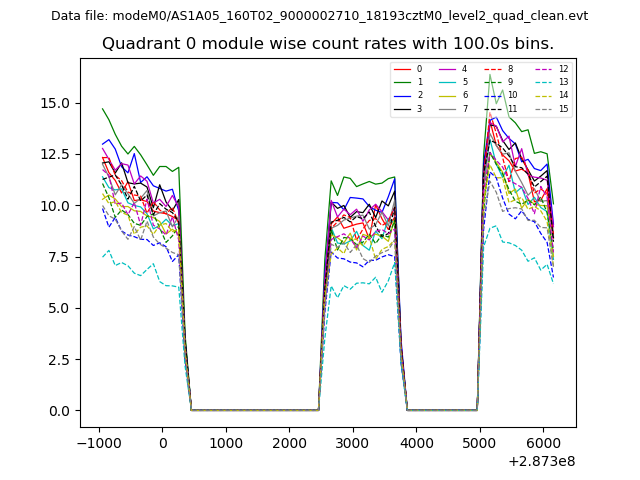 |
 |
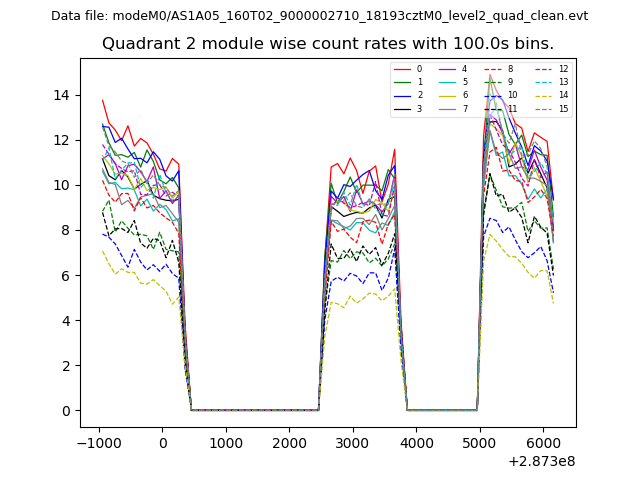
| Module-wise count rates for Quadrant B Data is divided into 100 sec bins |
 |
 |
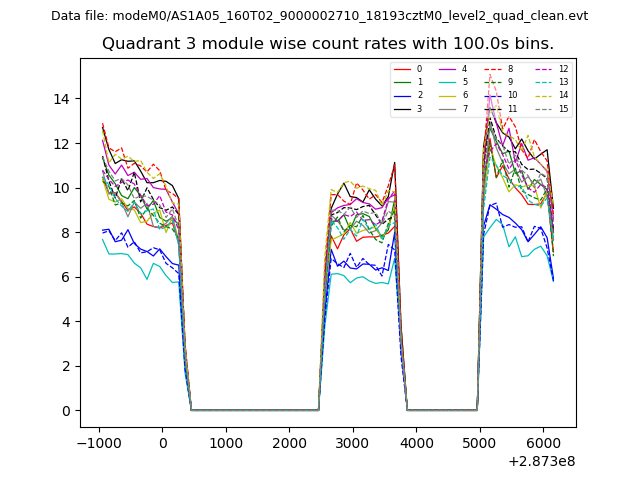
| Module-wise count rates for Quadrant C Data is divided into 100 sec bins |
 |
 |
| Module-wise count rates for Quadrant D Data is divided into 100 sec bins |
 |
 |
| Parameter | Plot |
|---|---|
| CZT HV Monitor | 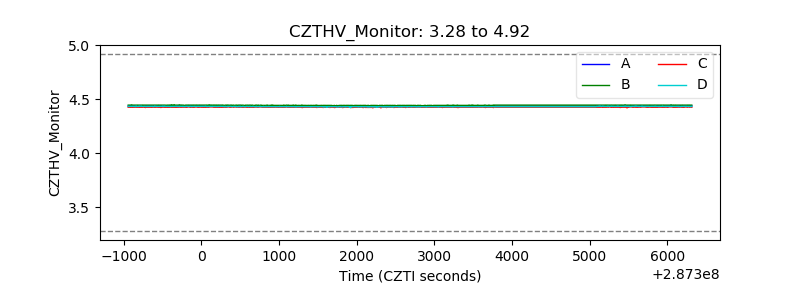 |
| D_VDD | 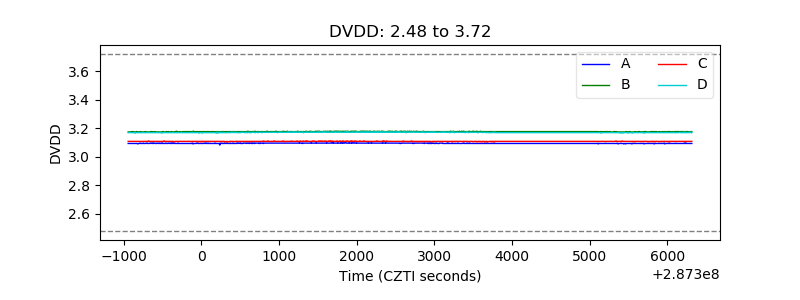 |
| Temperature 1 | 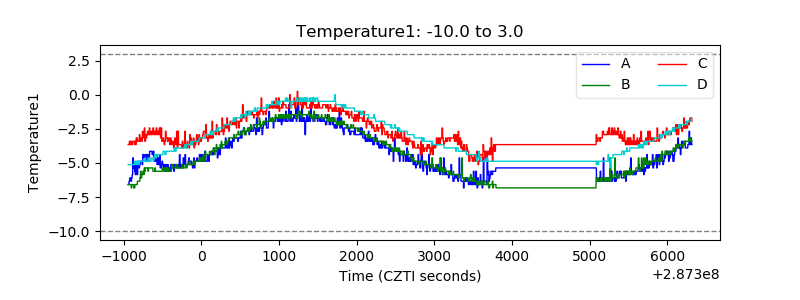 |
| Veto HV Monitor | 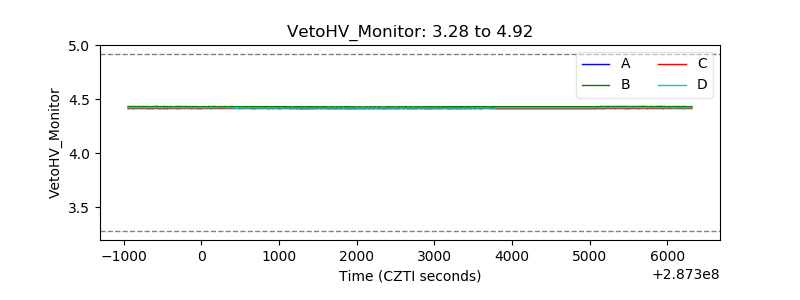 |
| Veto LLD | 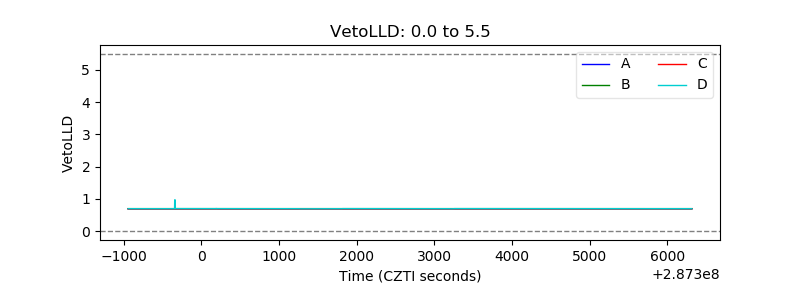 |
| Alpha Counter |  |
| _CPM_Rate | 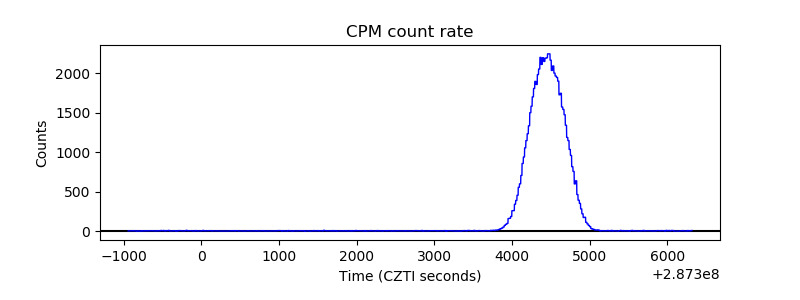 |
| CZT Counter | 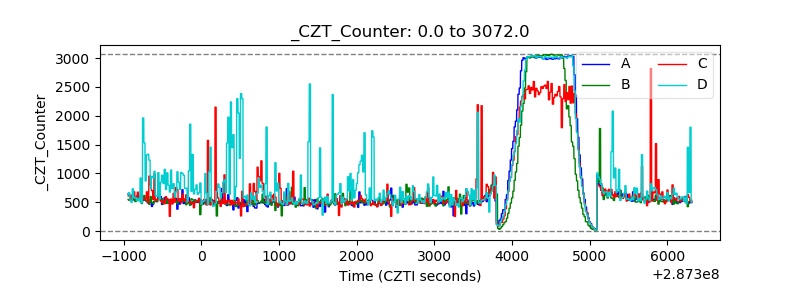 |
| +2.5 Volts monitor |  |
| +5 Volts monitor | 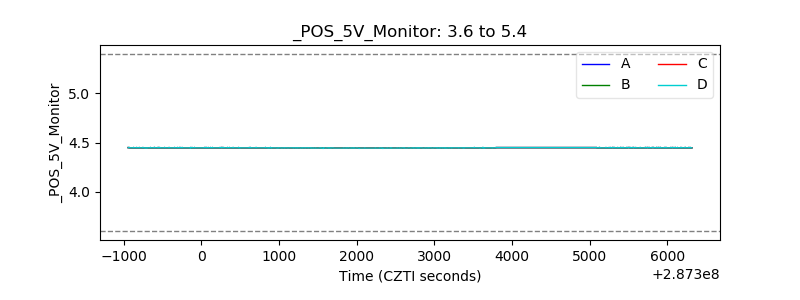 |
| _ROLL_ROT | 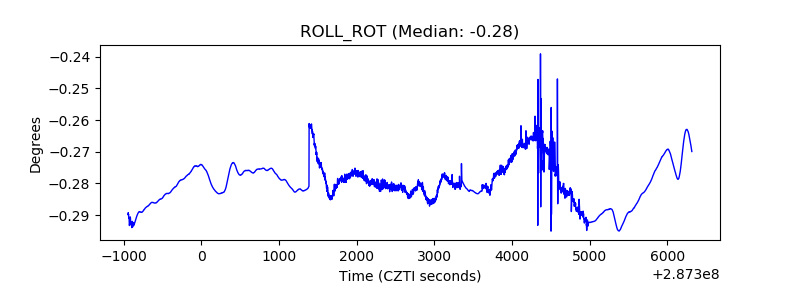 |
| _Roll_DEC | 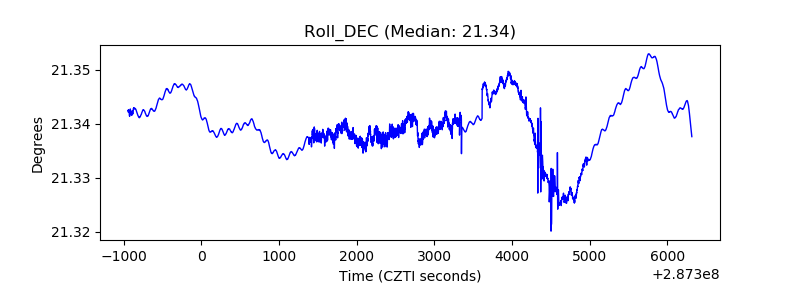 |
| _Roll_RA | 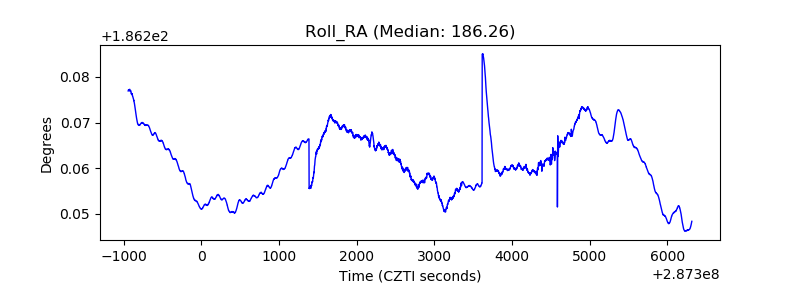 |
| Veto Counter | 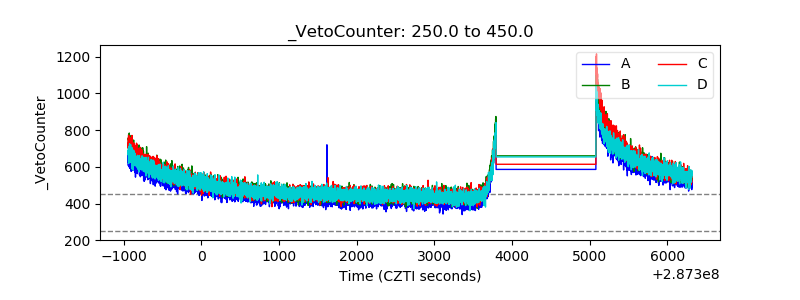 |