| Param | Original file | Final file |
|---|---|---|
| Filename | modeM0/AS1A05_160T02_9000002710_18194cztM0_level2.evt | modeM0/AS1A05_160T02_9000002710_18194cztM0_level2_quad_clean.evt |
| Size (bytes) | 500,184,000 | 86,339,520 |
| Size | 477.0 MB | 82.3 MB |
| Events in quadrant A | 3,309,658 | 563,574 |
| Events in quadrant B | 3,332,387 | 565,818 |
| Events in quadrant C | 4,032,204 | 534,302 |
| Events in quadrant D | 4,064,666 | 529,531 |
| Mode SS | |||
|---|---|---|---|
| Quadrant | BADHDUFLAG | Total packets | Discarded packets |
| A | 0 | 122 | 0 |
| B | 0 | 122 | 0 |
| C | 0 | 122 | 0 |
| D | 0 | 122 | 0 |
| Mode M9 | |||
|---|---|---|---|
| Quadrant | BADHDUFLAG | Total packets | Discarded packets |
| A | 0 | 13 | 0 |
| B | 0 | 13 | 0 |
| C | 0 | 13 | 0 |
| D | 0 | 13 | 0 |
| Mode M0 | |||
|---|---|---|---|
| Quadrant | BADHDUFLAG | Total packets | Discarded packets |
| A | 0 | 13398 | 1 |
| B | 0 | 13361 | 1 |
| C | 0 | 15734 | 1 |
| D | 0 | 15913 | 1 |
| Quadrant | Total seconds | Saturated seconds | Saturation percentage |
|---|---|---|---|
| A | 6034 | 118 | 1.955585% |
| B | 6034 | 125 | 2.071594% |
| C | 6034 | 298 | 4.938681% |
| D | 6035 | 262 | 4.341342% |
Noise dominated data is calculated using 1-second bins in cleaned event files. If a bin has >2000 counts, and if more than 50% of those come from <1% of pixels, then it is considered to be noise-dominated and hence unusable.
| Quadrant | # 1 sec bins | Bins with >0 counts | Bins with >2000 counts | High rate bins dominated by noise | Noise dominated (total time) | Noise dominated (detector-on time) | Marked lightcurve |
|---|---|---|---|---|---|---|---|
| A | 7329 | 6035 | 2 | 2 | 0.03% | 0.03% | 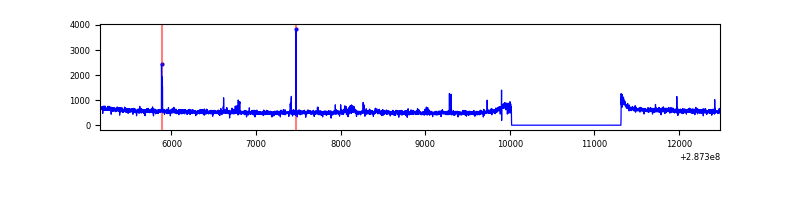 |
| B | 7329 | 6035 | 3 | 3 | 0.04% | 0.05% | 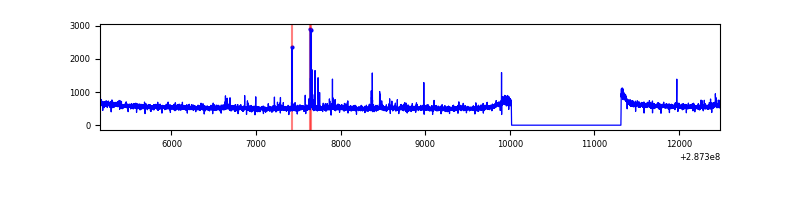 |
| C | 7329 | 6035 | 96 | 96 | 1.31% | 1.59% | 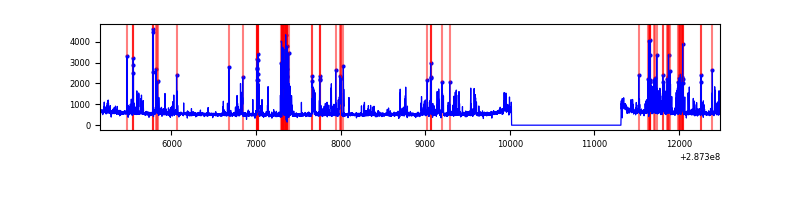 |
| D | 7330 | 6036 | 149 | 149 | 2.03% | 2.47% | 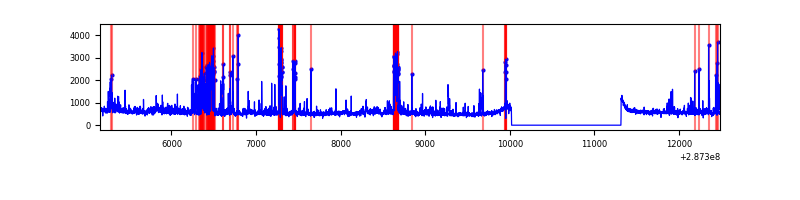 |
Top three noisy pixels from each quadrant. If the there are fewer than three noisy pixels in the level2.evt file, extra rows are filled as -1
| Pixel properties | Quadrant properties | ||||||
|---|---|---|---|---|---|---|---|
| Quadrant | DetID | PixID | Counts | Sigma | Mean | Median | Sigma |
| A | 15 | 174 | 59755 | 347.83 | 845 | 829 | 169.4 |
| A | 0 | 226 | 7410 | 38.85 | 845 | 829 | 169.4 |
| A | 12 | 194 | 6282 | 32.19 | 845 | 829 | 169.4 |
| B | 7 | 220 | 39674 | 249.13 | 828 | 809 | 156.0 |
| B | 0 | 189 | 20991 | 129.37 | 828 | 809 | 156.0 |
| B | 0 | 229 | 17338 | 105.95 | 828 | 809 | 156.0 |
| C | 4 | 254 | 827674 | 4584.22 | 788 | 795 | 180.4 |
| C | 14 | 238 | 124044 | 683.29 | 788 | 795 | 180.4 |
| C | 4 | 238 | 7038 | 34.61 | 788 | 795 | 180.4 |
| D | 7 | 238 | 436667 | 2227.56 | 813 | 792 | 195.7 |
| D | 1 | 52 | 144127 | 732.52 | 813 | 792 | 195.7 |
| D | 11 | 176 | 139006 | 706.35 | 813 | 792 | 195.7 |
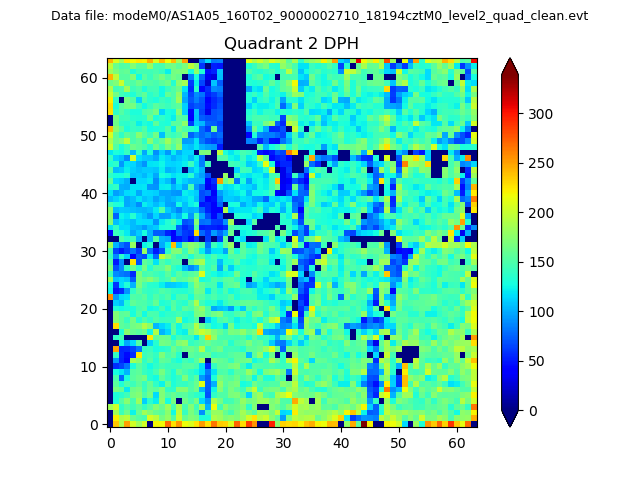
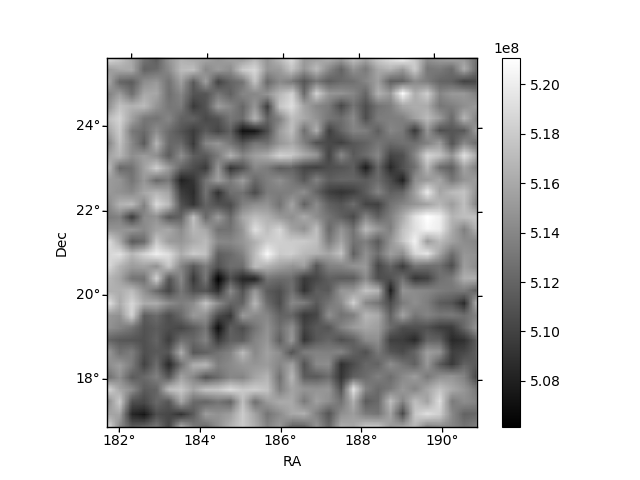
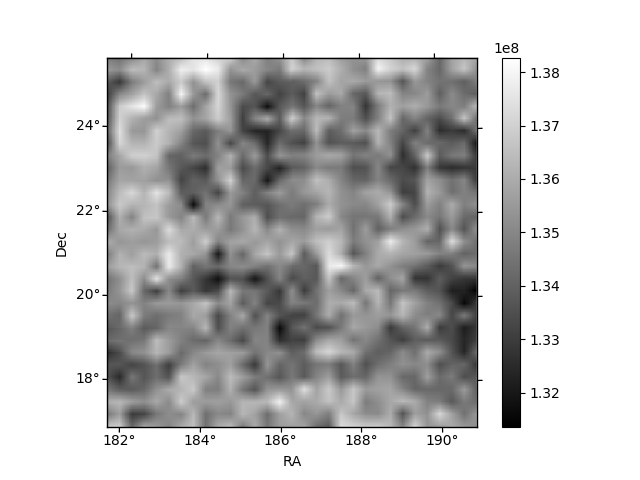
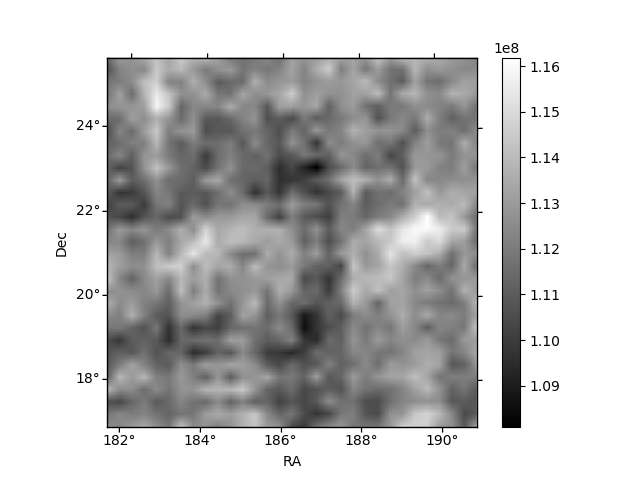
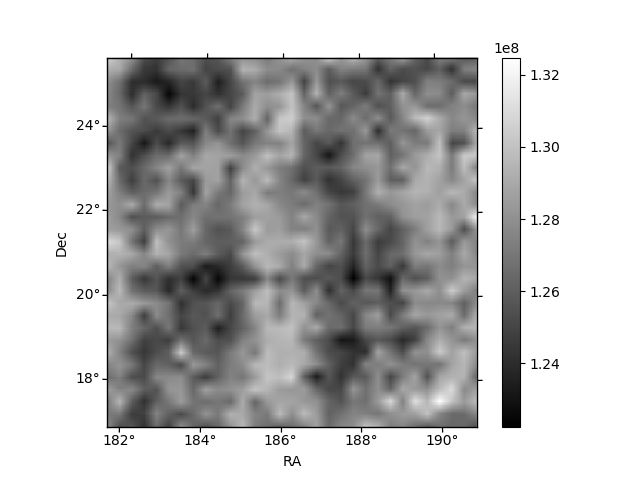
Histogram calculated using DETX and DETY for each event in the final _common_clean file
| Quadrant A | 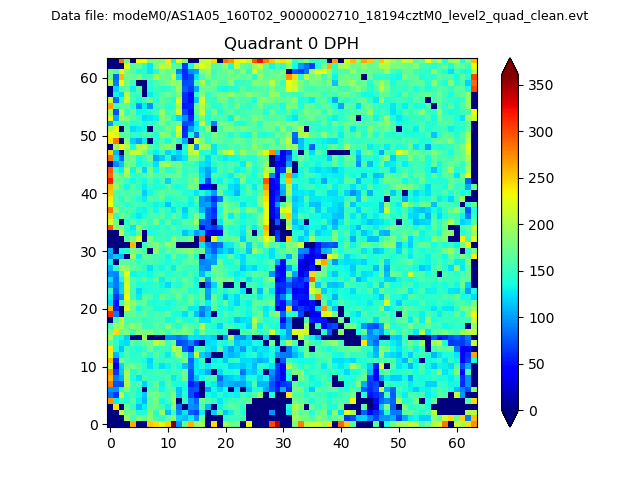 |
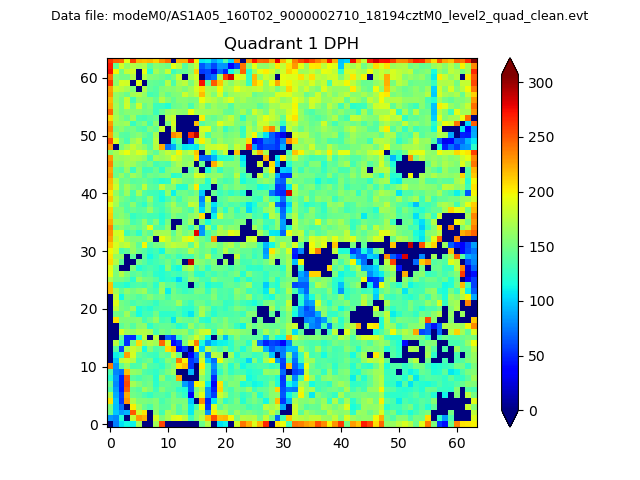 |
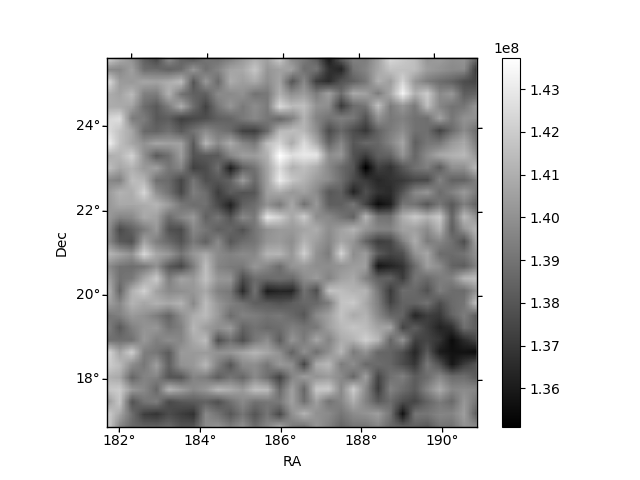
Quadrant B |
|---|---|---|---|
| Quadrant D | 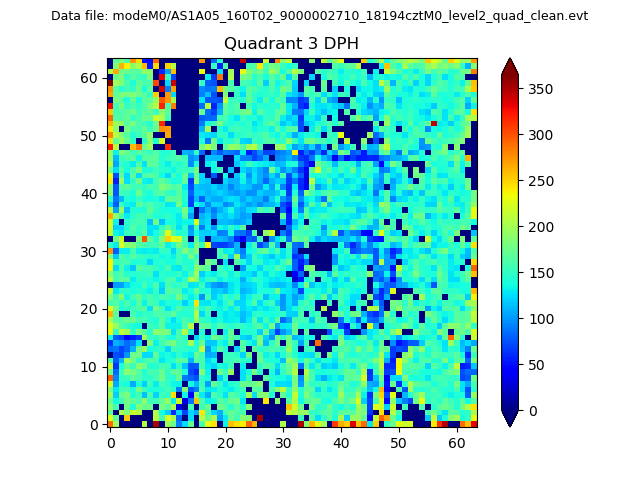 |
 |
Quadrant C |
| Plot type | Count rate plots | Images |
|---|---|---|
| Comparison with Poisson distribution Blue bars denote a histogram of data divided into 1 sec bins. Red curve is a Poisson curve with rate = median count rate of data. |
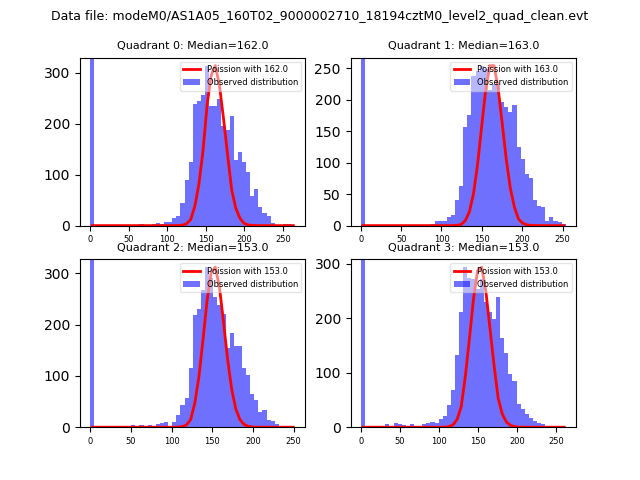 |
 |
| Quadrant-wise count rates Data is divided into 100 sec bins |
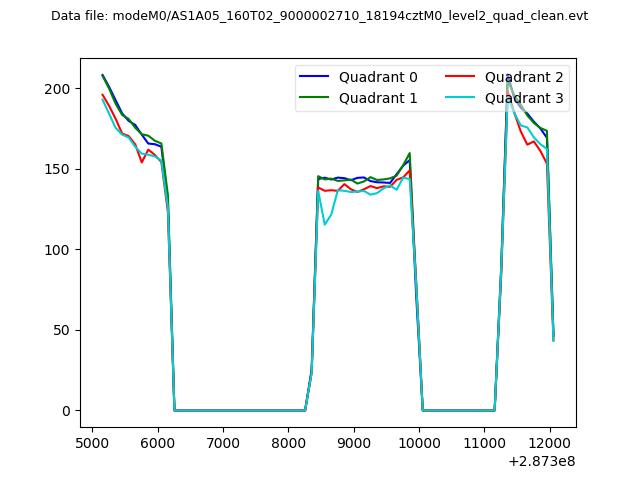 |
|
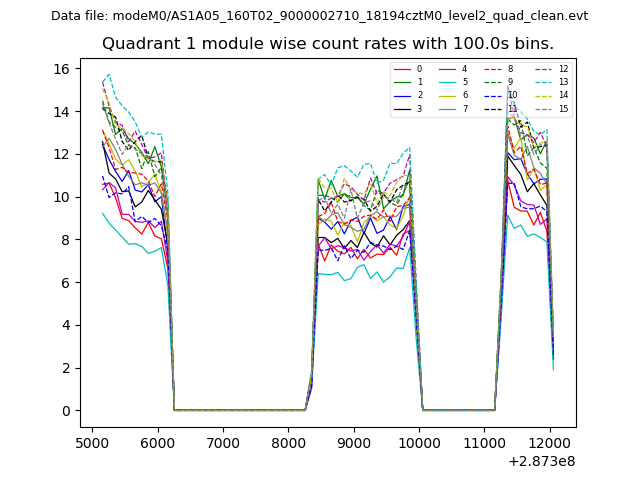
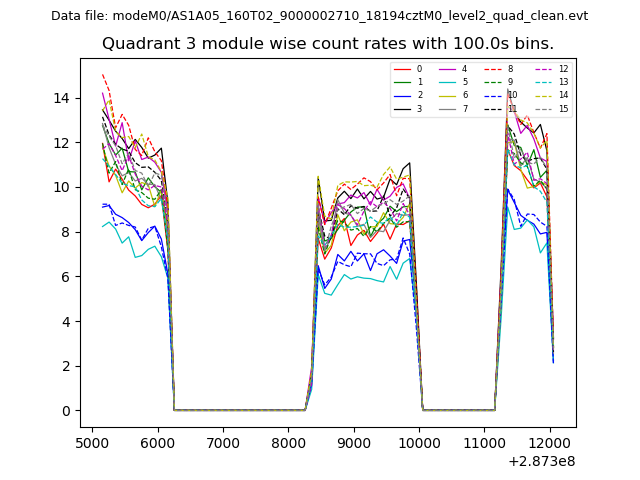
| Module-wise count rates for Quadrant A Data is divided into 100 sec bins |
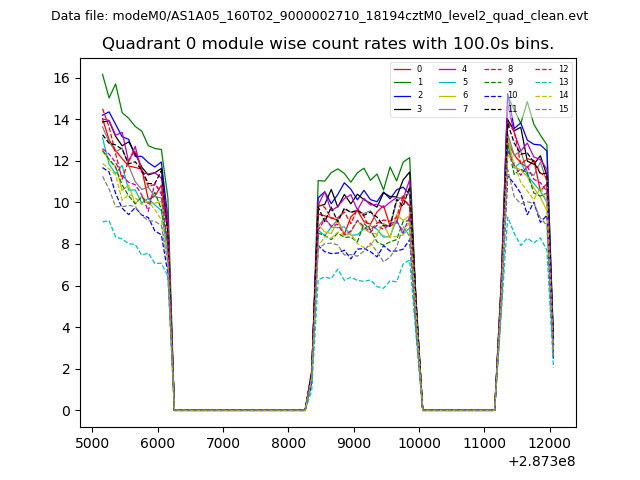 |
 |
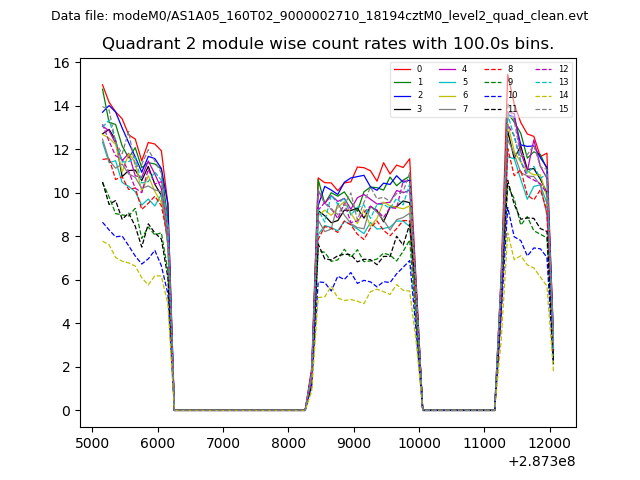
| Module-wise count rates for Quadrant B Data is divided into 100 sec bins |
 |
 |
| Module-wise count rates for Quadrant C Data is divided into 100 sec bins |
 |
 |
| Module-wise count rates for Quadrant D Data is divided into 100 sec bins |
 |
 |
| Parameter | Plot |
|---|---|
| CZT HV Monitor | 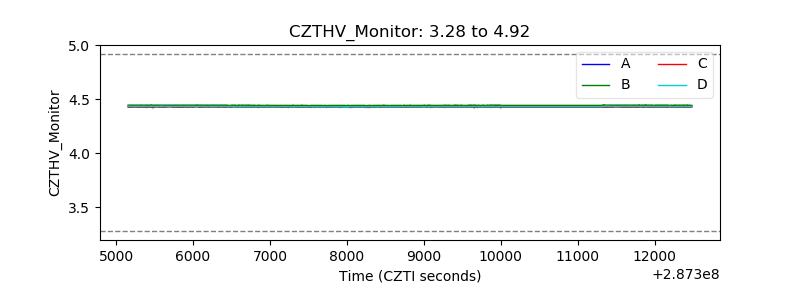 |
| D_VDD | 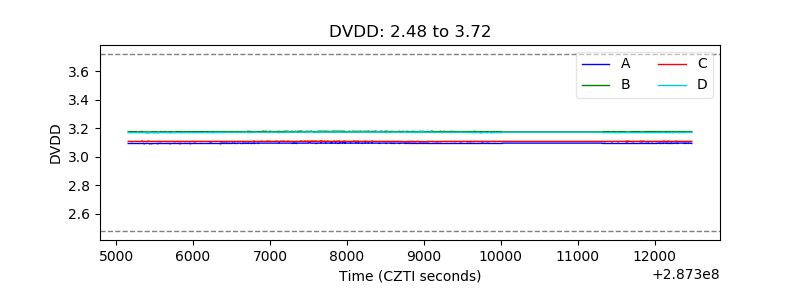 |
| Temperature 1 | 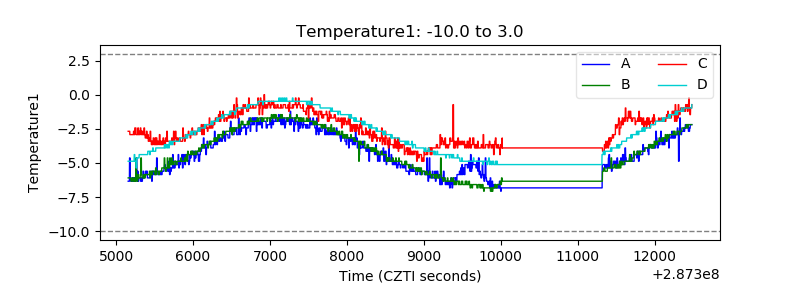 |
| Veto HV Monitor | 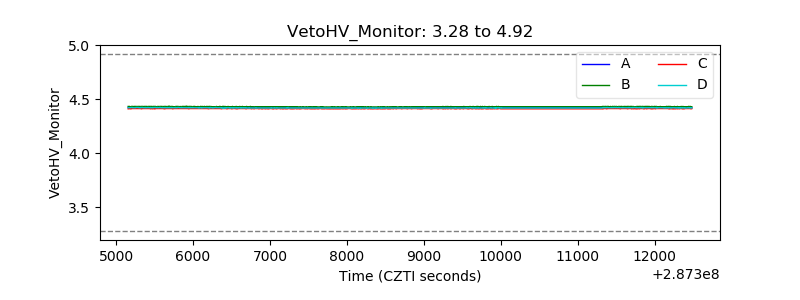 |
| Veto LLD | 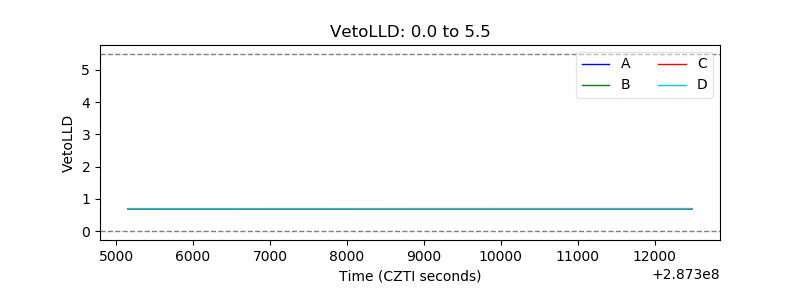 |
| Alpha Counter | 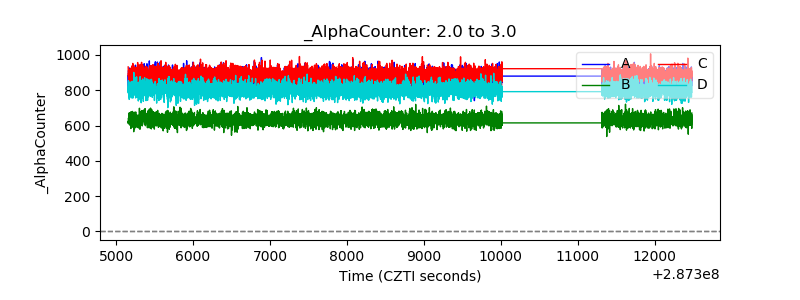 |
| _CPM_Rate | 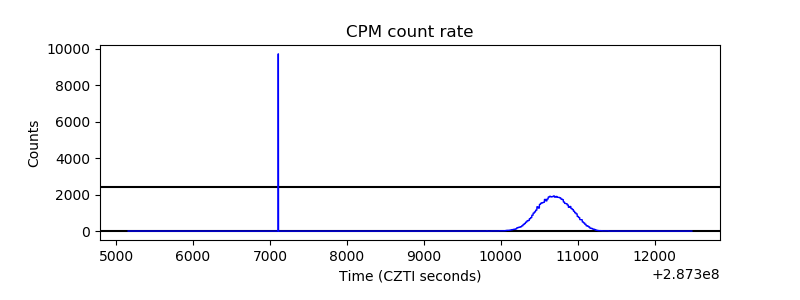 |
| CZT Counter | 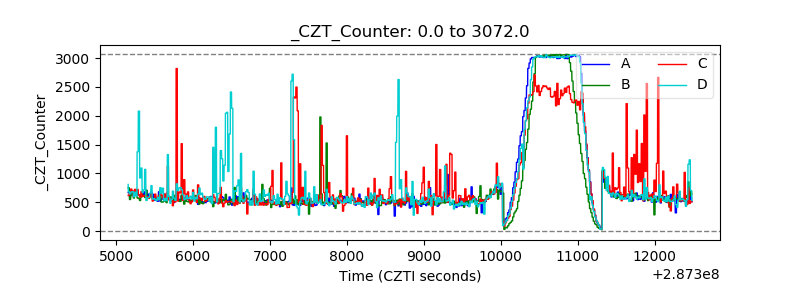 |
| +2.5 Volts monitor |  |
| +5 Volts monitor |  |
| _ROLL_ROT | 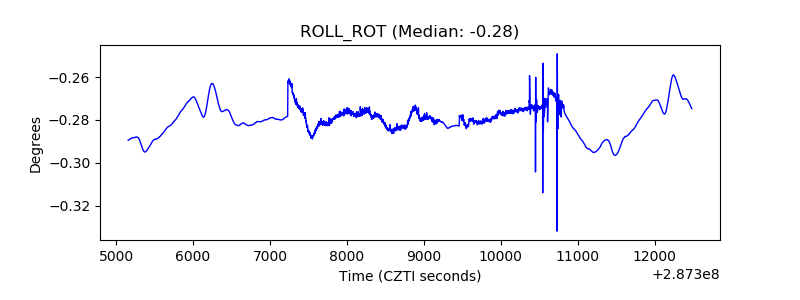 |
| _Roll_DEC | 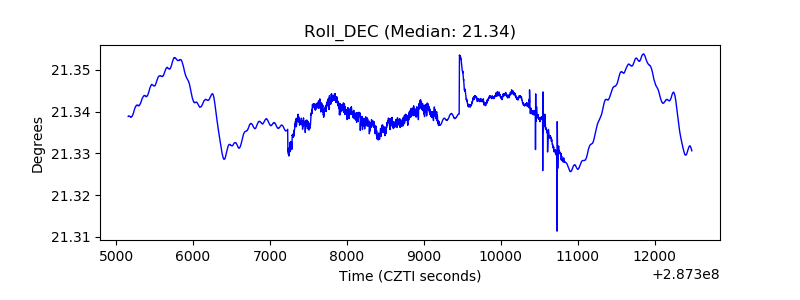 |
| _Roll_RA | 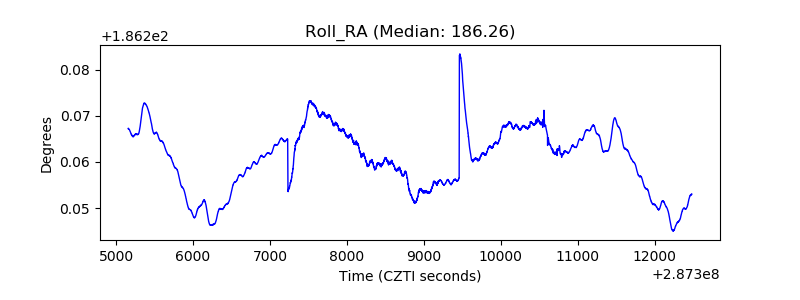 |
| Veto Counter | 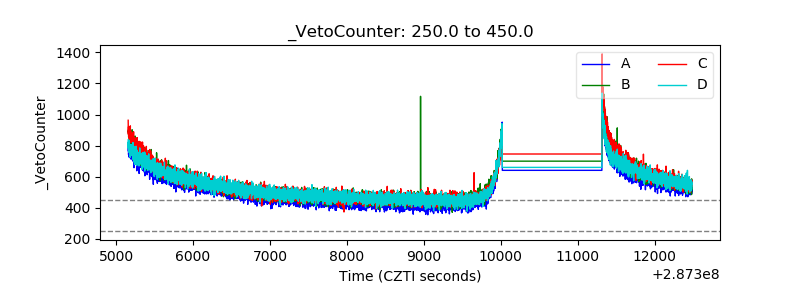 |