| Param | Original file | Final file |
|---|---|---|
| Filename | modeM0/AS1A05_160T02_9000002710_18195cztM0_level2.evt | modeM0/AS1A05_160T02_9000002710_18195cztM0_level2_quad_clean.evt |
| Size (bytes) | 552,412,800 | 78,194,880 |
| Size | 526.8 MB | 74.6 MB |
| Events in quadrant A | 3,705,819 | 490,621 |
| Events in quadrant B | 3,694,640 | 493,328 |
| Events in quadrant C | 4,784,378 | 462,687 |
| Events in quadrant D | 4,099,715 | 462,941 |
| Mode SS | |||
|---|---|---|---|
| Quadrant | BADHDUFLAG | Total packets | Discarded packets |
| A | 0 | 132 | 0 |
| B | 0 | 132 | 0 |
| C | 0 | 132 | 0 |
| D | 0 | 132 | 0 |
| Mode M9 | |||
|---|---|---|---|
| Quadrant | BADHDUFLAG | Total packets | Discarded packets |
| A | 0 | 14 | 0 |
| B | 0 | 15 | 0 |
| C | 0 | 15 | 0 |
| D | 0 | 15 | 0 |
| Mode M0 | |||
|---|---|---|---|
| Quadrant | BADHDUFLAG | Total packets | Discarded packets |
| A | 0 | 14822 | 3 |
| B | 0 | 14875 | 2 |
| C | 0 | 18356 | 2 |
| D | 0 | 16180 | 2 |
| Quadrant | Total seconds | Saturated seconds | Saturation percentage |
|---|---|---|---|
| A | 6573 | 169 | 2.571124% |
| B | 6573 | 143 | 2.175567% |
| C | 6573 | 477 | 7.256960% |
| D | 6573 | 249 | 3.788225% |
Noise dominated data is calculated using 1-second bins in cleaned event files. If a bin has >2000 counts, and if more than 50% of those come from <1% of pixels, then it is considered to be noise-dominated and hence unusable.
| Quadrant | # 1 sec bins | Bins with >0 counts | Bins with >2000 counts | High rate bins dominated by noise | Noise dominated (total time) | Noise dominated (detector-on time) | Marked lightcurve |
|---|---|---|---|---|---|---|---|
| A | 7873 | 6574 | 28 | 28 | 0.36% | 0.43% | 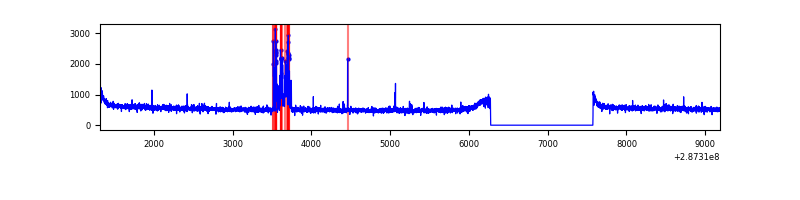 |
| B | 7873 | 6574 | 1 | 1 | 0.01% | 0.02% | 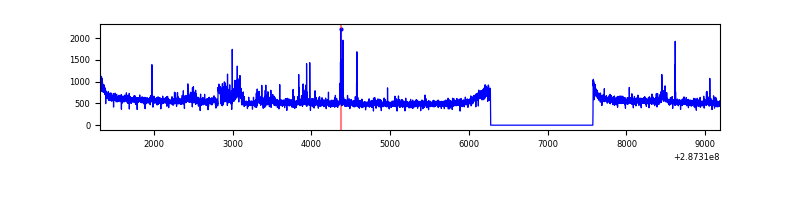 |
| C | 7873 | 6574 | 189 | 189 | 2.40% | 2.87% | 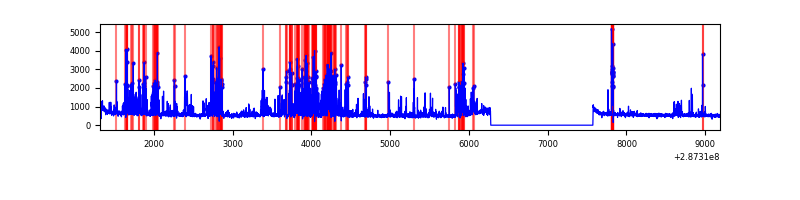 |
| D | 7873 | 6574 | 116 | 116 | 1.47% | 1.76% | 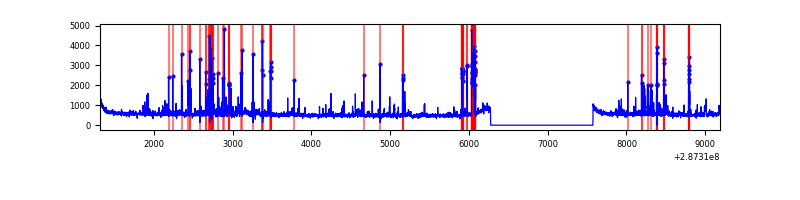 |
Top three noisy pixels from each quadrant. If the there are fewer than three noisy pixels in the level2.evt file, extra rows are filled as -1
| Pixel properties | Quadrant properties | ||||||
|---|---|---|---|---|---|---|---|
| Quadrant | DetID | PixID | Counts | Sigma | Mean | Median | Sigma |
| A | 4 | 2 | 184678 | 1004.15 | 913 | 897 | 183.0 |
| A | 15 | 174 | 8968 | 44.1 | 913 | 897 | 183.0 |
| A | 0 | 226 | 8090 | 39.3 | 913 | 897 | 183.0 |
| B | 4 | 171 | 84415 | 495.57 | 896 | 875 | 168.6 |
| B | 7 | 220 | 36051 | 208.67 | 896 | 875 | 168.6 |
| B | 0 | 189 | 32204 | 185.85 | 896 | 875 | 168.6 |
| C | 4 | 254 | 1332889 | 6814.71 | 847 | 855 | 195.5 |
| C | 14 | 238 | 133043 | 676.28 | 847 | 855 | 195.5 |
| C | 4 | 238 | 6520 | 28.98 | 847 | 855 | 195.5 |
| D | 7 | 238 | 381561 | 1773.67 | 882 | 855 | 214.6 |
| D | 10 | 70 | 146198 | 677.14 | 882 | 855 | 214.6 |
| D | 11 | 176 | 71952 | 331.23 | 882 | 855 | 214.6 |
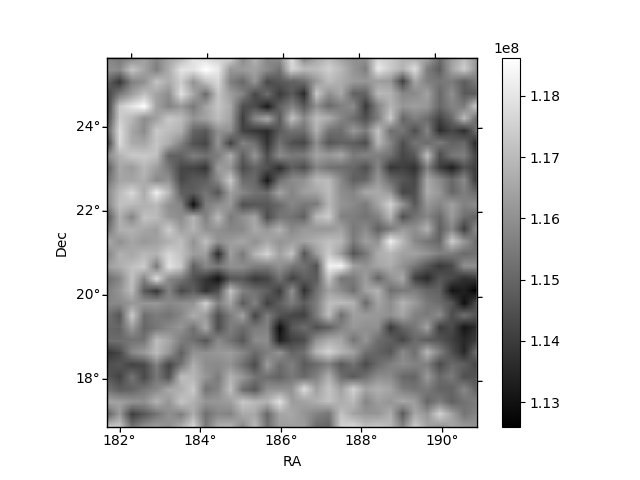
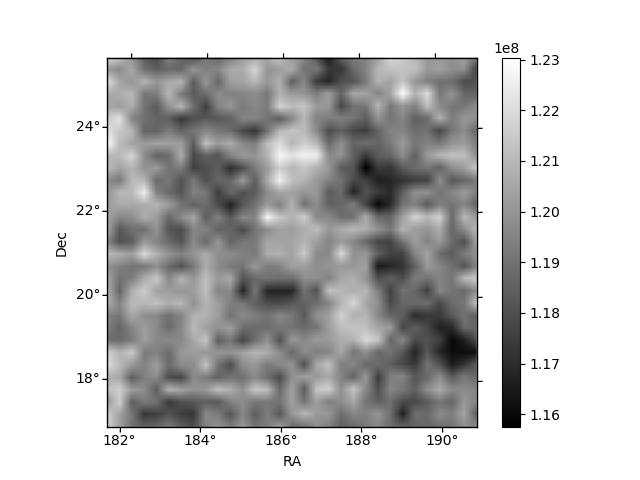
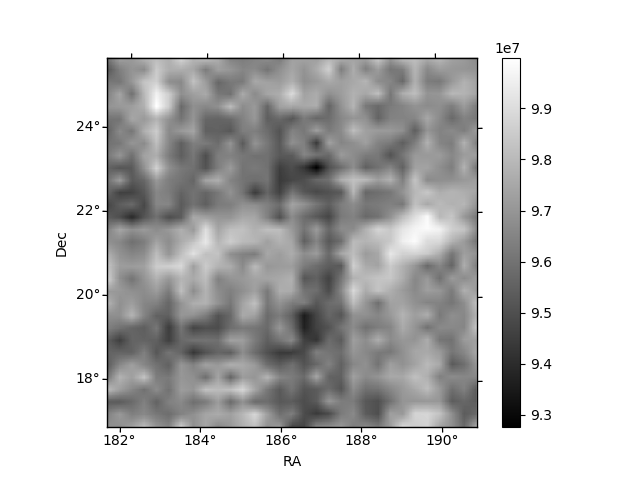
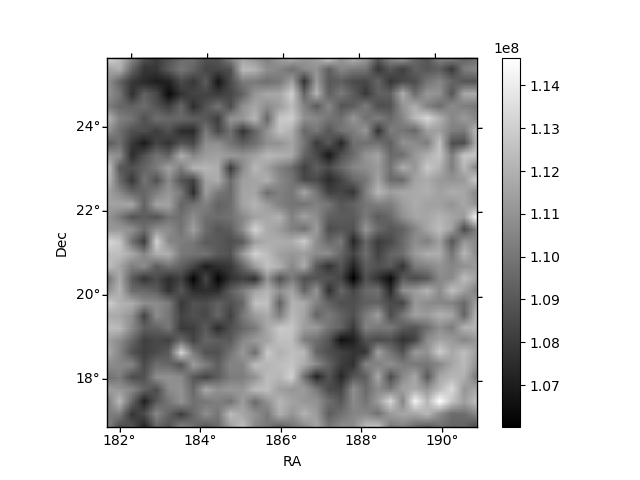
Histogram calculated using DETX and DETY for each event in the final _common_clean file
| Quadrant A |  |
 |
Quadrant B |
|---|---|---|---|
| Quadrant D |  |
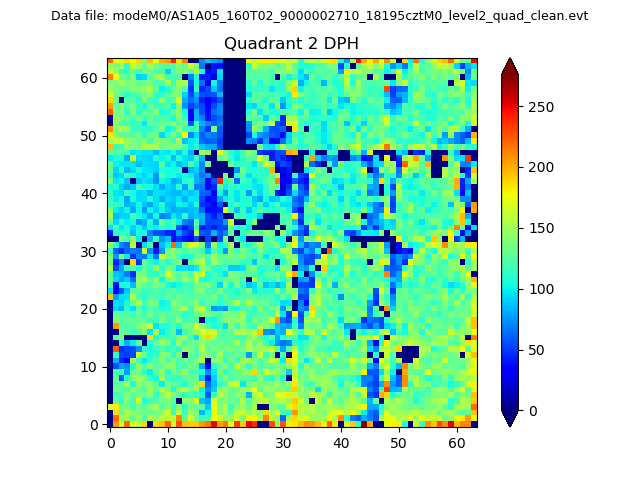 |
Quadrant C |
| Plot type | Count rate plots | Images |
|---|---|---|
| Comparison with Poisson distribution Blue bars denote a histogram of data divided into 1 sec bins. Red curve is a Poisson curve with rate = median count rate of data. |
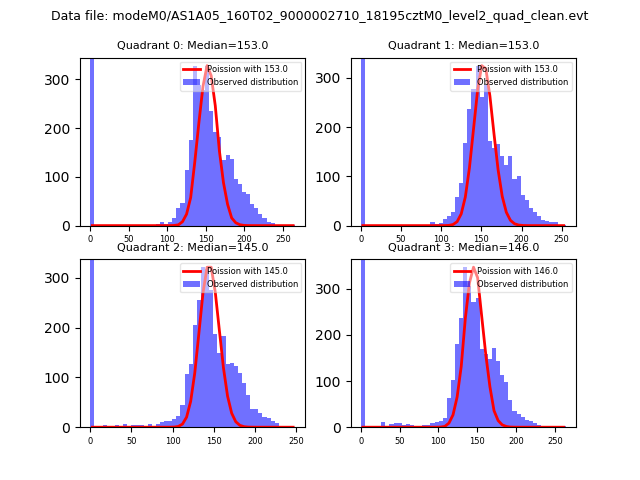 |
 |
| Quadrant-wise count rates Data is divided into 100 sec bins |
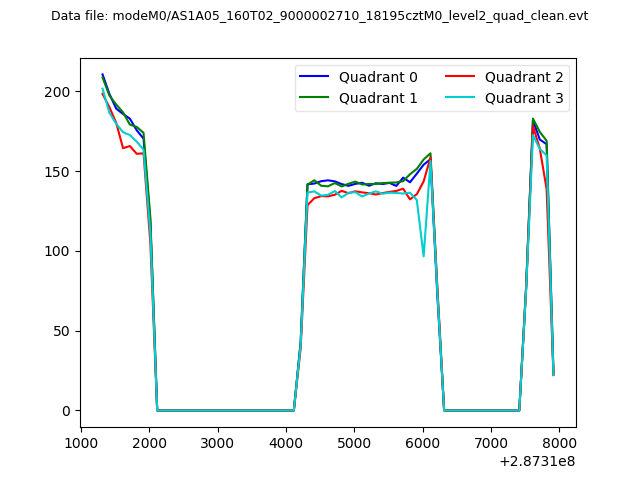 |
|
| Module-wise count rates for Quadrant A Data is divided into 100 sec bins |
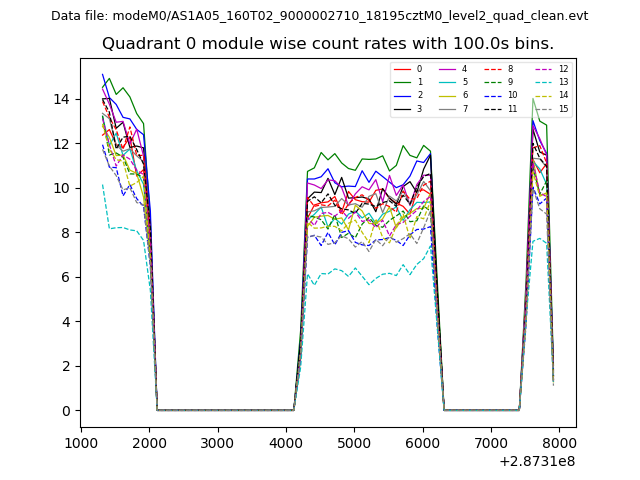 |
 |
| Module-wise count rates for Quadrant B Data is divided into 100 sec bins |
 |
 |
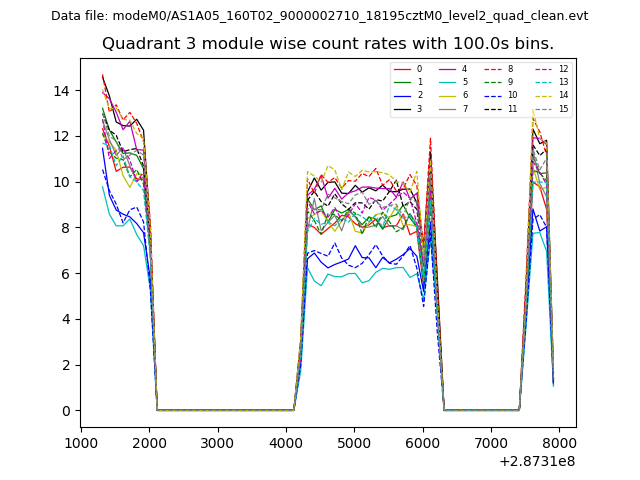
| Module-wise count rates for Quadrant C Data is divided into 100 sec bins |
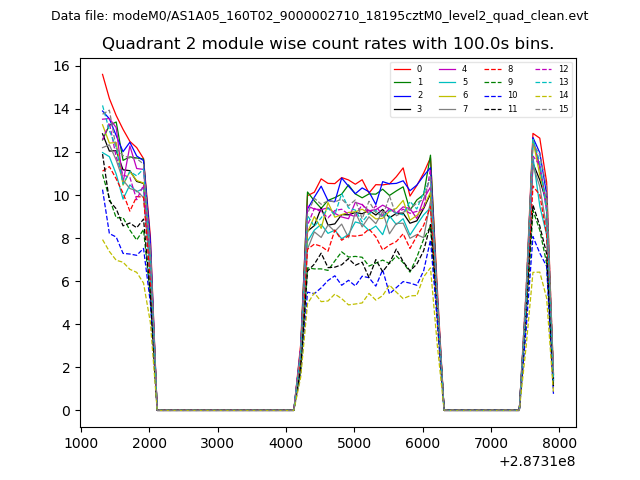 |
 |
| Module-wise count rates for Quadrant D Data is divided into 100 sec bins |
 |
 |
| Parameter | Plot |
|---|---|
| CZT HV Monitor |  |
| D_VDD | 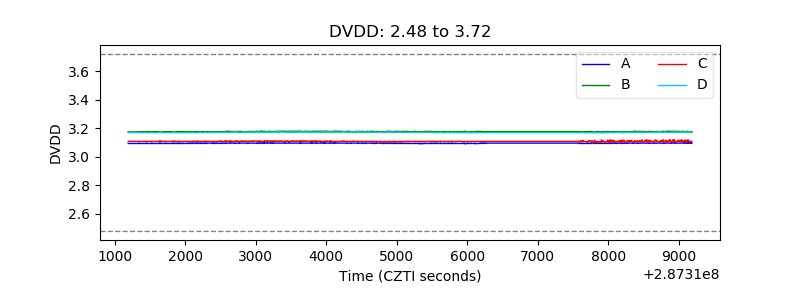 |
| Temperature 1 | 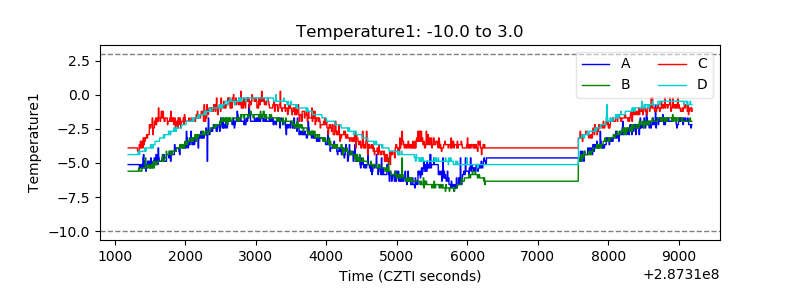 |
| Veto HV Monitor | 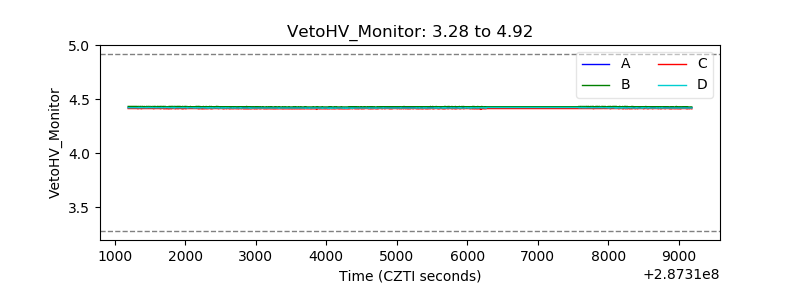 |
| Veto LLD | 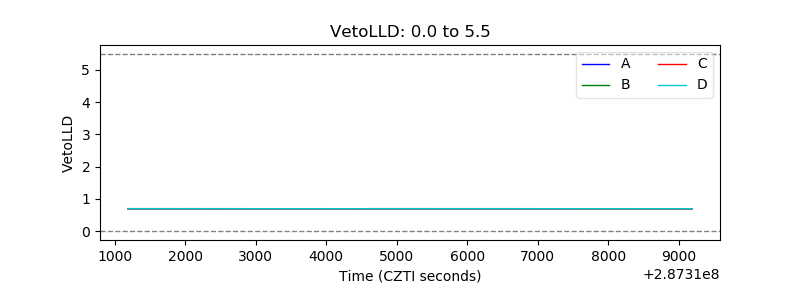 |
| Alpha Counter | 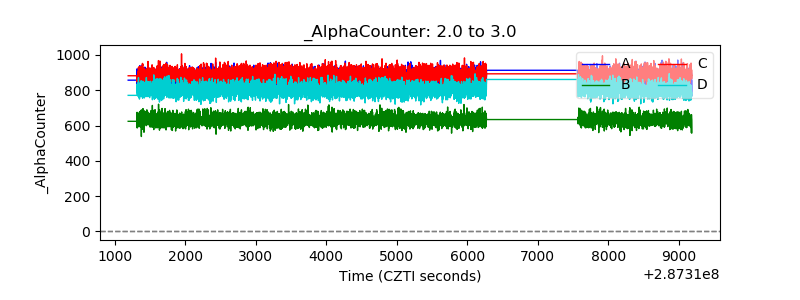 |
| _CPM_Rate | 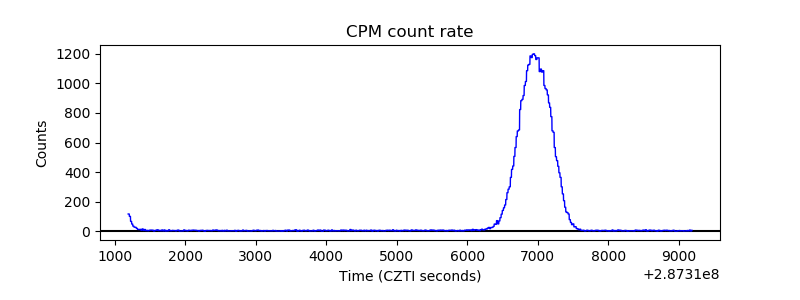 |
| CZT Counter | 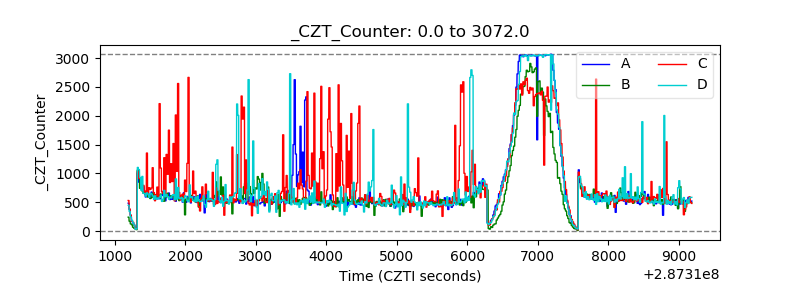 |
| +2.5 Volts monitor |  |
| +5 Volts monitor | 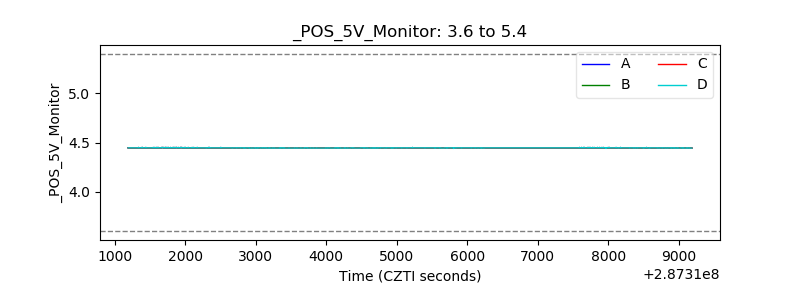 |
| _ROLL_ROT | 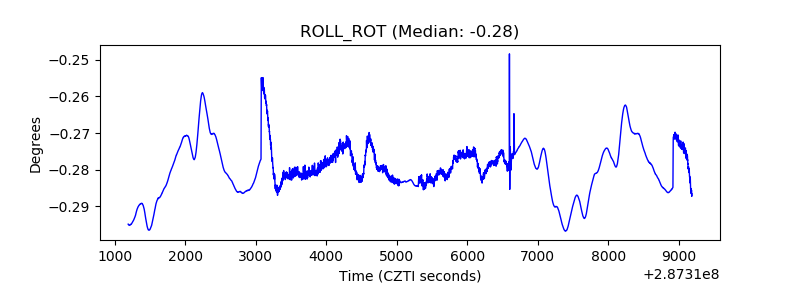 |
| _Roll_DEC | 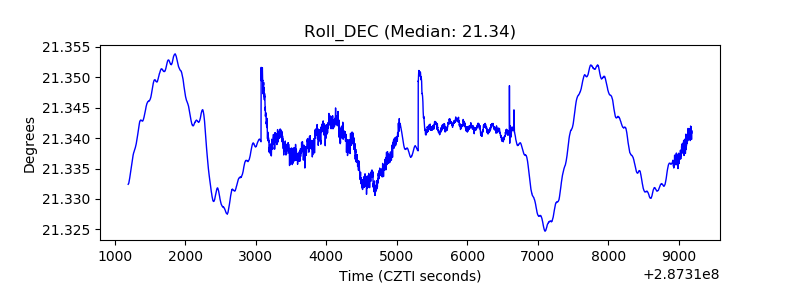 |
| _Roll_RA | 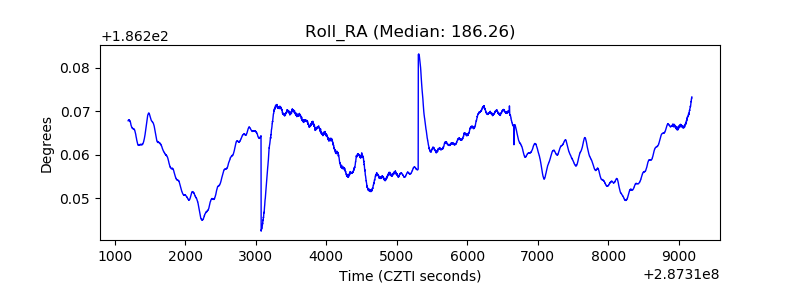 |
| Veto Counter | 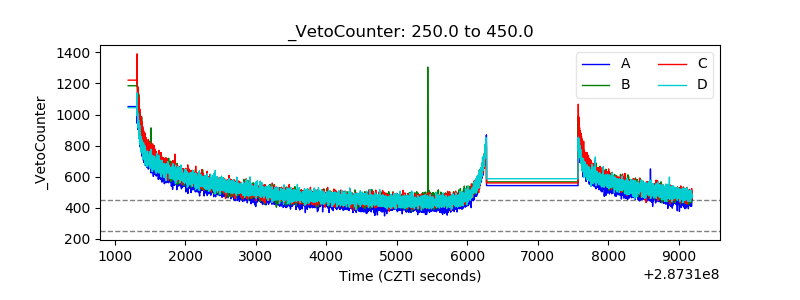 |