| Param | Original file | Final file |
|---|---|---|
| Filename | modeM0/AS1A05_160T02_9000002710_18196cztM0_level2.evt | modeM0/AS1A05_160T02_9000002710_18196cztM0_level2_quad_clean.evt |
| Size (bytes) | 513,970,560 | 69,762,240 |
| Size | 490.2 MB | 66.5 MB |
| Events in quadrant A | 3,445,522 | 418,766 |
| Events in quadrant B | 3,590,924 | 420,946 |
| Events in quadrant C | 3,725,535 | 404,481 |
| Events in quadrant D | 4,350,283 | 402,310 |
| Mode SS | |||
|---|---|---|---|
| Quadrant | BADHDUFLAG | Total packets | Discarded packets |
| A | 0 | 136 | 0 |
| B | 0 | 136 | 0 |
| C | 0 | 136 | 0 |
| D | 0 | 136 | 0 |
| Mode M9 | |||
|---|---|---|---|
| Quadrant | BADHDUFLAG | Total packets | Discarded packets |
| A | 0 | 12 | 0 |
| B | 0 | 13 | 0 |
| C | 0 | 13 | 0 |
| D | 0 | 13 | 0 |
| Mode M0 | |||
|---|---|---|---|
| Quadrant | BADHDUFLAG | Total packets | Discarded packets |
| A | 0 | 14163 | 2 |
| B | 0 | 14595 | 2 |
| C | 0 | 15021 | 2 |
| D | 0 | 17278 | 3 |
| Quadrant | Total seconds | Saturated seconds | Saturation percentage |
|---|---|---|---|
| A | 6680 | 136 | 2.035928% |
| B | 6680 | 148 | 2.215569% |
| C | 6680 | 192 | 2.874251% |
| D | 6679 | 205 | 3.069322% |
Noise dominated data is calculated using 1-second bins in cleaned event files. If a bin has >2000 counts, and if more than 50% of those come from <1% of pixels, then it is considered to be noise-dominated and hence unusable.
| Quadrant | # 1 sec bins | Bins with >0 counts | Bins with >2000 counts | High rate bins dominated by noise | Noise dominated (total time) | Noise dominated (detector-on time) | Marked lightcurve |
|---|---|---|---|---|---|---|---|
| A | 7805 | 6681 | 0 | 0 | 0.00% | 0.00% | 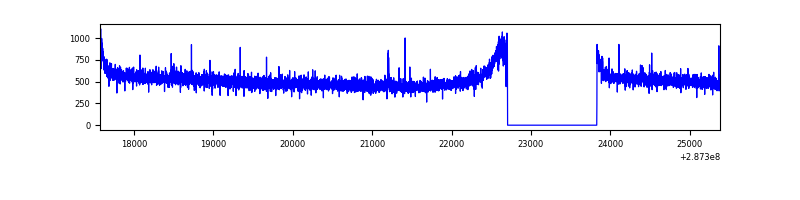 |
| B | 7805 | 6681 | 15 | 15 | 0.19% | 0.22% | 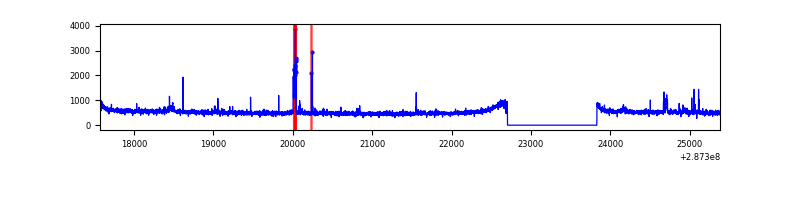 |
| C | 7805 | 6681 | 29 | 29 | 0.37% | 0.43% | 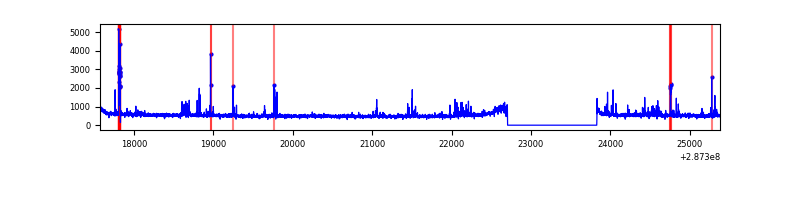 |
| D | 7804 | 6680 | 73 | 73 | 0.94% | 1.09% | 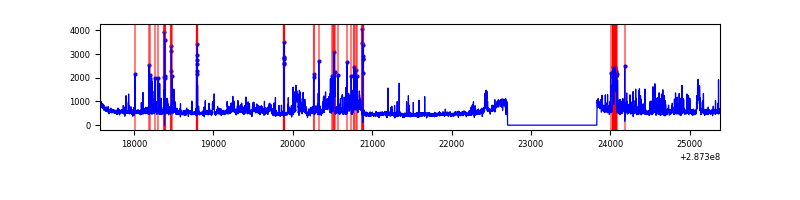 |
Top three noisy pixels from each quadrant. If the there are fewer than three noisy pixels in the level2.evt file, extra rows are filled as -1
| Pixel properties | Quadrant properties | ||||||
|---|---|---|---|---|---|---|---|
| Quadrant | DetID | PixID | Counts | Sigma | Mean | Median | Sigma |
| A | 15 | 174 | 10414 | 53.11 | 893 | 875 | 179.6 |
| A | 0 | 226 | 7907 | 39.15 | 893 | 875 | 179.6 |
| A | 12 | 194 | 6774 | 32.84 | 893 | 875 | 179.6 |
| B | 5 | 172 | 57845 | 339.4 | 878 | 858 | 167.9 |
| B | 4 | 171 | 26539 | 152.95 | 878 | 858 | 167.9 |
| B | 0 | 229 | 20081 | 114.49 | 878 | 858 | 167.9 |
| C | 4 | 254 | 270565 | 1367.76 | 848 | 855 | 197.2 |
| C | 14 | 238 | 131490 | 662.48 | 848 | 855 | 197.2 |
| C | 8 | 128 | 10304 | 47.92 | 848 | 855 | 197.2 |
| D | 7 | 238 | 577535 | 2699.43 | 870 | 845 | 213.6 |
| D | 5 | 222 | 192283 | 896.1 | 870 | 845 | 213.6 |
| D | 10 | 70 | 163738 | 762.49 | 870 | 845 | 213.6 |
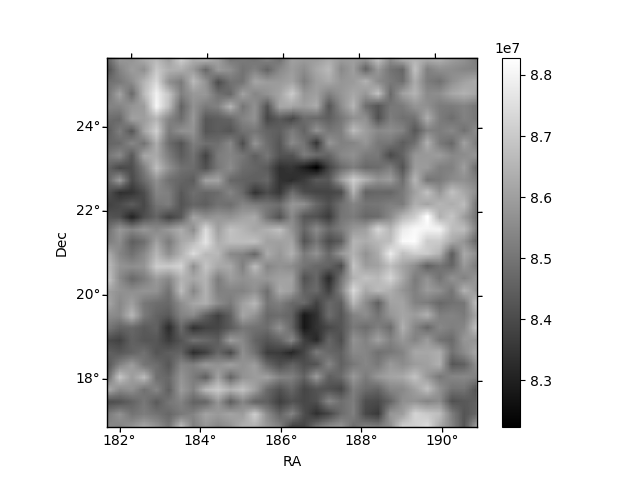
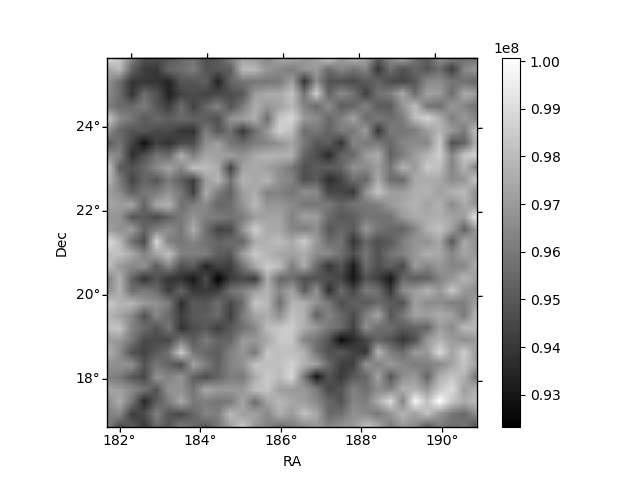
Histogram calculated using DETX and DETY for each event in the final _common_clean file
| Quadrant A | 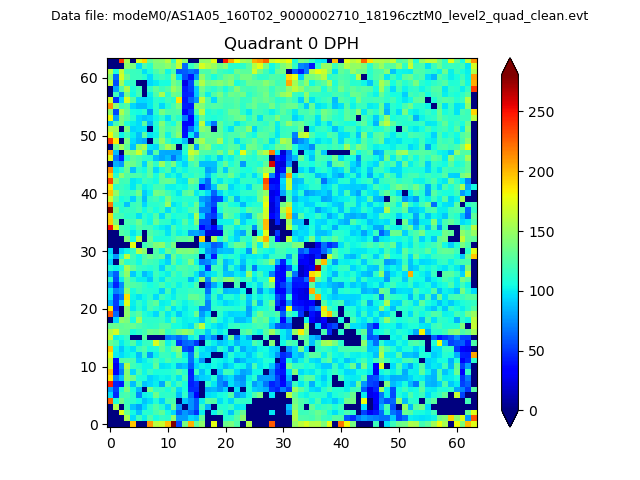 |
 |
Quadrant B |
|---|---|---|---|
| Quadrant D |  |
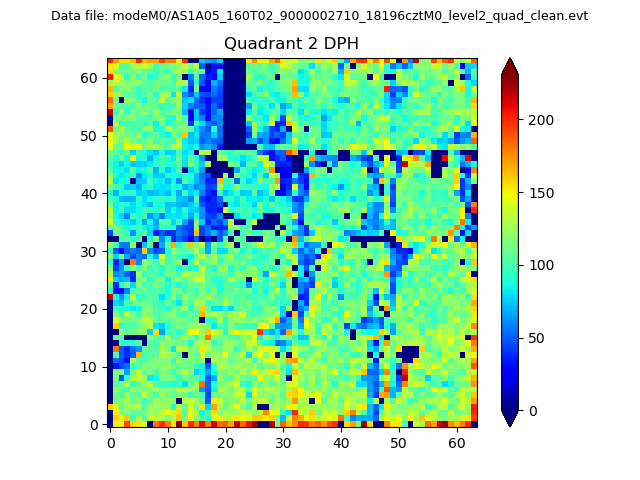 |
Quadrant C |
| Plot type | Count rate plots | Images |
|---|---|---|
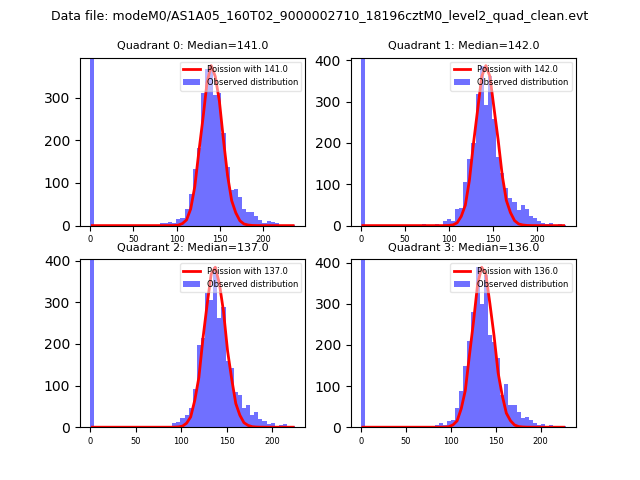
| Comparison with Poisson distribution Blue bars denote a histogram of data divided into 1 sec bins. Red curve is a Poisson curve with rate = median count rate of data. |
 |
 |
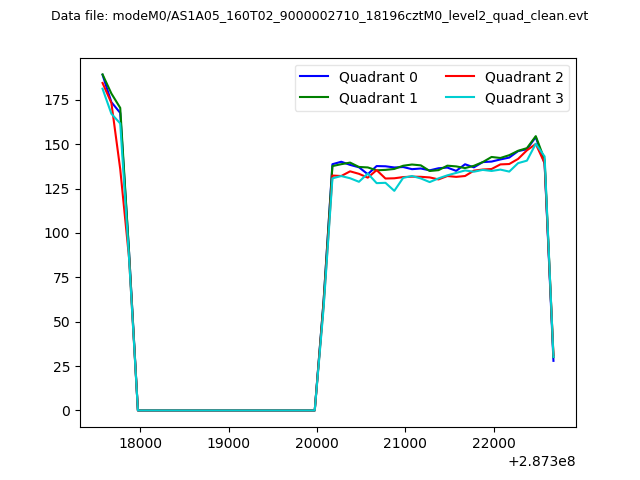
| Quadrant-wise count rates Data is divided into 100 sec bins |
 |
|
| Module-wise count rates for Quadrant A Data is divided into 100 sec bins |
 |
 |
| Module-wise count rates for Quadrant B Data is divided into 100 sec bins |
 |
 |
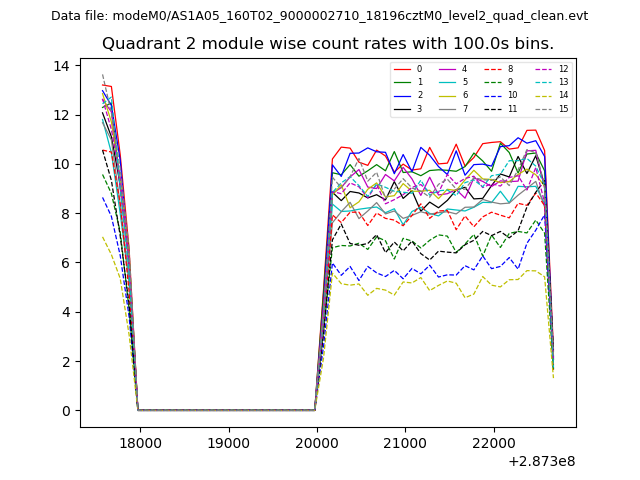
| Module-wise count rates for Quadrant C Data is divided into 100 sec bins |
 |
 |
| Module-wise count rates for Quadrant D Data is divided into 100 sec bins |
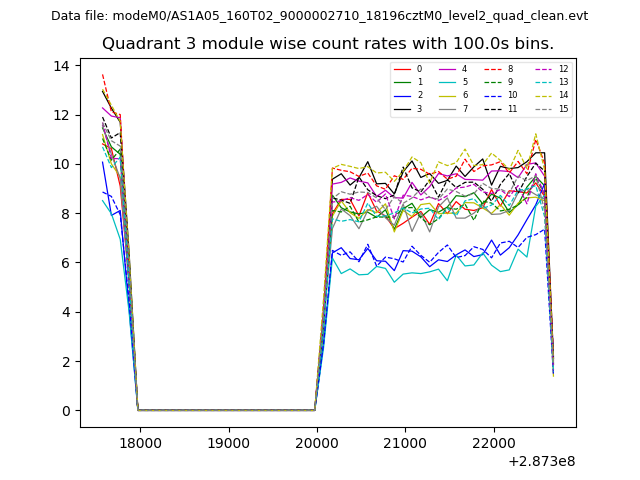 |
 |
| Parameter | Plot |
|---|---|
| CZT HV Monitor | 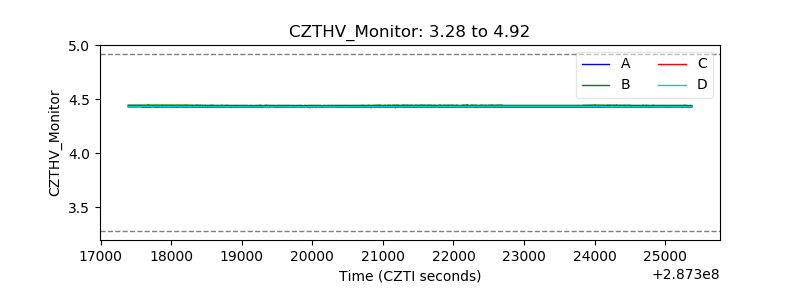 |
| D_VDD | 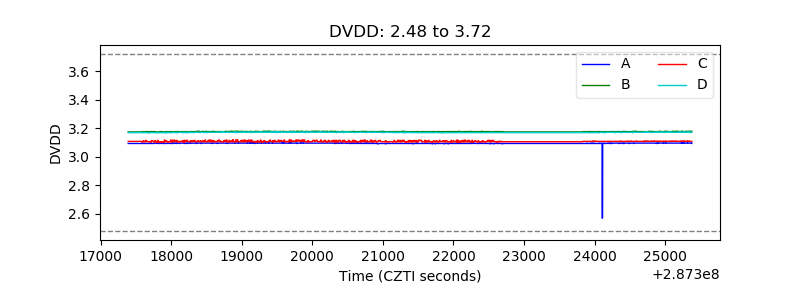 |
| Temperature 1 | 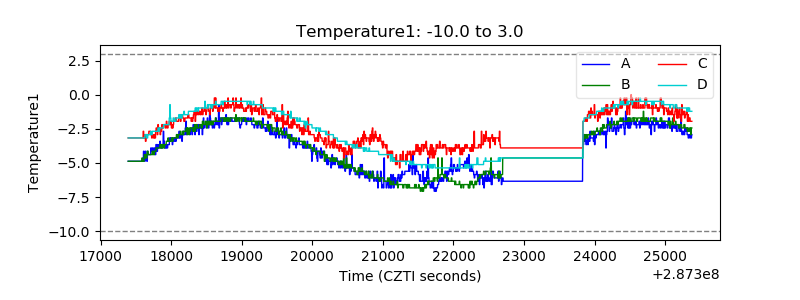 |
| Veto HV Monitor | 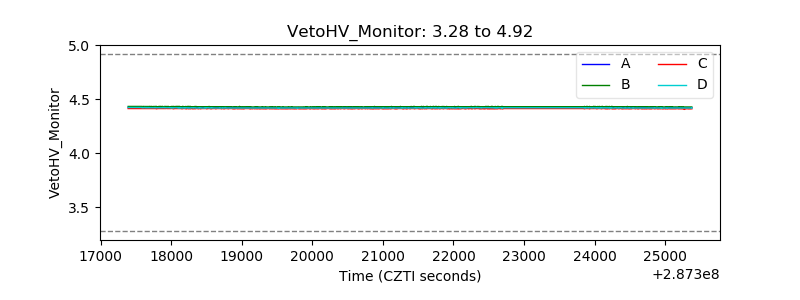 |
| Veto LLD | 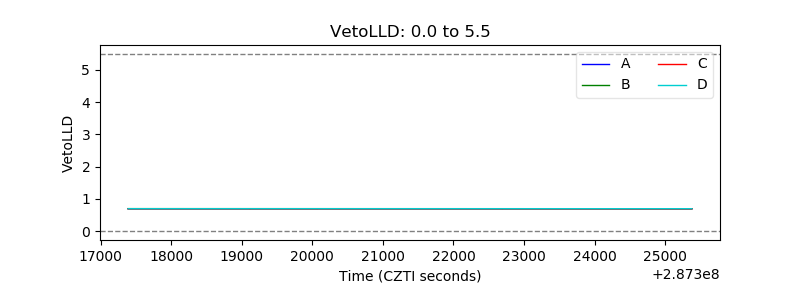 |
| Alpha Counter | 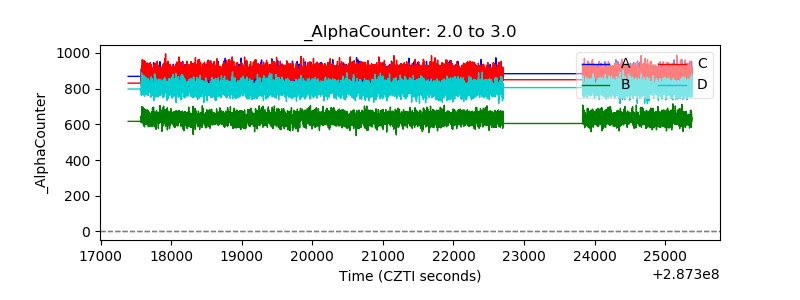 |
| _CPM_Rate | 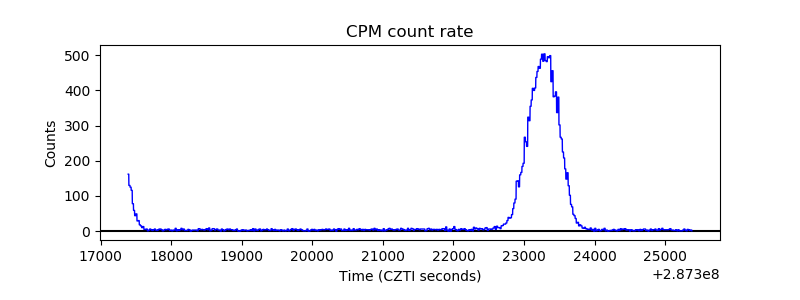 |
| CZT Counter | 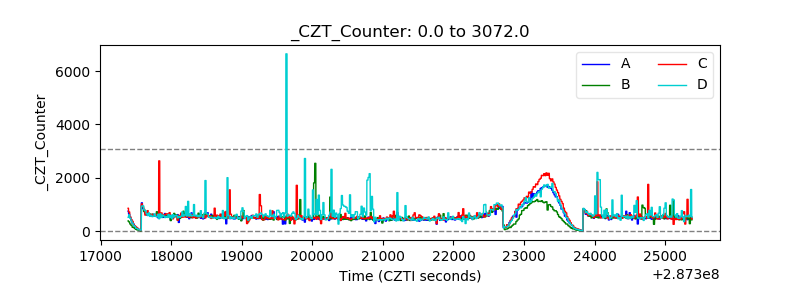 |
| +2.5 Volts monitor |  |
| +5 Volts monitor |  |
| _ROLL_ROT | 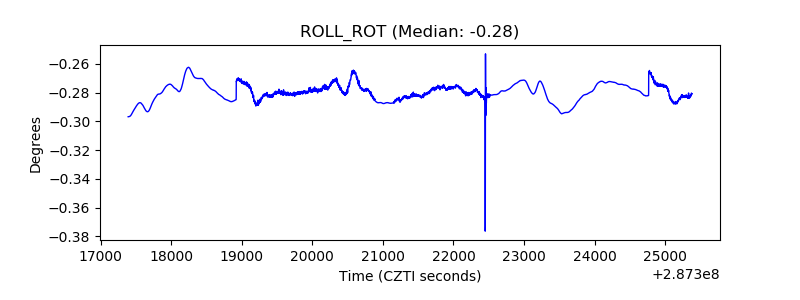 |
| _Roll_DEC | 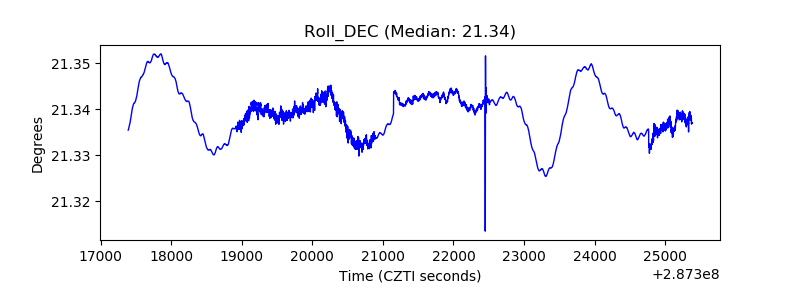 |
| _Roll_RA | 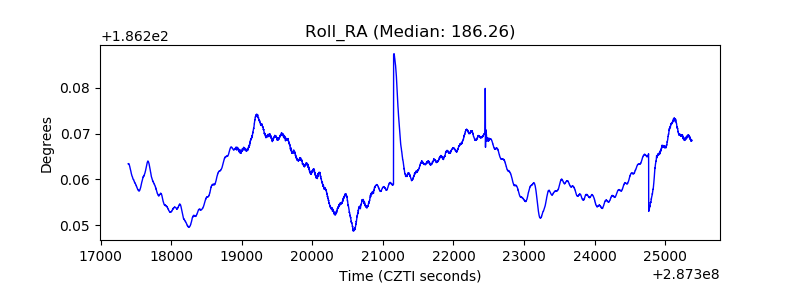 |
| Veto Counter | 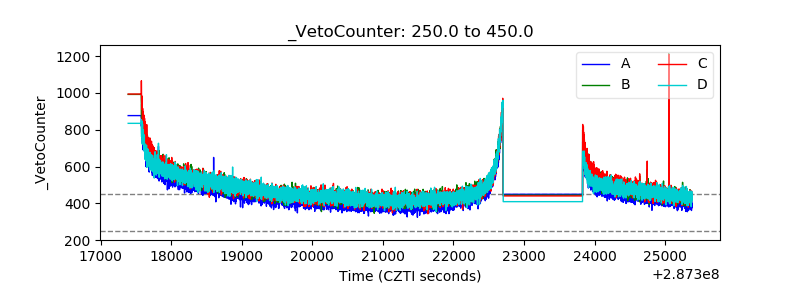 |