| Param | Original file | Final file |
|---|---|---|
| Filename | modeM0/AS1A05_160T02_9000002710_18197cztM0_level2.evt | modeM0/AS1A05_160T02_9000002710_18197cztM0_level2_quad_clean.evt |
| Size (bytes) | 522,933,120 | 72,270,720 |
| Size | 498.7 MB | 68.9 MB |
| Events in quadrant A | 3,410,563 | 433,259 |
| Events in quadrant B | 3,497,593 | 434,380 |
| Events in quadrant C | 3,750,641 | 421,423 |
| Events in quadrant D | 4,711,778 | 420,082 |
| Mode SS | |||
|---|---|---|---|
| Quadrant | BADHDUFLAG | Total packets | Discarded packets |
| A | 0 | 140 | 0 |
| B | 0 | 140 | 0 |
| C | 0 | 140 | 0 |
| D | 0 | 140 | 0 |
| Mode M9 | |||
|---|---|---|---|
| Quadrant | BADHDUFLAG | Total packets | Discarded packets |
| A | 0 | 8 | 0 |
| B | 0 | 9 | 0 |
| C | 0 | 9 | 0 |
| D | 0 | 9 | 0 |
| Mode M0 | |||
|---|---|---|---|
| Quadrant | BADHDUFLAG | Total packets | Discarded packets |
| A | 0 | 14357 | 2 |
| B | 0 | 14609 | 2 |
| C | 0 | 15387 | 2 |
| D | 0 | 18600 | 2 |
| Quadrant | Total seconds | Saturated seconds | Saturation percentage |
|---|---|---|---|
| A | 6874 | 73 | 1.061973% |
| B | 6874 | 85 | 1.236543% |
| C | 6874 | 191 | 2.778586% |
| D | 6873 | 206 | 2.997236% |
Noise dominated data is calculated using 1-second bins in cleaned event files. If a bin has >2000 counts, and if more than 50% of those come from <1% of pixels, then it is considered to be noise-dominated and hence unusable.
| Quadrant | # 1 sec bins | Bins with >0 counts | Bins with >2000 counts | High rate bins dominated by noise | Noise dominated (total time) | Noise dominated (detector-on time) | Marked lightcurve |
|---|---|---|---|---|---|---|---|
| A | 7679 | 6876 | 1 | 1 | 0.01% | 0.01% | 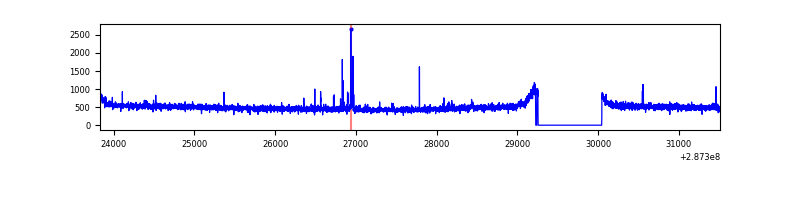 |
| B | 7679 | 6876 | 1 | 1 | 0.01% | 0.01% | 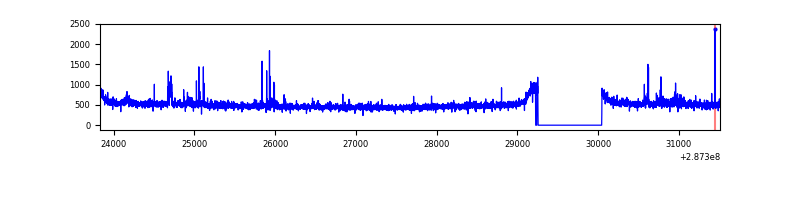 |
| C | 7679 | 6876 | 50 | 50 | 0.65% | 0.73% | 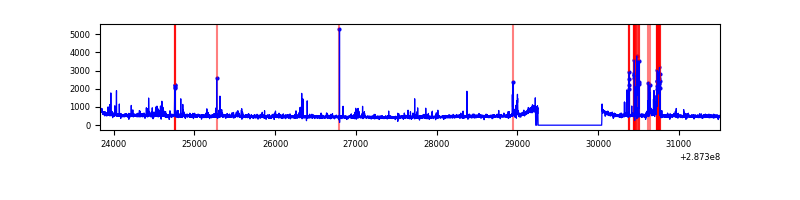 |
| D | 7678 | 6875 | 98 | 98 | 1.28% | 1.43% | 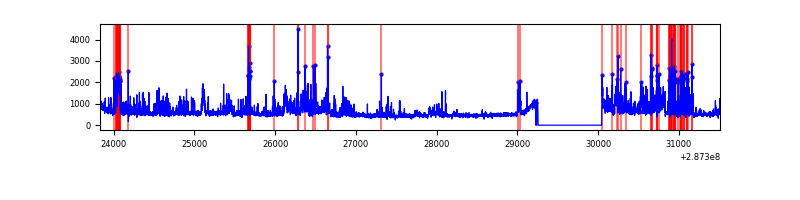 |
Top three noisy pixels from each quadrant. If the there are fewer than three noisy pixels in the level2.evt file, extra rows are filled as -1
| Pixel properties | Quadrant properties | ||||||
|---|---|---|---|---|---|---|---|
| Quadrant | DetID | PixID | Counts | Sigma | Mean | Median | Sigma |
| A | 15 | 174 | 38441 | 212.58 | 874 | 857 | 176.8 |
| A | 4 | 2 | 10032 | 51.9 | 874 | 857 | 176.8 |
| A | 0 | 226 | 7766 | 39.08 | 874 | 857 | 176.8 |
| B | 7 | 220 | 32005 | 185.22 | 866 | 844 | 168.2 |
| B | 4 | 171 | 21396 | 122.16 | 866 | 844 | 168.2 |
| B | 12 | 111 | 19451 | 110.6 | 866 | 844 | 168.2 |
| C | 4 | 254 | 375030 | 1915.58 | 831 | 838 | 195.3 |
| C | 14 | 238 | 129531 | 658.81 | 831 | 838 | 195.3 |
| C | 13 | 61 | 5978 | 26.31 | 831 | 838 | 195.3 |
| D | 5 | 222 | 942116 | 4511.45 | 849 | 825 | 208.6 |
| D | 7 | 238 | 440160 | 2105.66 | 849 | 825 | 208.6 |
| D | 10 | 70 | 45204 | 212.7 | 849 | 825 | 208.6 |
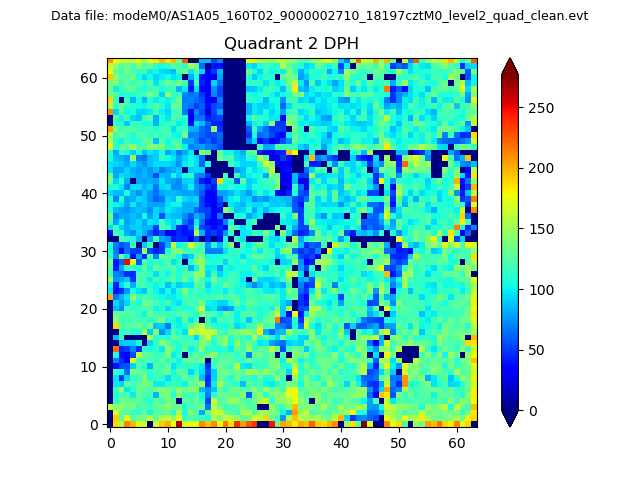
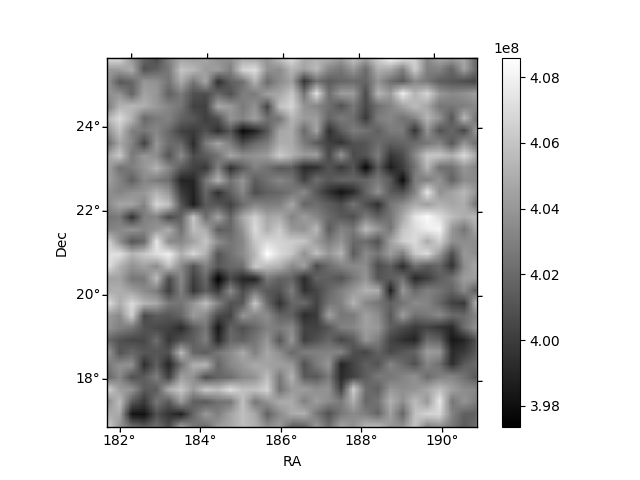
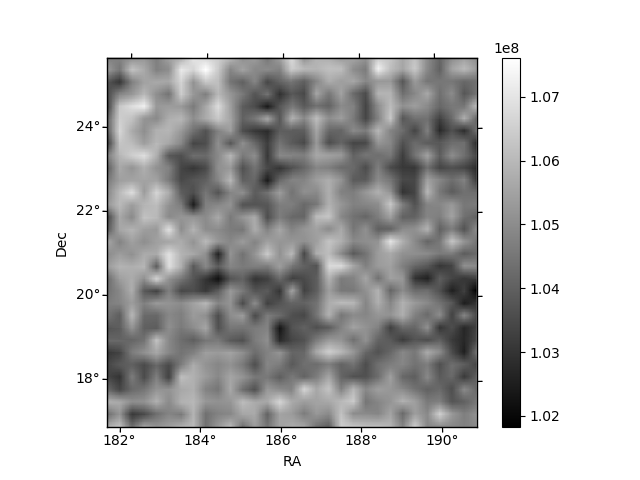
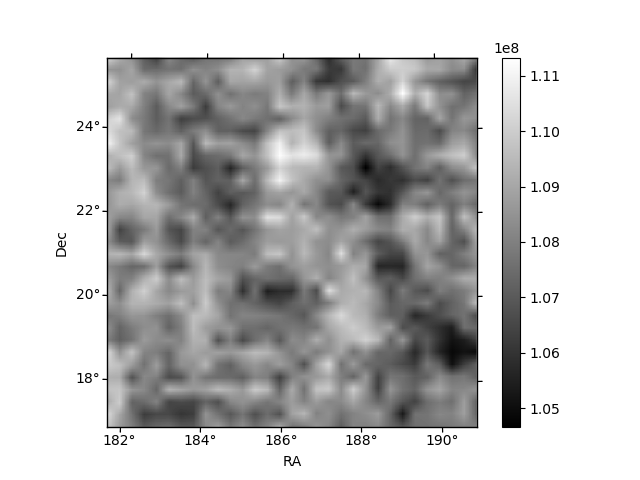
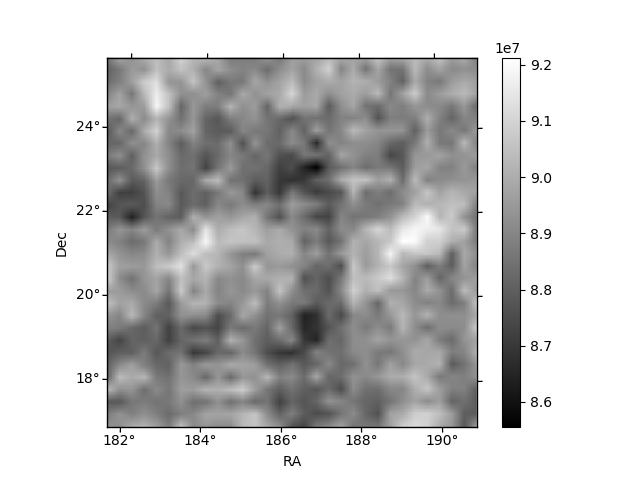
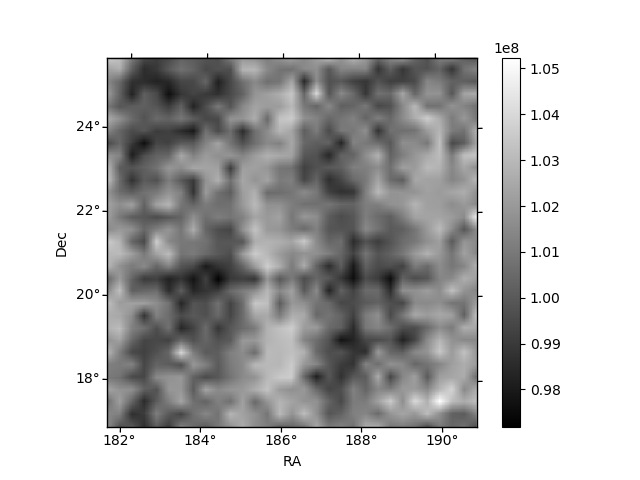
Histogram calculated using DETX and DETY for each event in the final _common_clean file
| Quadrant A | 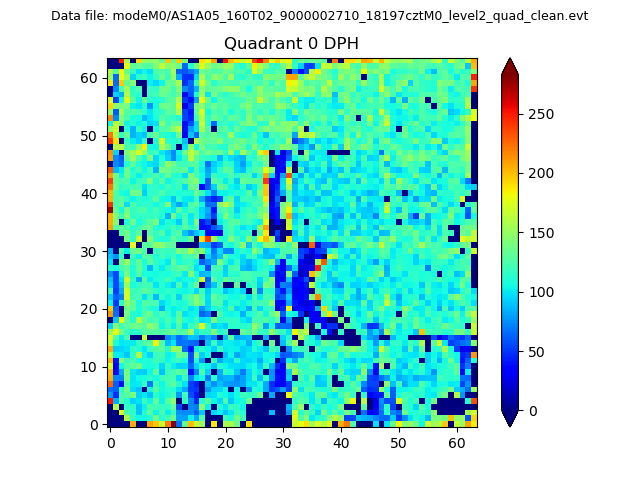 |
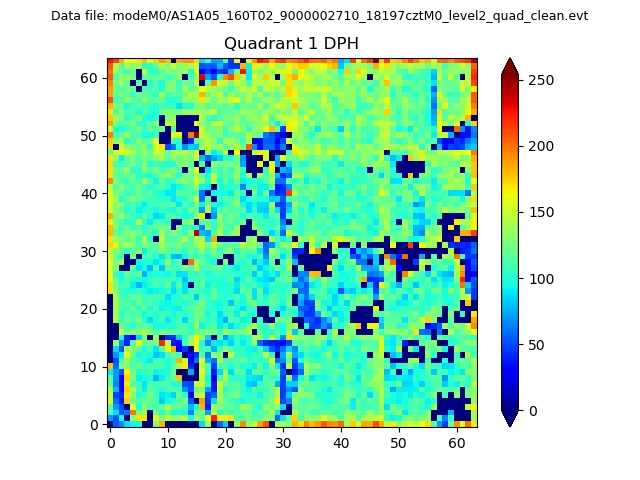 |
Quadrant B |
|---|---|---|---|
| Quadrant D | 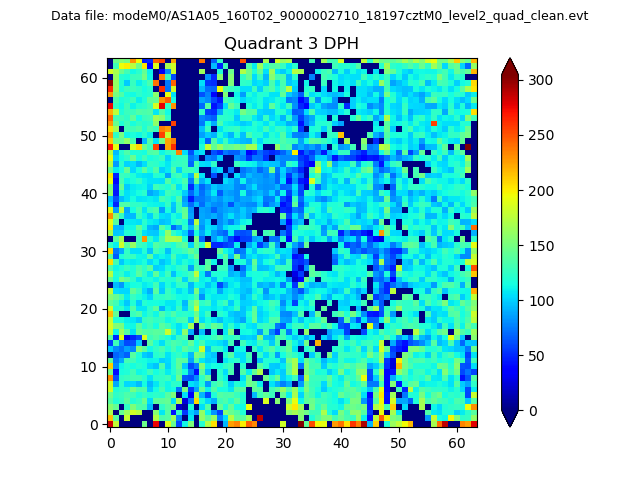 |
 |
Quadrant C |
| Plot type | Count rate plots | Images |
|---|---|---|
| Comparison with Poisson distribution Blue bars denote a histogram of data divided into 1 sec bins. Red curve is a Poisson curve with rate = median count rate of data. |
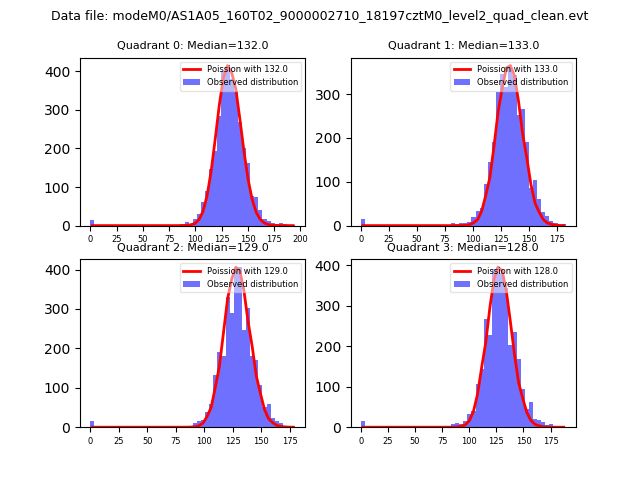 |
 |
| Quadrant-wise count rates Data is divided into 100 sec bins |
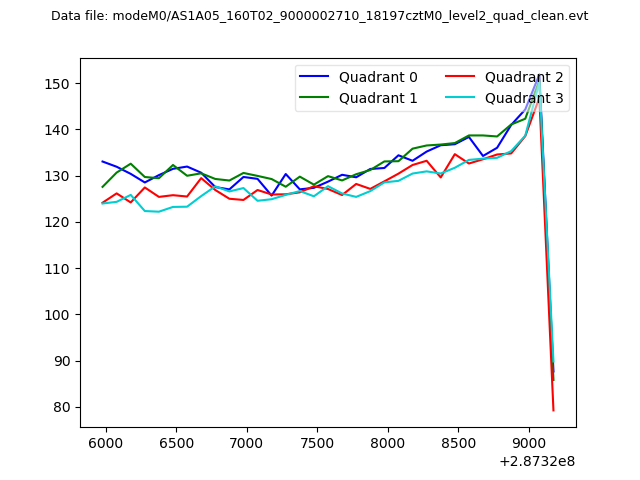 |
|
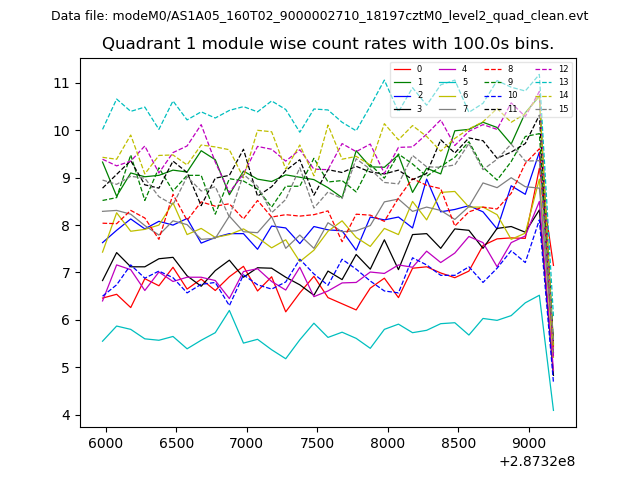
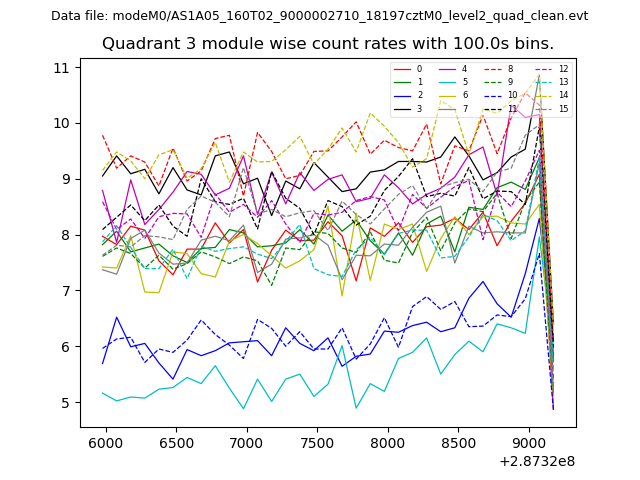
| Module-wise count rates for Quadrant A Data is divided into 100 sec bins |
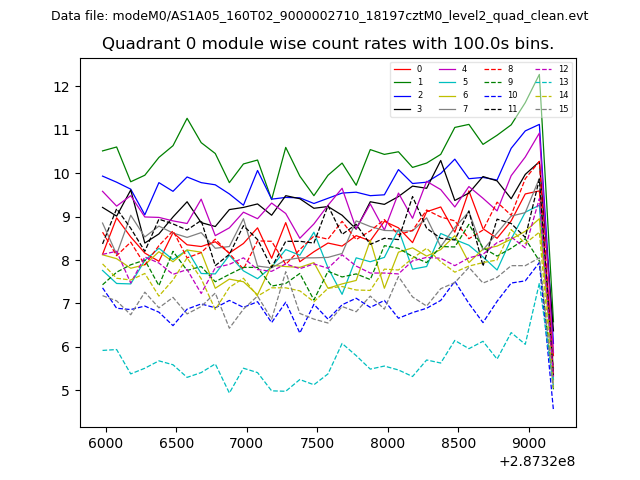 |
 |
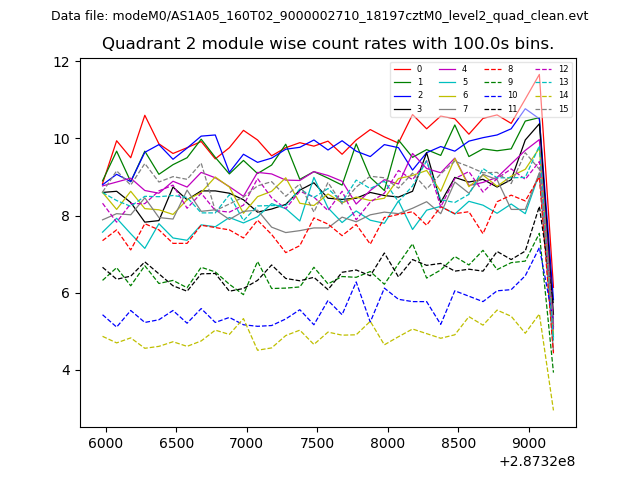
| Module-wise count rates for Quadrant B Data is divided into 100 sec bins |
 |
 |
| Module-wise count rates for Quadrant C Data is divided into 100 sec bins |
 |
 |
| Module-wise count rates for Quadrant D Data is divided into 100 sec bins |
 |
 |
| Parameter | Plot |
|---|---|
| CZT HV Monitor | 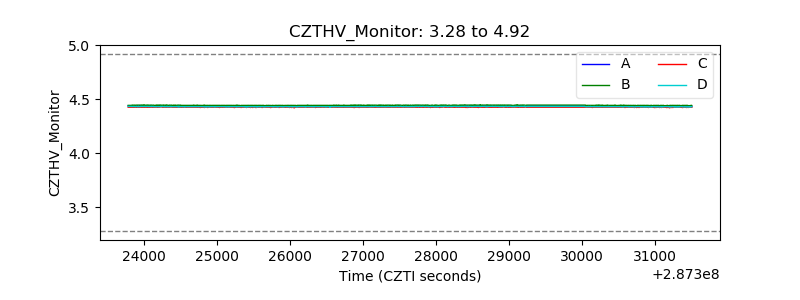 |
| D_VDD | 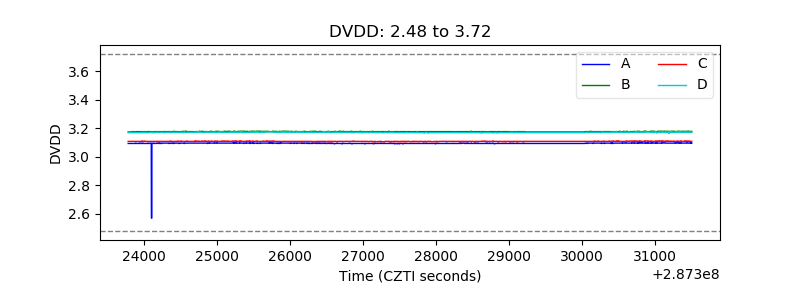 |
| Temperature 1 | 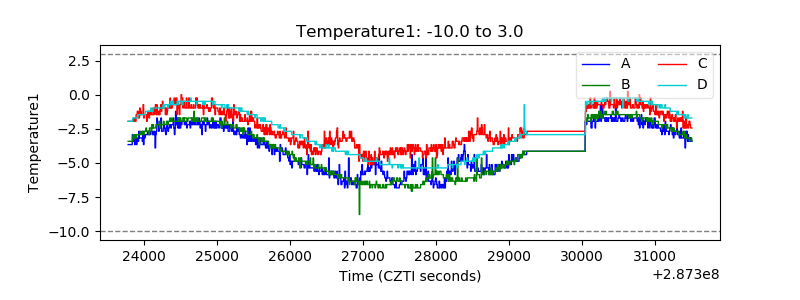 |
| Veto HV Monitor | 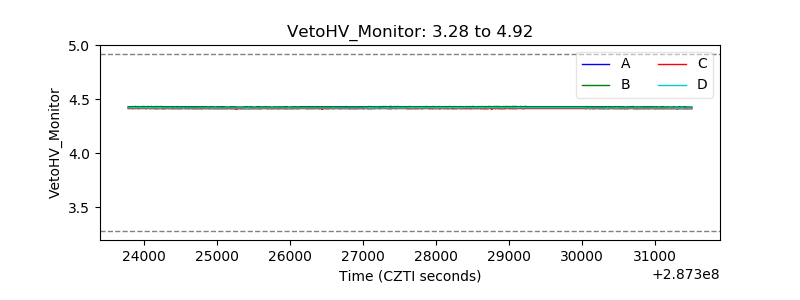 |
| Veto LLD | 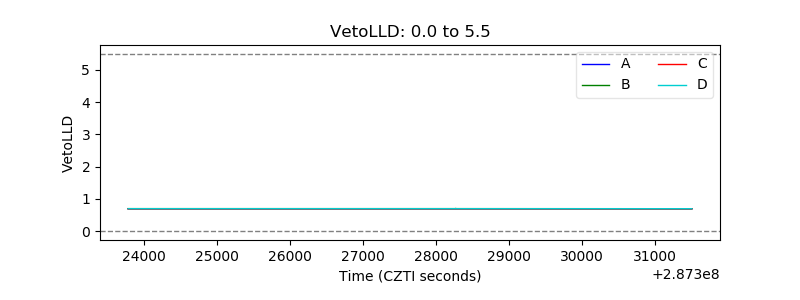 |
| Alpha Counter | 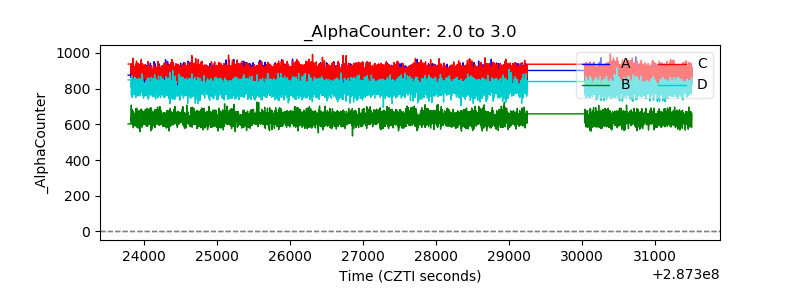 |
| _CPM_Rate | 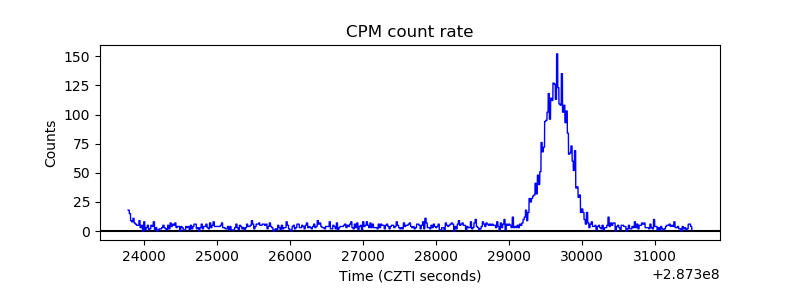 |
| CZT Counter | 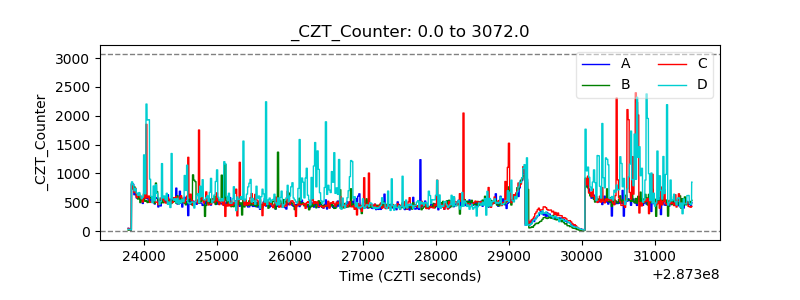 |
| +2.5 Volts monitor |  |
| +5 Volts monitor |  |
| _ROLL_ROT | 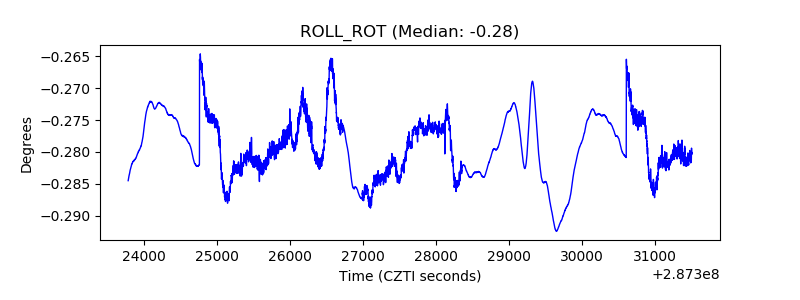 |
| _Roll_DEC | 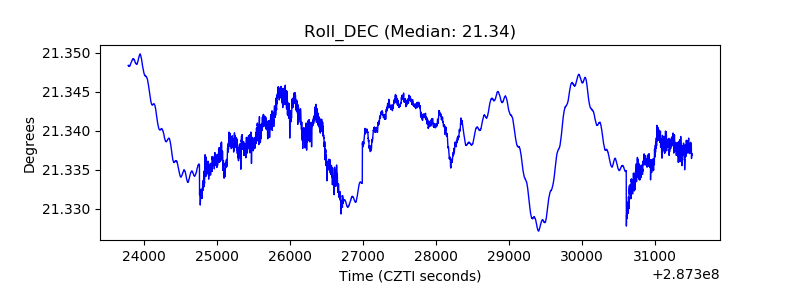 |
| _Roll_RA | 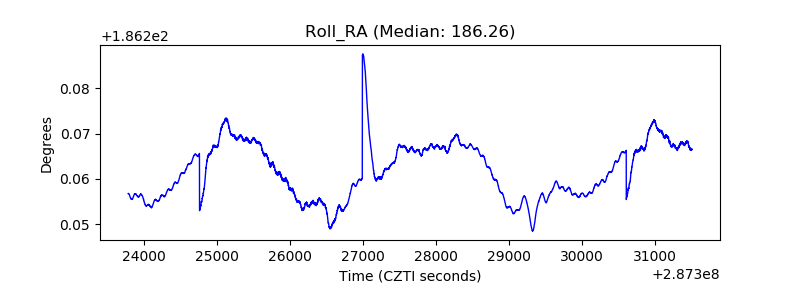 |
| Veto Counter | 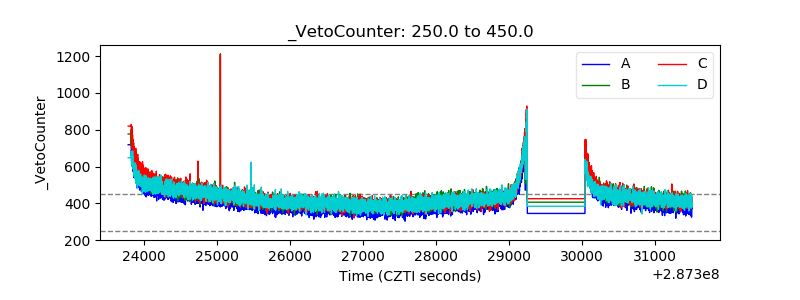 |