| Param | Original file | Final file |
|---|---|---|
| Filename | modeM0/AS1A05_160T02_9000002710_18198cztM0_level2.evt | modeM0/AS1A05_160T02_9000002710_18198cztM0_level2_quad_clean.evt |
| Size (bytes) | 591,981,120 | 81,610,560 |
| Size | 564.6 MB | 77.8 MB |
| Events in quadrant A | 3,741,873 | 496,430 |
| Events in quadrant B | 3,915,731 | 500,469 |
| Events in quadrant C | 4,108,228 | 482,955 |
| Events in quadrant D | 5,651,724 | 467,352 |
| Mode SS | |||
|---|---|---|---|
| Quadrant | BADHDUFLAG | Total packets | Discarded packets |
| A | 0 | 152 | 0 |
| B | 0 | 152 | 0 |
| C | 0 | 152 | 0 |
| D | 0 | 152 | 0 |
| Mode M9 | |||
|---|---|---|---|
| Quadrant | BADHDUFLAG | Total packets | Discarded packets |
| A | 0 | 12 | 0 |
| B | 0 | 12 | 0 |
| C | 0 | 12 | 0 |
| D | 0 | 12 | 0 |
| Mode M0 | |||
|---|---|---|---|
| Quadrant | BADHDUFLAG | Total packets | Discarded packets |
| A | 0 | 15967 | 2 |
| B | 0 | 16438 | 2 |
| C | 0 | 16972 | 2 |
| D | 0 | 21760 | 2 |
| Quadrant | Total seconds | Saturated seconds | Saturation percentage |
|---|---|---|---|
| A | 7537 | 158 | 2.096325% |
| B | 7538 | 205 | 2.719554% |
| C | 7538 | 315 | 4.178827% |
| D | 7538 | 534 | 7.084107% |
Noise dominated data is calculated using 1-second bins in cleaned event files. If a bin has >2000 counts, and if more than 50% of those come from <1% of pixels, then it is considered to be noise-dominated and hence unusable.
| Quadrant | # 1 sec bins | Bins with >0 counts | Bins with >2000 counts | High rate bins dominated by noise | Noise dominated (total time) | Noise dominated (detector-on time) | Marked lightcurve |
|---|---|---|---|---|---|---|---|
| A | 8687 | 7540 | 8 | 8 | 0.09% | 0.11% | 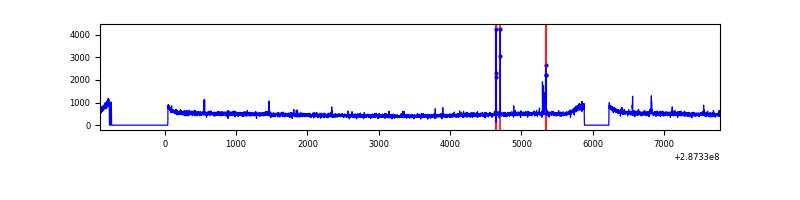 |
| B | 8688 | 7541 | 9 | 9 | 0.10% | 0.12% | 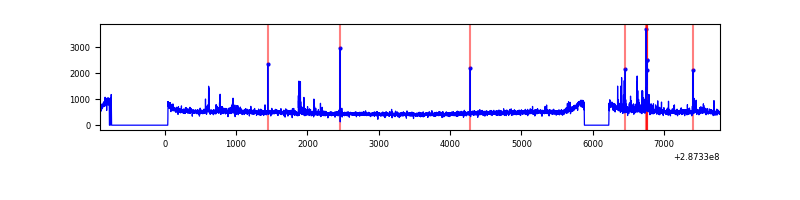 |
| C | 8688 | 7541 | 63 | 63 | 0.73% | 0.84% | 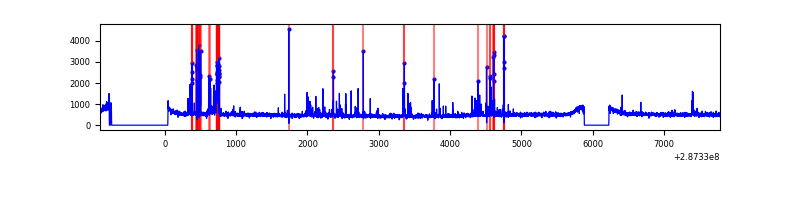 |
| D | 8688 | 7541 | 330 | 330 | 3.80% | 4.38% | 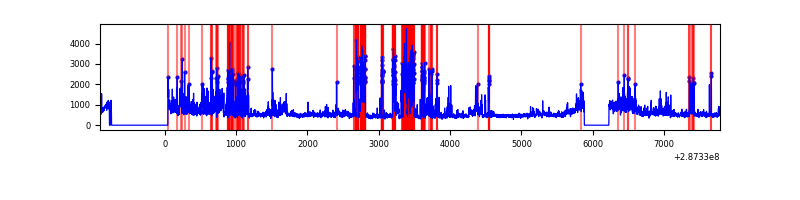 |
Top three noisy pixels from each quadrant. If the there are fewer than three noisy pixels in the level2.evt file, extra rows are filled as -1
| Pixel properties | Quadrant properties | ||||||
|---|---|---|---|---|---|---|---|
| Quadrant | DetID | PixID | Counts | Sigma | Mean | Median | Sigma |
| A | 15 | 174 | 57664 | 292.91 | 955 | 933 | 193.7 |
| A | 4 | 2 | 12174 | 58.04 | 955 | 933 | 193.7 |
| A | 0 | 226 | 8417 | 38.64 | 955 | 933 | 193.7 |
| B | 7 | 220 | 88901 | 476.9 | 947 | 924 | 184.5 |
| B | 0 | 229 | 23600 | 122.92 | 947 | 924 | 184.5 |
| B | 12 | 111 | 21495 | 111.51 | 947 | 924 | 184.5 |
| C | 4 | 254 | 420924 | 1963.63 | 906 | 908 | 213.9 |
| C | 14 | 238 | 138220 | 641.95 | 906 | 908 | 213.9 |
| C | 3 | 233 | 9886 | 41.97 | 906 | 908 | 213.9 |
| D | 5 | 222 | 1020327 | 4527.26 | 918 | 891 | 225.2 |
| D | 7 | 238 | 962729 | 4271.47 | 918 | 891 | 225.2 |
| D | 1 | 52 | 103057 | 453.71 | 918 | 891 | 225.2 |
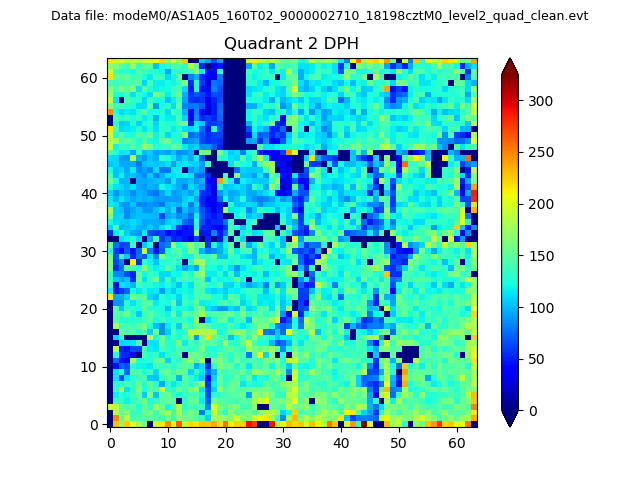
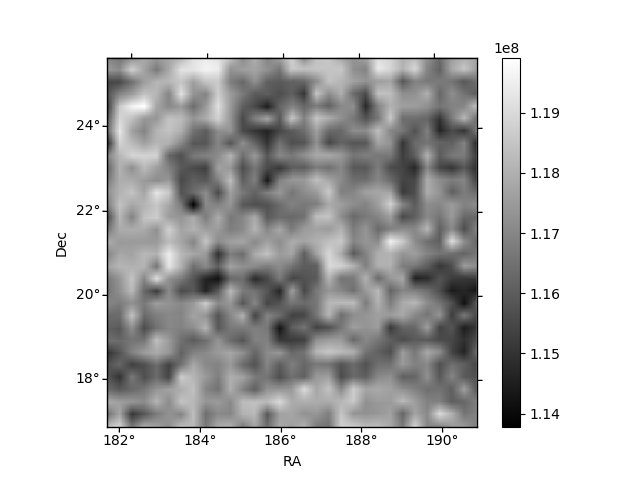
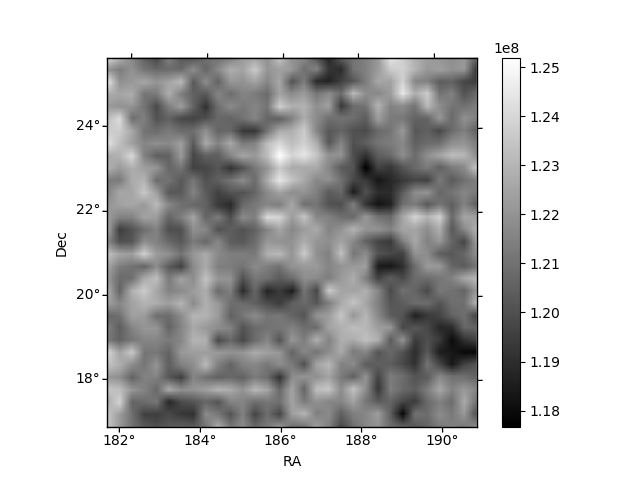
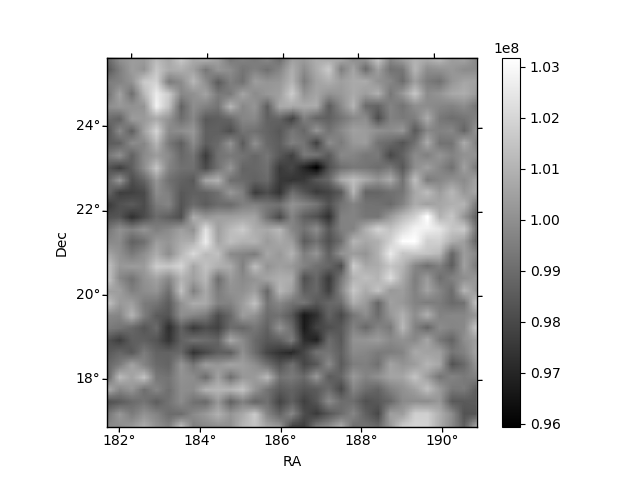
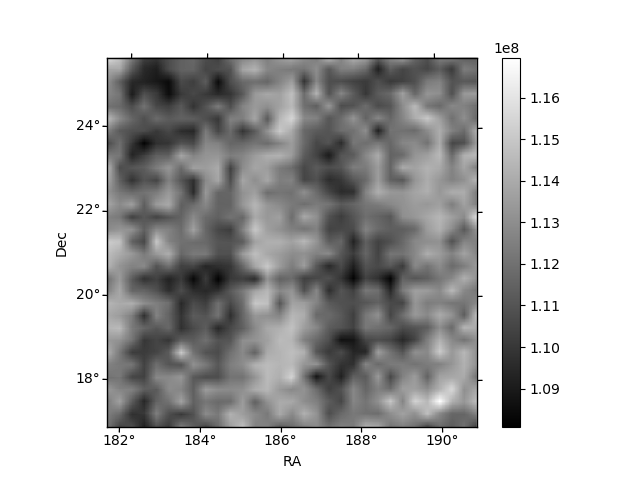
Histogram calculated using DETX and DETY for each event in the final _common_clean file
| Quadrant A | 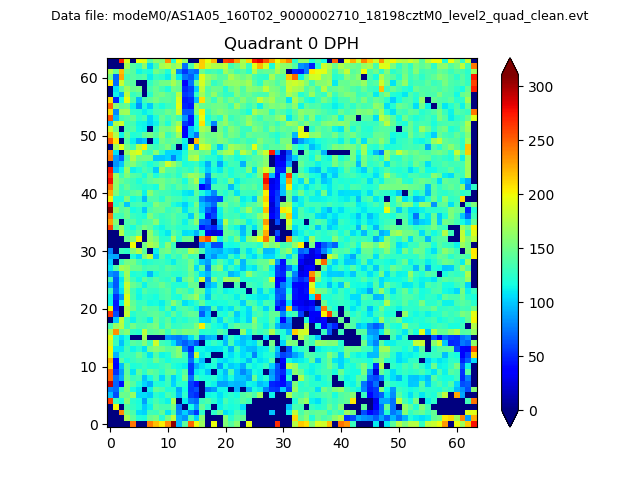 |
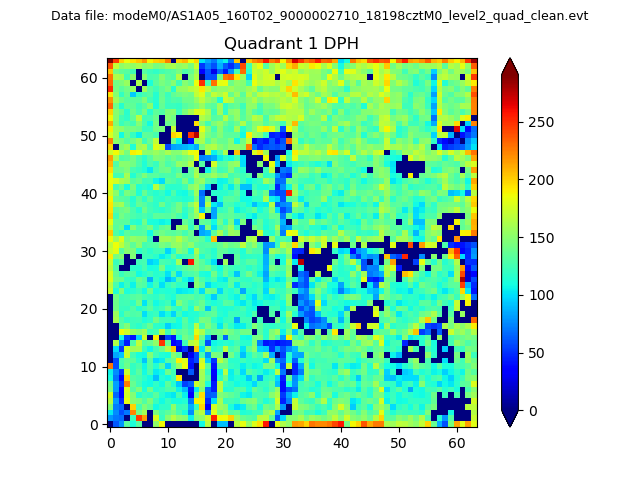 |
Quadrant B |
|---|---|---|---|
| Quadrant D | 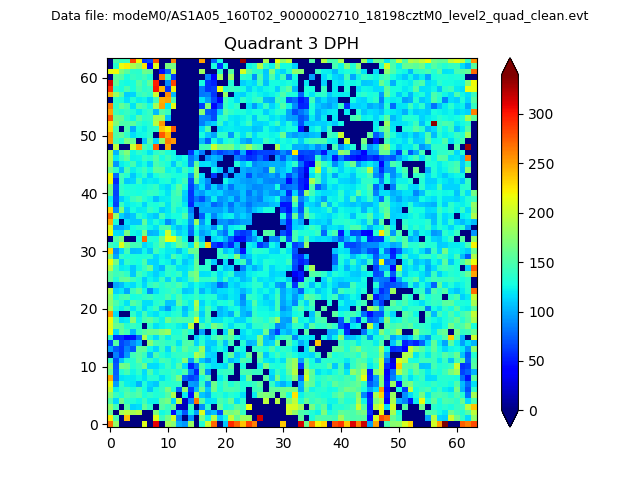 |
 |
Quadrant C |
| Plot type | Count rate plots | Images |
|---|---|---|
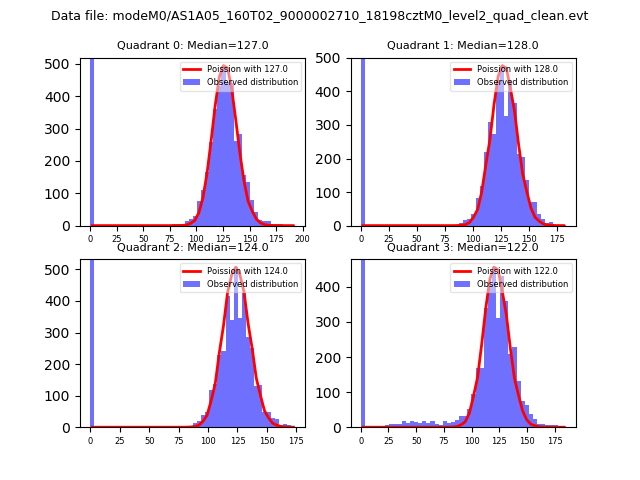
| Comparison with Poisson distribution Blue bars denote a histogram of data divided into 1 sec bins. Red curve is a Poisson curve with rate = median count rate of data. |
 |
 |
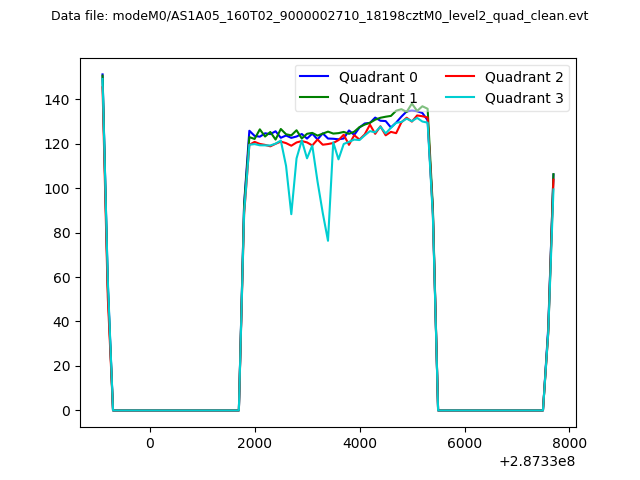
| Quadrant-wise count rates Data is divided into 100 sec bins |
 |
|
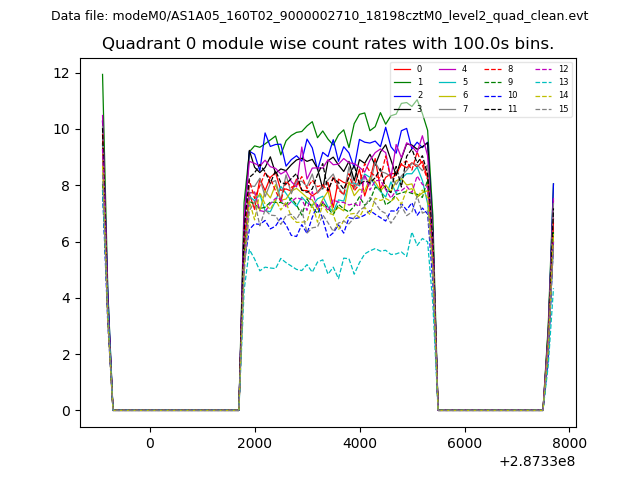
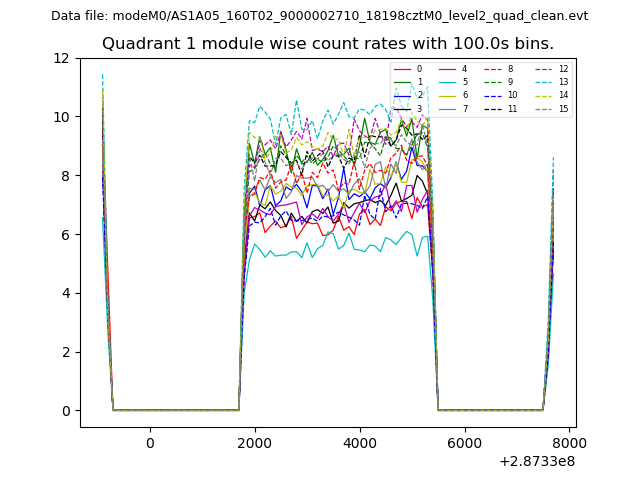
| Module-wise count rates for Quadrant A Data is divided into 100 sec bins |
 |
 |
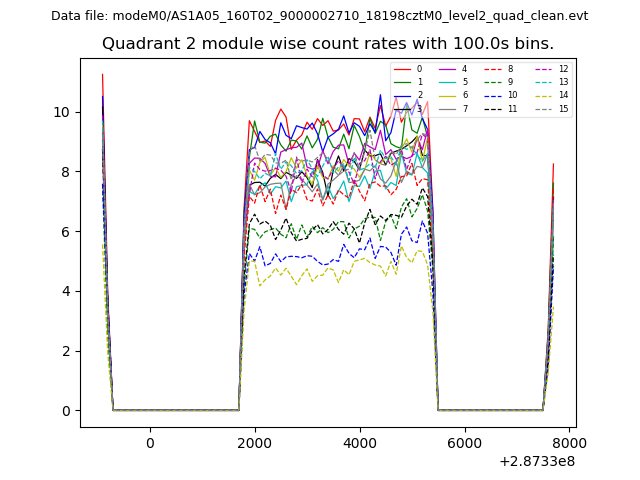
| Module-wise count rates for Quadrant B Data is divided into 100 sec bins |
 |
 |
| Module-wise count rates for Quadrant C Data is divided into 100 sec bins |
 |
 |
| Module-wise count rates for Quadrant D Data is divided into 100 sec bins |
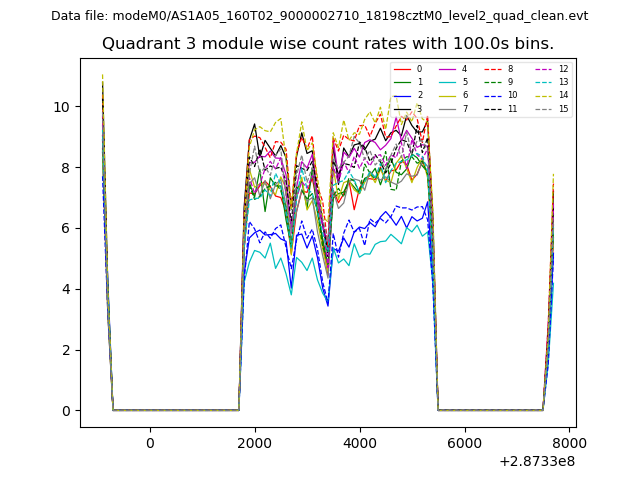 |
 |
| Parameter | Plot |
|---|---|
| CZT HV Monitor | 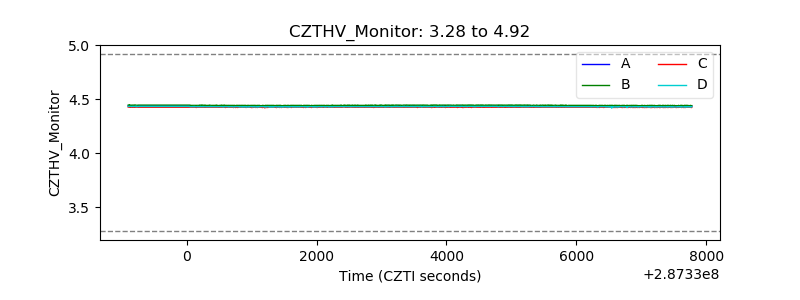 |
| D_VDD | 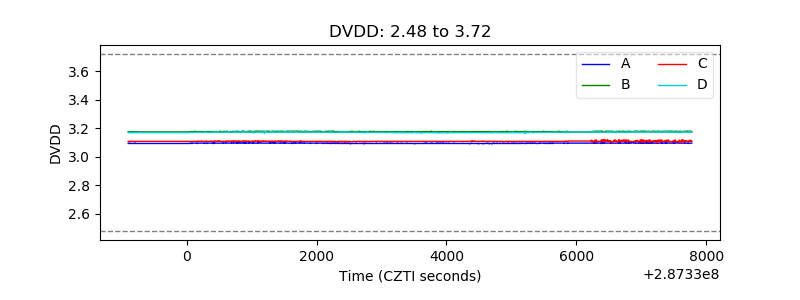 |
| Temperature 1 | 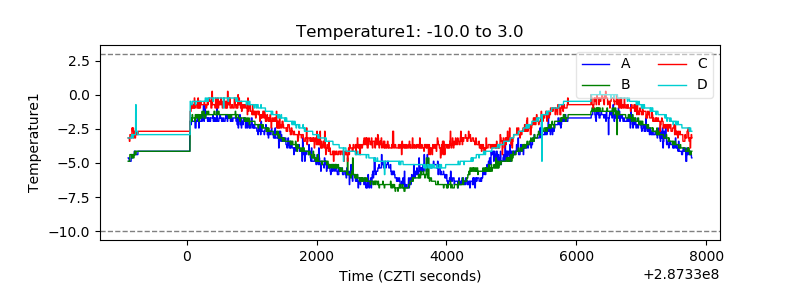 |
| Veto HV Monitor | 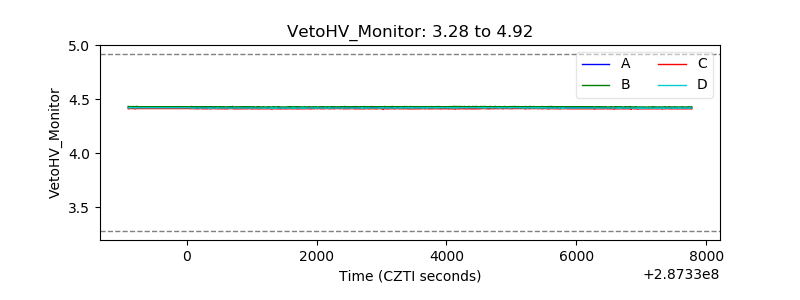 |
| Veto LLD | 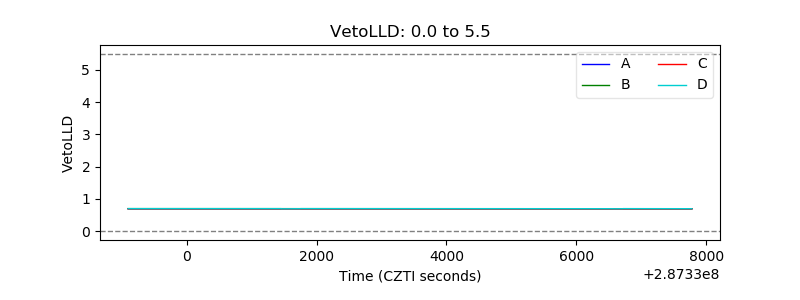 |
| Alpha Counter | 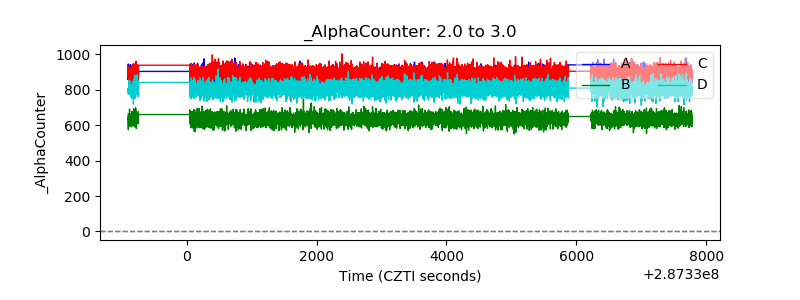 |
| _CPM_Rate | 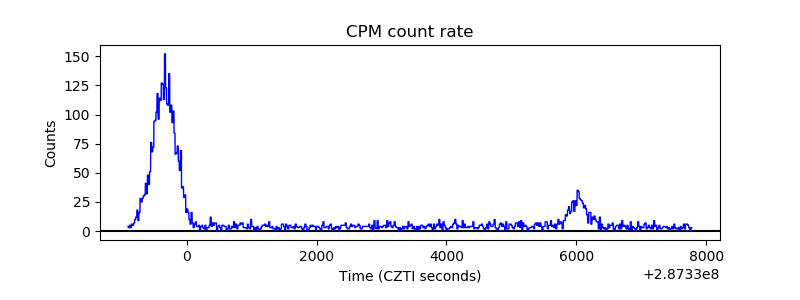 |
| CZT Counter | 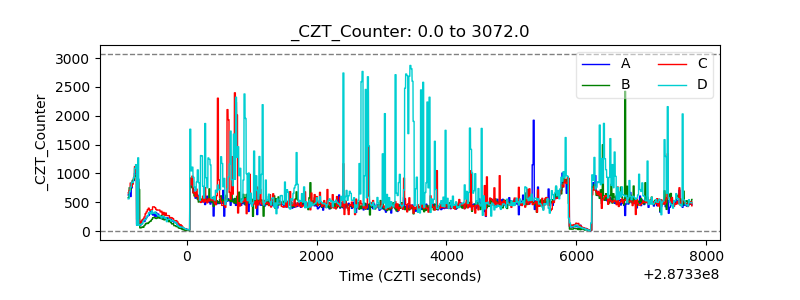 |
| +2.5 Volts monitor |  |
| +5 Volts monitor |  |
| _ROLL_ROT | 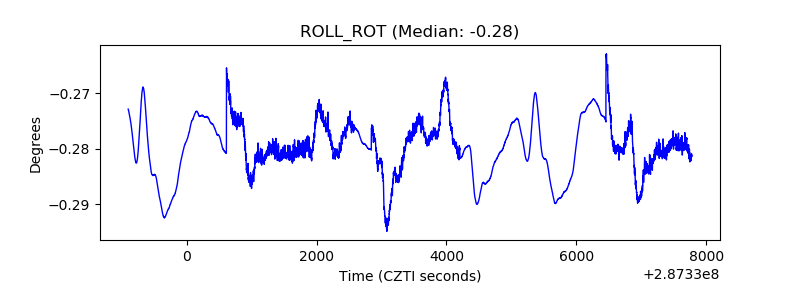 |
| _Roll_DEC | 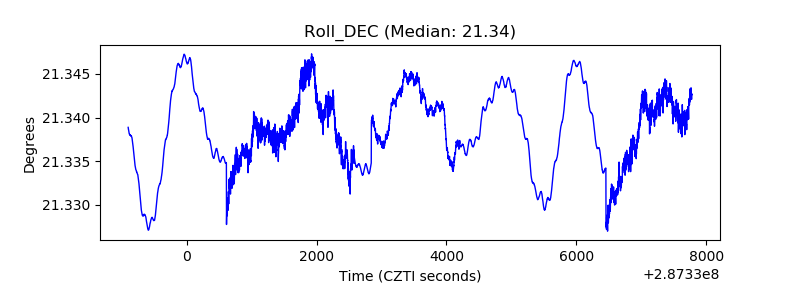 |
| _Roll_RA | 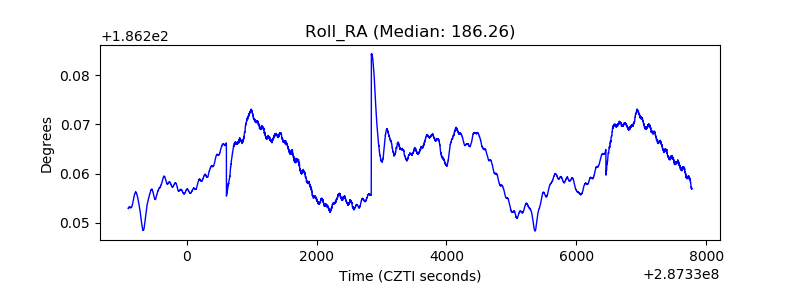 |
| Veto Counter | 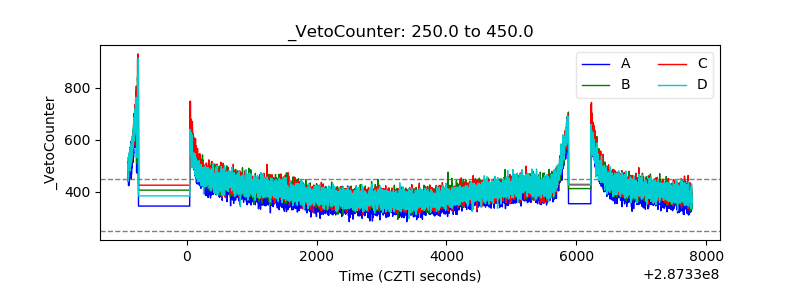 |