| Param | Original file | Final file |
|---|---|---|
| Filename | modeM0/AS1A05_160T02_9000002710_18199cztM0_level2.evt | modeM0/AS1A05_160T02_9000002710_18199cztM0_level2_quad_clean.evt |
| Size (bytes) | 625,429,440 | 89,533,440 |
| Size | 596.5 MB | 85.4 MB |
| Events in quadrant A | 4,064,155 | 542,278 |
| Events in quadrant B | 4,316,963 | 545,007 |
| Events in quadrant C | 4,168,216 | 528,453 |
| Events in quadrant D | 5,833,872 | 523,636 |
| Mode SS | |||
|---|---|---|---|
| Quadrant | BADHDUFLAG | Total packets | Discarded packets |
| A | 0 | 168 | 0 |
| B | 0 | 168 | 0 |
| C | 0 | 168 | 0 |
| D | 0 | 168 | 0 |
| Mode M9 | |||
|---|---|---|---|
| Quadrant | BADHDUFLAG | Total packets | Discarded packets |
| A | 0 | 6 | 0 |
| B | 0 | 6 | 0 |
| C | 0 | 6 | 0 |
| D | 0 | 6 | 0 |
| Mode M0 | |||
|---|---|---|---|
| Quadrant | BADHDUFLAG | Total packets | Discarded packets |
| A | 0 | 17412 | 2 |
| B | 0 | 18205 | 2 |
| C | 0 | 17586 | 2 |
| D | 0 | 22964 | 2 |
| Quadrant | Total seconds | Saturated seconds | Saturation percentage |
|---|---|---|---|
| A | 8232 | 138 | 1.676385% |
| B | 8233 | 240 | 2.915098% |
| C | 8233 | 264 | 3.206608% |
| D | 8232 | 403 | 4.895530% |
Noise dominated data is calculated using 1-second bins in cleaned event files. If a bin has >2000 counts, and if more than 50% of those come from <1% of pixels, then it is considered to be noise-dominated and hence unusable.
| Quadrant | # 1 sec bins | Bins with >0 counts | Bins with >2000 counts | High rate bins dominated by noise | Noise dominated (total time) | Noise dominated (detector-on time) | Marked lightcurve |
|---|---|---|---|---|---|---|---|
| A | 8782 | 8234 | 10 | 10 | 0.11% | 0.12% | 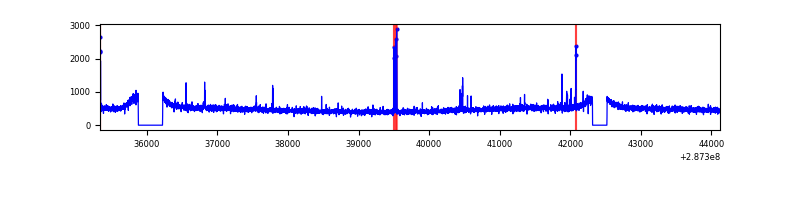 |
| B | 8783 | 8235 | 23 | 23 | 0.26% | 0.28% | 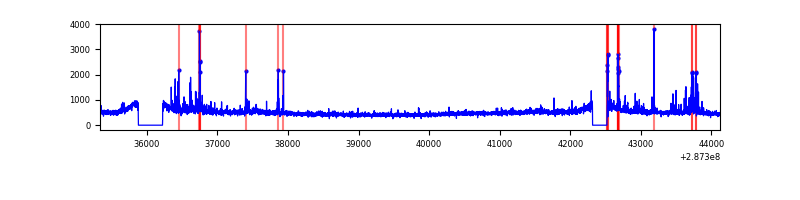 |
| C | 8783 | 8235 | 2 | 2 | 0.02% | 0.02% | 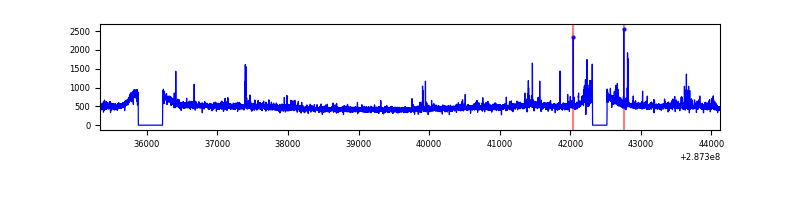 |
| D | 8782 | 8234 | 146 | 146 | 1.66% | 1.77% | 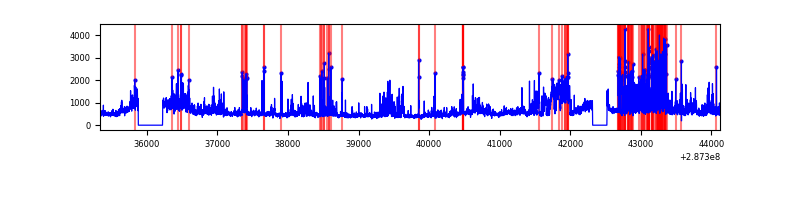 |
Top three noisy pixels from each quadrant. If the there are fewer than three noisy pixels in the level2.evt file, extra rows are filled as -1
| Pixel properties | Quadrant properties | ||||||
|---|---|---|---|---|---|---|---|
| Quadrant | DetID | PixID | Counts | Sigma | Mean | Median | Sigma |
| A | 15 | 174 | 78808 | 369.35 | 1033 | 1008 | 210.6 |
| A | 4 | 2 | 11291 | 48.82 | 1033 | 1008 | 210.6 |
| A | 0 | 226 | 9201 | 38.9 | 1033 | 1008 | 210.6 |
| B | 7 | 220 | 134962 | 684.15 | 1023 | 998 | 195.8 |
| B | 0 | 197 | 57201 | 287.03 | 1023 | 998 | 195.8 |
| B | 12 | 111 | 22818 | 111.43 | 1023 | 998 | 195.8 |
| C | 14 | 238 | 151532 | 652.12 | 982 | 986 | 230.9 |
| C | 4 | 254 | 143607 | 617.79 | 982 | 986 | 230.9 |
| C | 3 | 233 | 23725 | 98.5 | 982 | 986 | 230.9 |
| D | 5 | 222 | 1455797 | 5986.3 | 995 | 963 | 243.0 |
| D | 7 | 238 | 441987 | 1814.71 | 995 | 963 | 243.0 |
| D | 10 | 70 | 43846 | 176.45 | 995 | 963 | 243.0 |
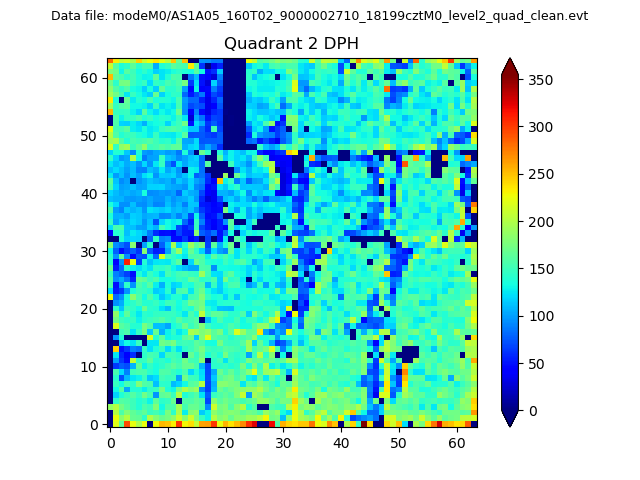
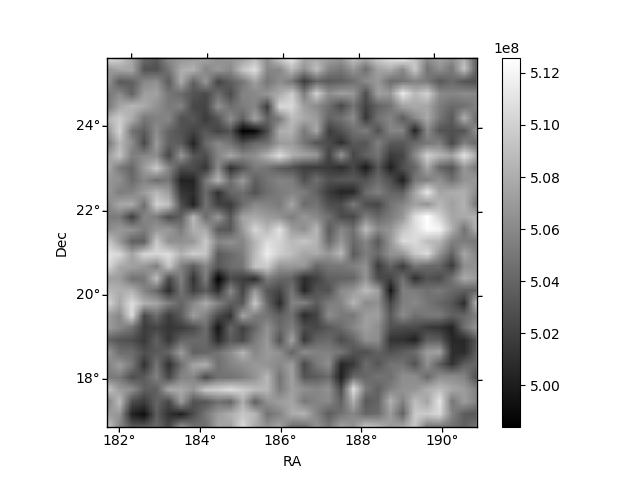
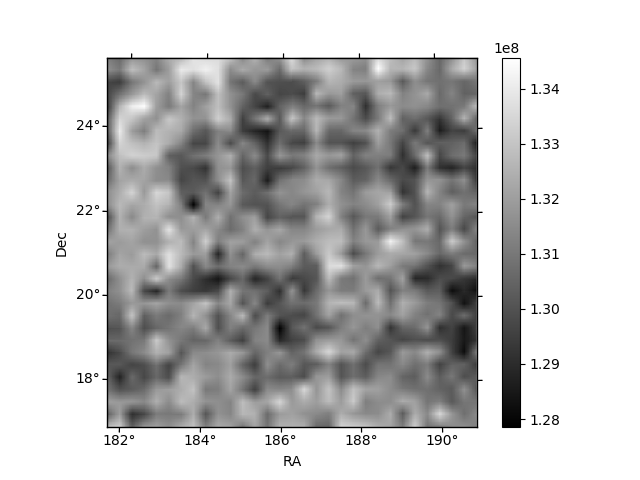
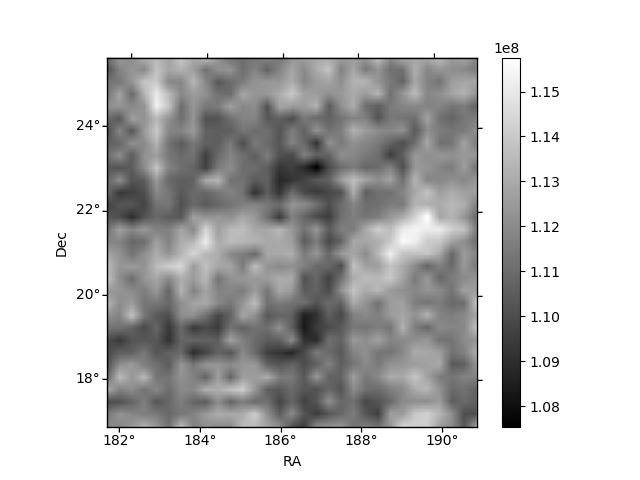
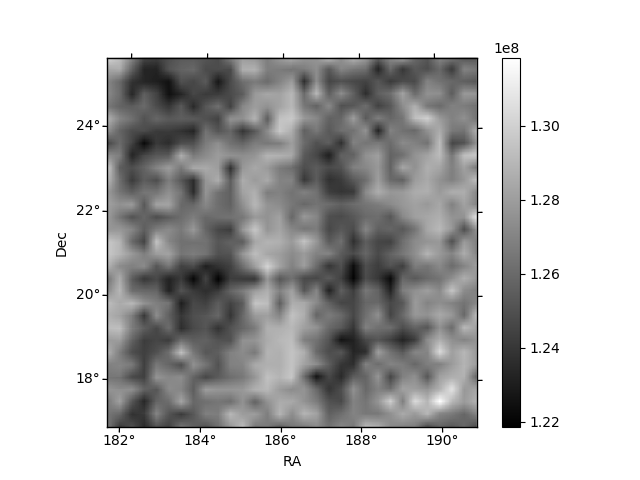
Histogram calculated using DETX and DETY for each event in the final _common_clean file
| Quadrant A | 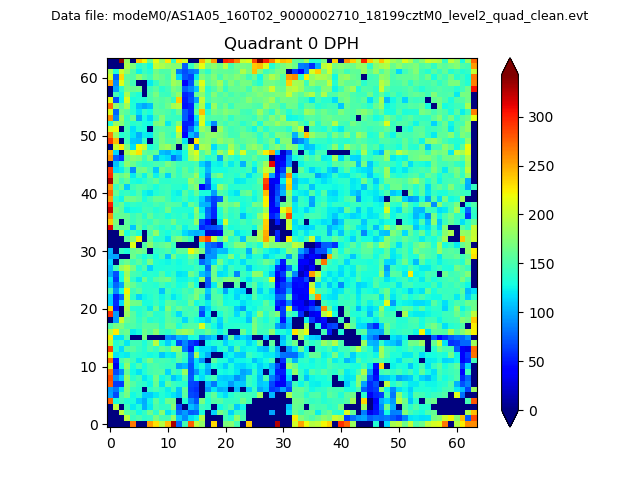 |
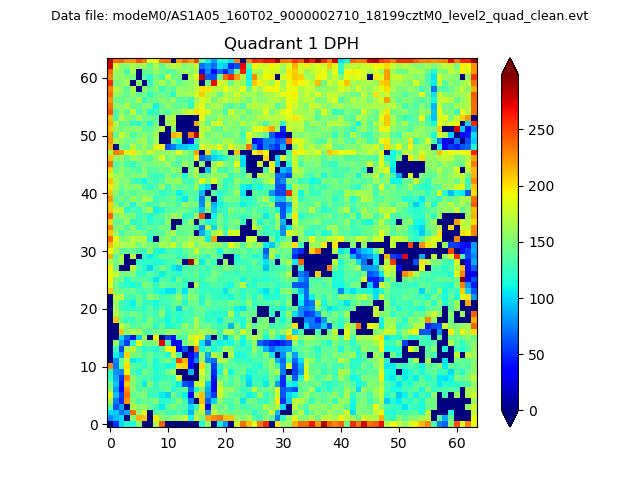 |
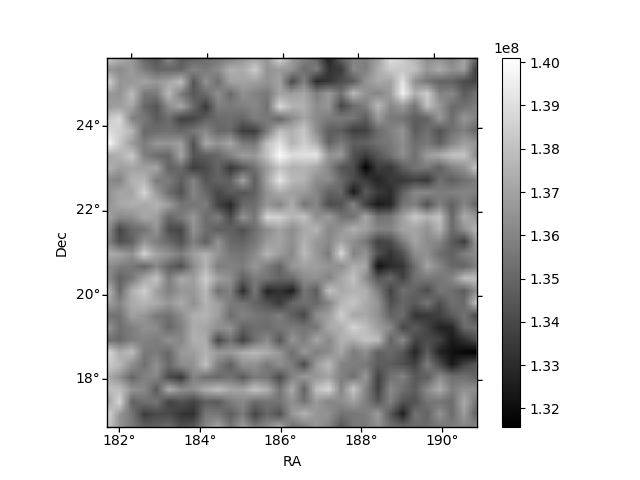
Quadrant B |
|---|---|---|---|
| Quadrant D | 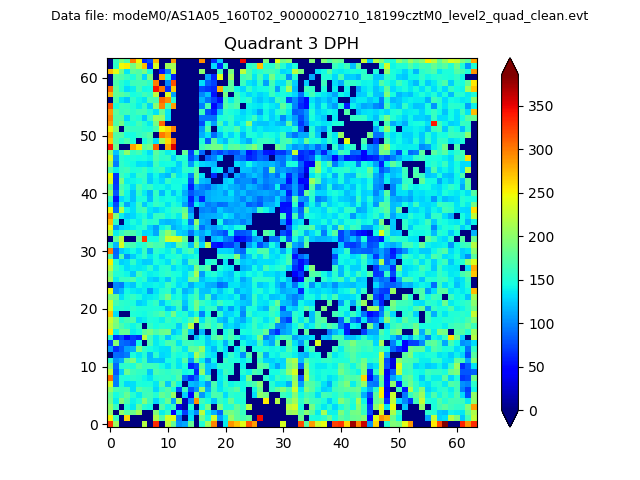 |
 |
Quadrant C |
| Plot type | Count rate plots | Images |
|---|---|---|
| Comparison with Poisson distribution Blue bars denote a histogram of data divided into 1 sec bins. Red curve is a Poisson curve with rate = median count rate of data. |
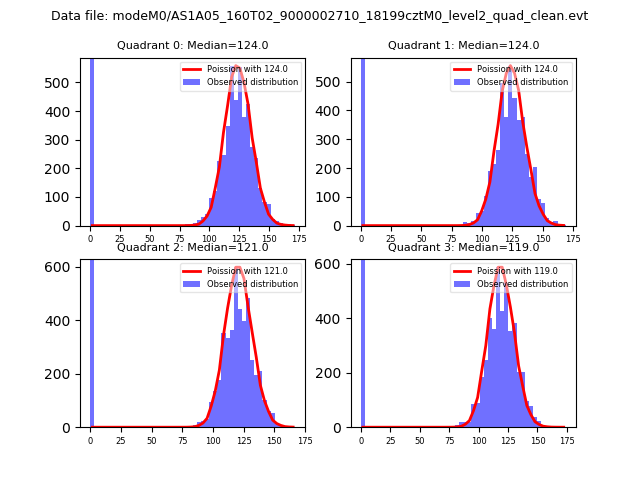 |
 |
| Quadrant-wise count rates Data is divided into 100 sec bins |
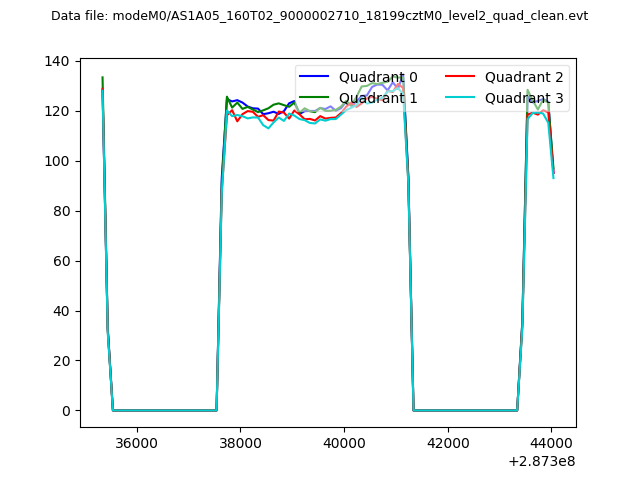 |
|
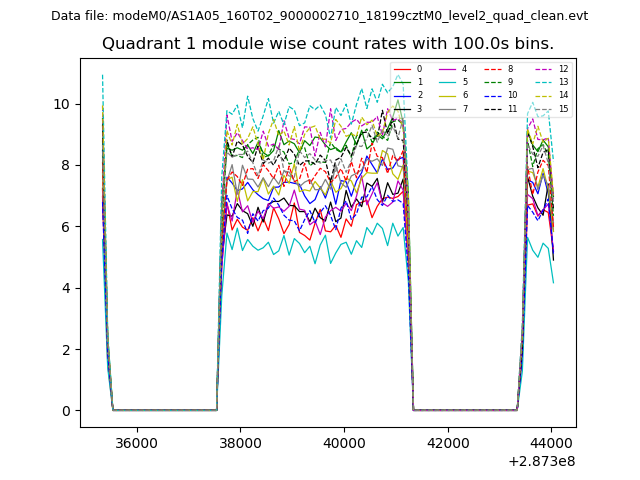
| Module-wise count rates for Quadrant A Data is divided into 100 sec bins |
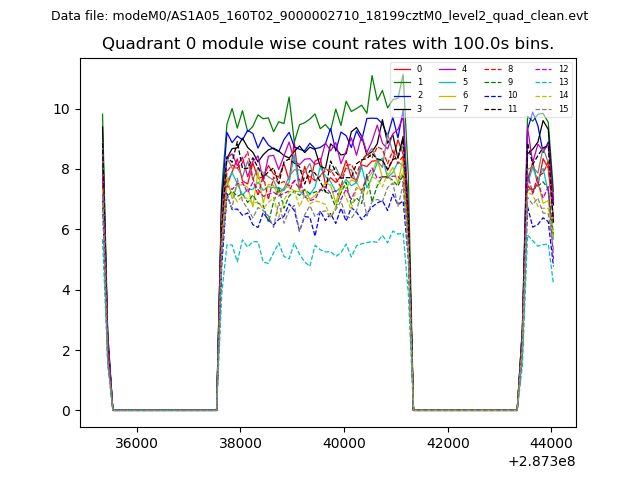 |
 |
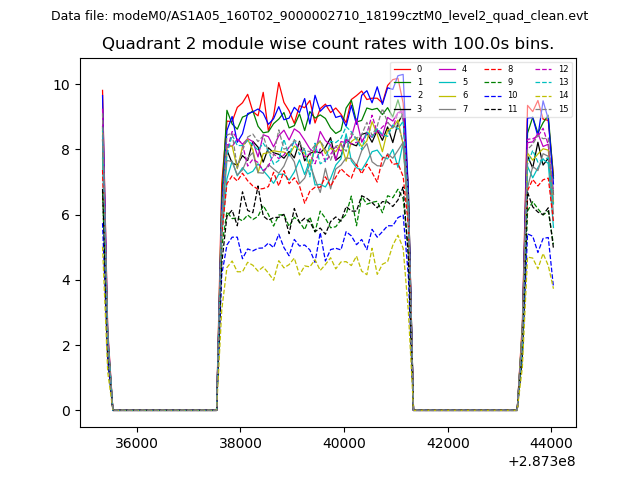
| Module-wise count rates for Quadrant B Data is divided into 100 sec bins |
 |
 |
| Module-wise count rates for Quadrant C Data is divided into 100 sec bins |
 |
 |
| Module-wise count rates for Quadrant D Data is divided into 100 sec bins |
 |
 |
| Parameter | Plot |
|---|---|
| CZT HV Monitor | 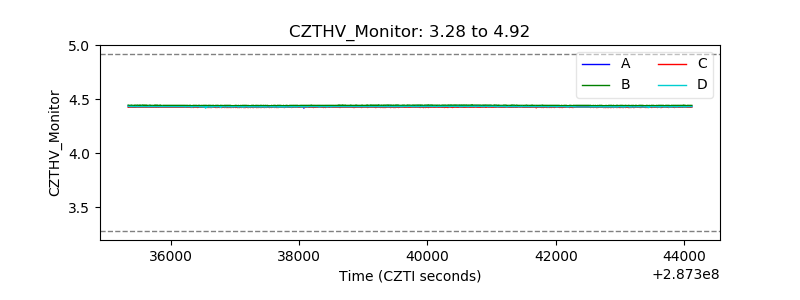 |
| D_VDD | 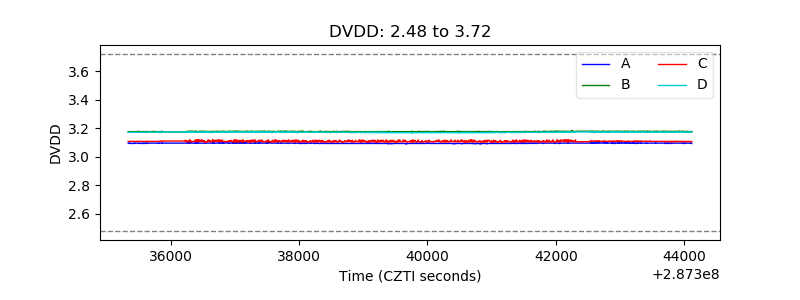 |
| Temperature 1 | 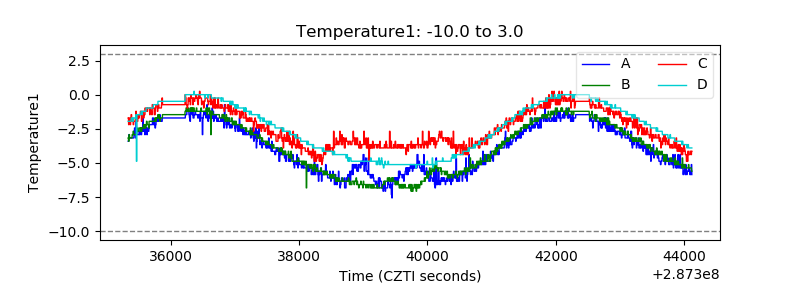 |
| Veto HV Monitor | 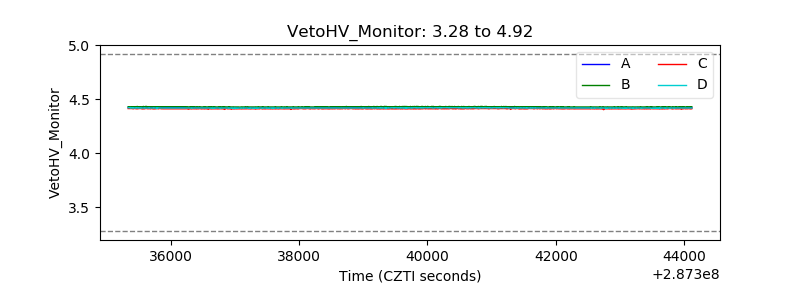 |
| Veto LLD |  |
| Alpha Counter | 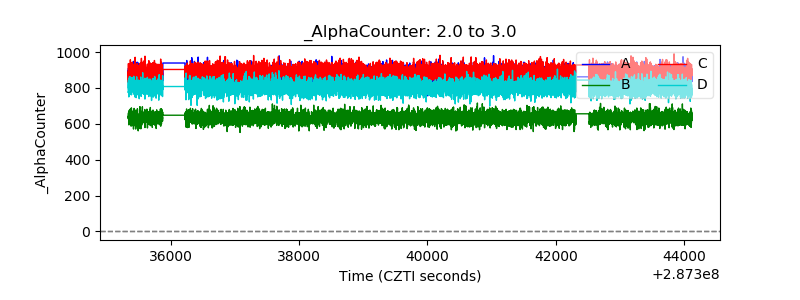 |
| _CPM_Rate | 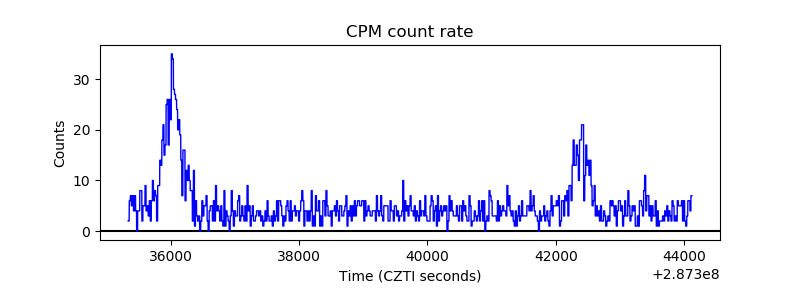 |
| CZT Counter | 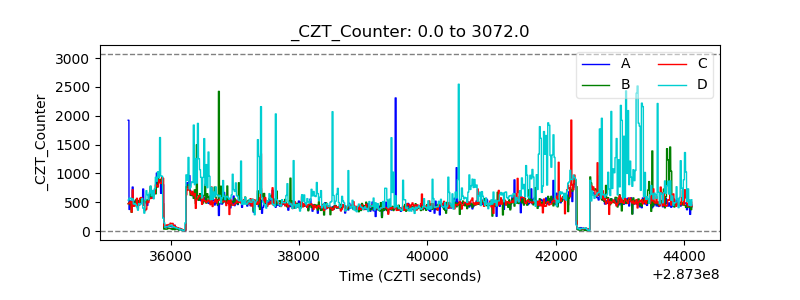 |
| +2.5 Volts monitor |  |
| +5 Volts monitor |  |
| _ROLL_ROT | 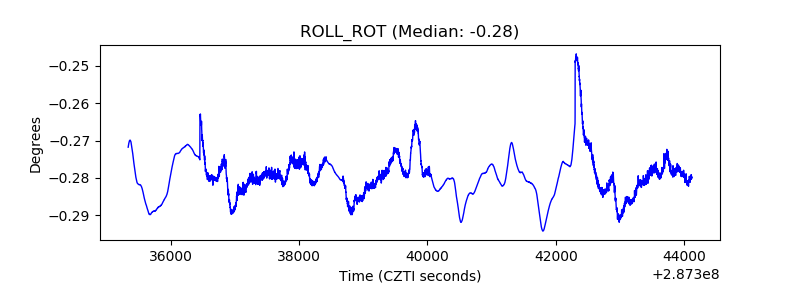 |
| _Roll_DEC | 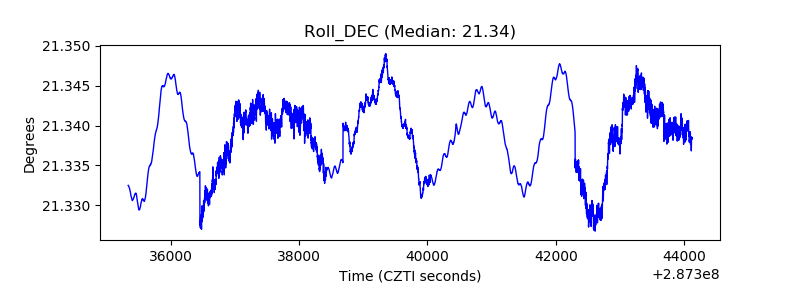 |
| _Roll_RA | 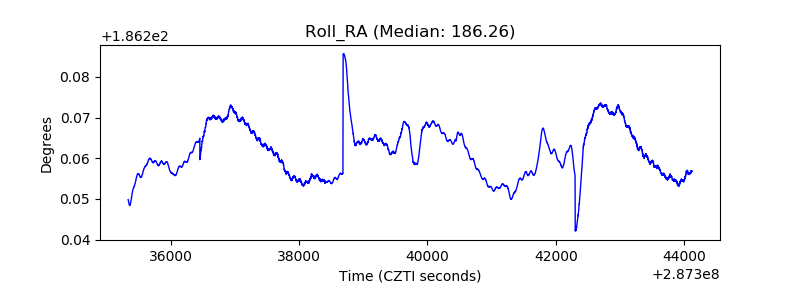 |
| Veto Counter |  |