| Param | Original file | Final file |
|---|---|---|
| Filename | modeM0/AS1A05_160T02_9000002710_18200cztM0_level2.evt | modeM0/AS1A05_160T02_9000002710_18200cztM0_level2_quad_clean.evt |
| Size (bytes) | 571,622,400 | 77,215,680 |
| Size | 545.1 MB | 73.6 MB |
| Events in quadrant A | 3,629,569 | 465,984 |
| Events in quadrant B | 3,715,722 | 469,926 |
| Events in quadrant C | 4,153,609 | 450,852 |
| Events in quadrant D | 5,323,260 | 448,597 |
| Mode SS | |||
|---|---|---|---|
| Quadrant | BADHDUFLAG | Total packets | Discarded packets |
| A | 0 | 150 | 0 |
| B | 0 | 150 | 0 |
| C | 0 | 150 | 0 |
| D | 0 | 150 | 0 |
| Mode M9 | |||
|---|---|---|---|
| Quadrant | BADHDUFLAG | Total packets | Discarded packets |
| A | 0 | 5 | 0 |
| B | 0 | 5 | 0 |
| C | 0 | 5 | 0 |
| D | 0 | 5 | 0 |
| Mode M0 | |||
|---|---|---|---|
| Quadrant | BADHDUFLAG | Total packets | Discarded packets |
| A | 0 | 15530 | 2 |
| B | 0 | 15864 | 2 |
| C | 0 | 17072 | 2 |
| D | 0 | 20877 | 2 |
| Quadrant | Total seconds | Saturated seconds | Saturation percentage |
|---|---|---|---|
| A | 7212 | 84 | 1.164725% |
| B | 7213 | 170 | 2.356856% |
| C | 7213 | 420 | 5.822820% |
| D | 7213 | 324 | 4.491890% |
Noise dominated data is calculated using 1-second bins in cleaned event files. If a bin has >2000 counts, and if more than 50% of those come from <1% of pixels, then it is considered to be noise-dominated and hence unusable.
| Quadrant | # 1 sec bins | Bins with >0 counts | Bins with >2000 counts | High rate bins dominated by noise | Noise dominated (total time) | Noise dominated (detector-on time) | Marked lightcurve |
|---|---|---|---|---|---|---|---|
| A | 7772 | 7214 | 7 | 7 | 0.09% | 0.10% | 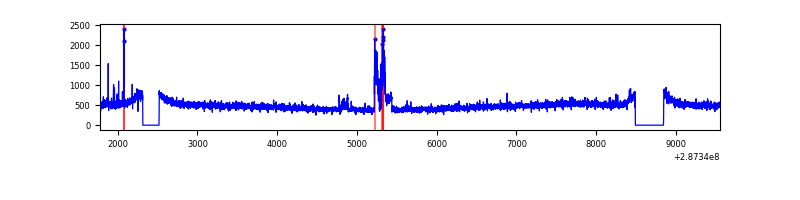 |
| B | 7773 | 7215 | 19 | 19 | 0.24% | 0.26% | 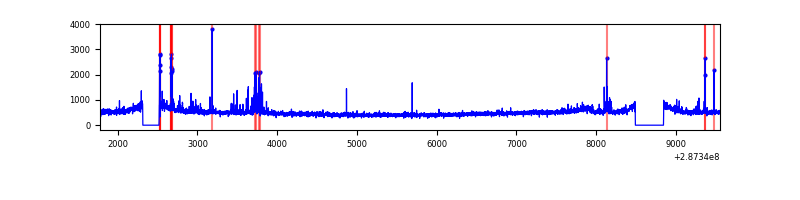 |
| C | 7773 | 7215 | 105 | 105 | 1.35% | 1.46% | 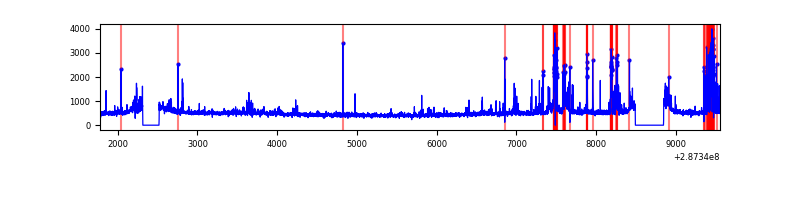 |
| D | 7773 | 7215 | 127 | 127 | 1.63% | 1.76% | 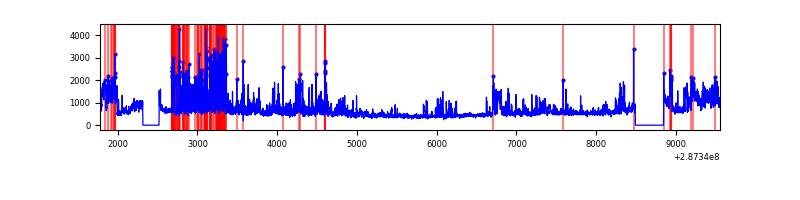 |
Top three noisy pixels from each quadrant. If the there are fewer than three noisy pixels in the level2.evt file, extra rows are filled as -1
| Pixel properties | Quadrant properties | ||||||
|---|---|---|---|---|---|---|---|
| Quadrant | DetID | PixID | Counts | Sigma | Mean | Median | Sigma |
| A | 15 | 174 | 179973 | 981.1 | 896 | 875 | 182.5 |
| A | 0 | 226 | 8019 | 39.13 | 896 | 875 | 182.5 |
| A | 3 | 137 | 6881 | 32.9 | 896 | 875 | 182.5 |
| B | 7 | 220 | 98337 | 568.99 | 889 | 864 | 171.3 |
| B | 0 | 197 | 48869 | 280.23 | 889 | 864 | 171.3 |
| B | 0 | 189 | 39256 | 224.11 | 889 | 864 | 171.3 |
| C | 4 | 254 | 694401 | 3494.59 | 843 | 846 | 198.5 |
| C | 14 | 238 | 130581 | 653.69 | 843 | 846 | 198.5 |
| C | 3 | 233 | 39550 | 195.02 | 843 | 846 | 198.5 |
| D | 5 | 222 | 988879 | 4634.56 | 860 | 832 | 213.2 |
| D | 7 | 238 | 919884 | 4310.93 | 860 | 832 | 213.2 |
| D | 1 | 52 | 63147 | 292.3 | 860 | 832 | 213.2 |
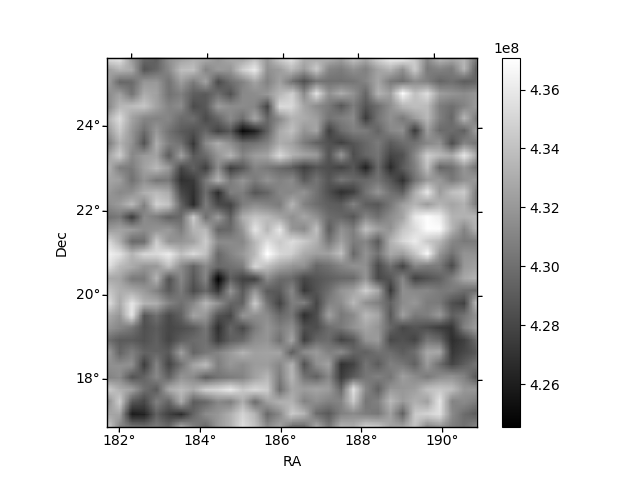
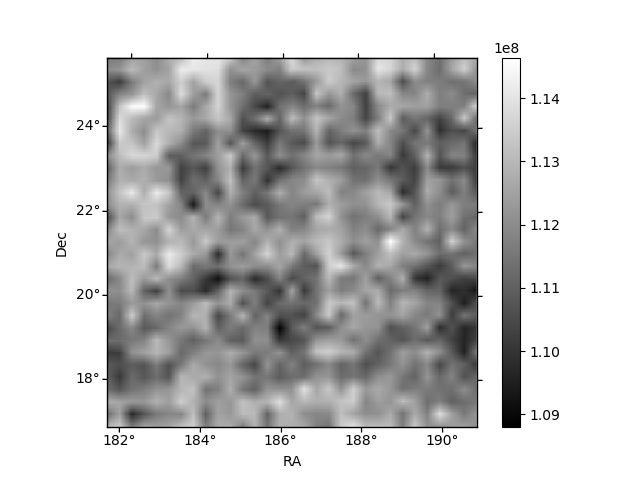
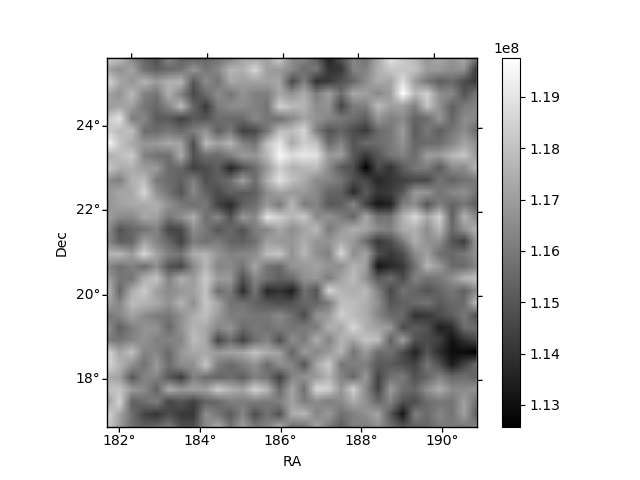
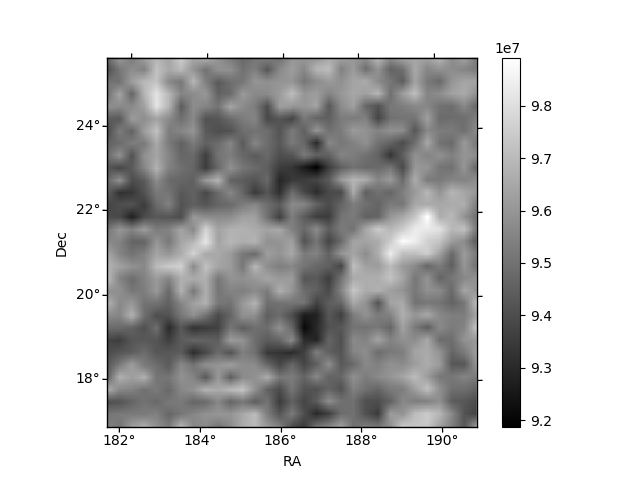
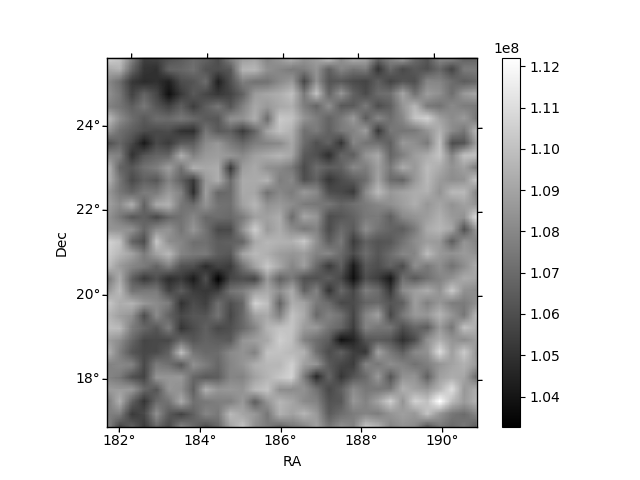
Histogram calculated using DETX and DETY for each event in the final _common_clean file
| Quadrant A | 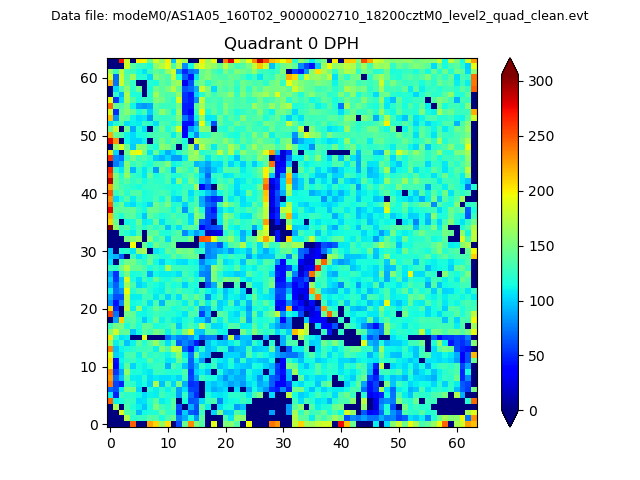 |
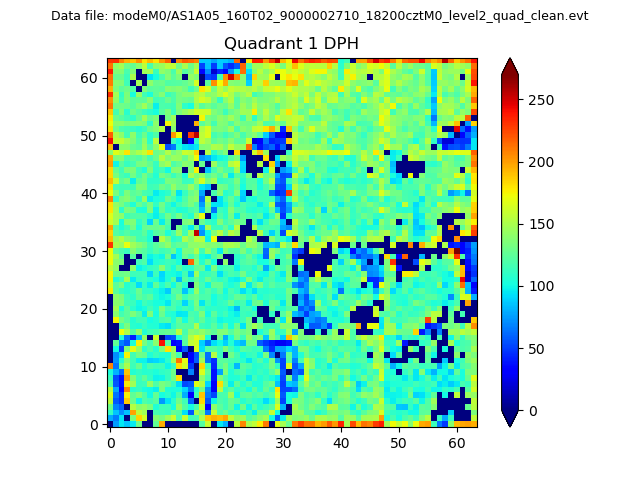 |
Quadrant B |
|---|---|---|---|
| Quadrant D |  |
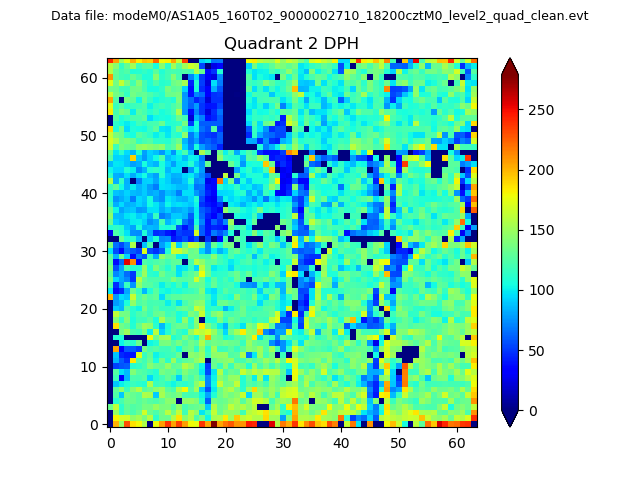 |
Quadrant C |
| Plot type | Count rate plots | Images |
|---|---|---|
| Comparison with Poisson distribution Blue bars denote a histogram of data divided into 1 sec bins. Red curve is a Poisson curve with rate = median count rate of data. |
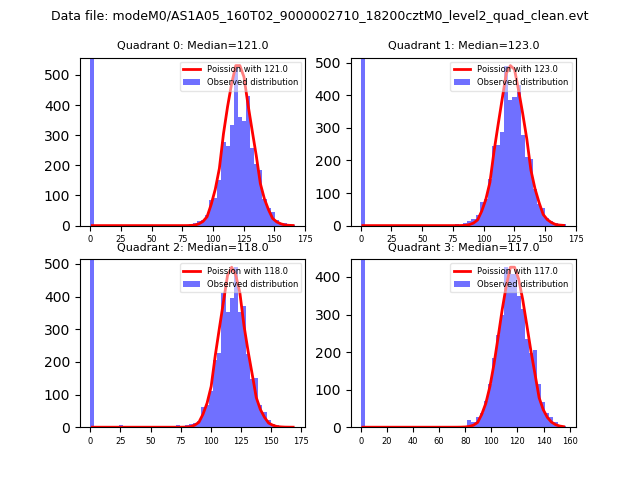 |
 |
| Quadrant-wise count rates Data is divided into 100 sec bins |
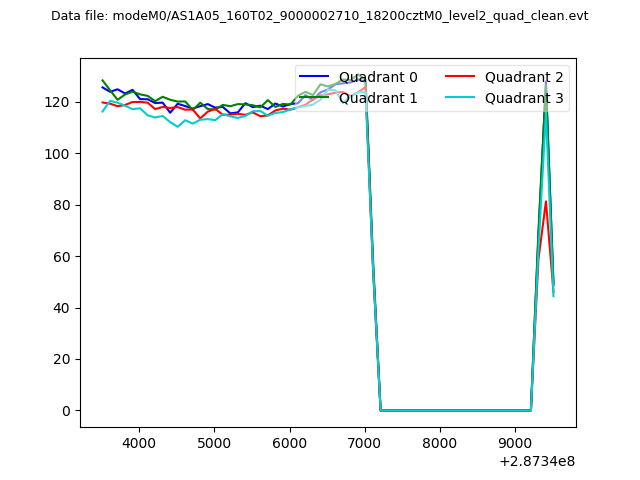 |
|
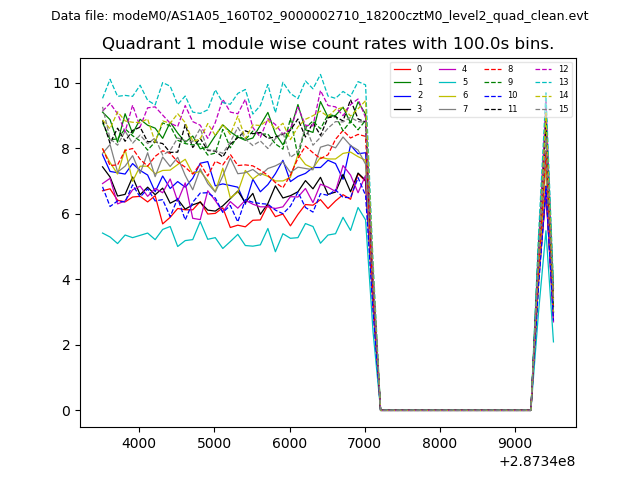
| Module-wise count rates for Quadrant A Data is divided into 100 sec bins |
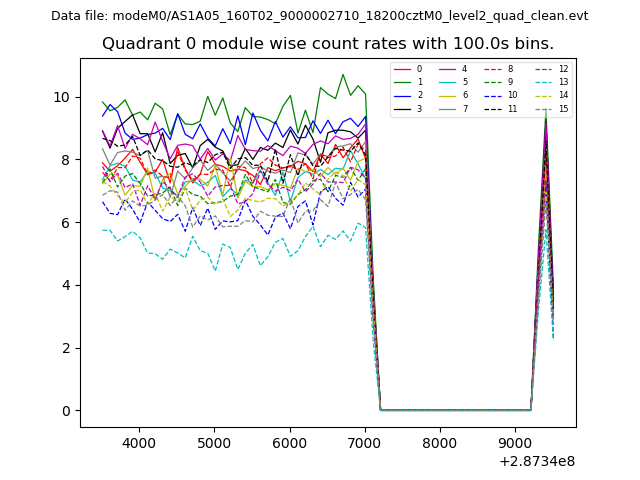 |
 |
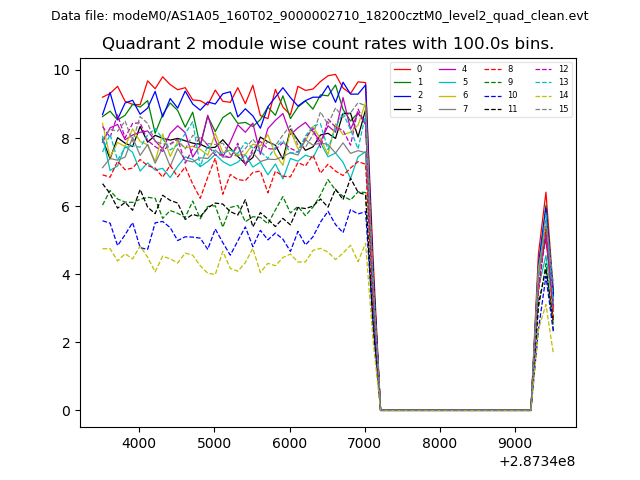
| Module-wise count rates for Quadrant B Data is divided into 100 sec bins |
 |
 |
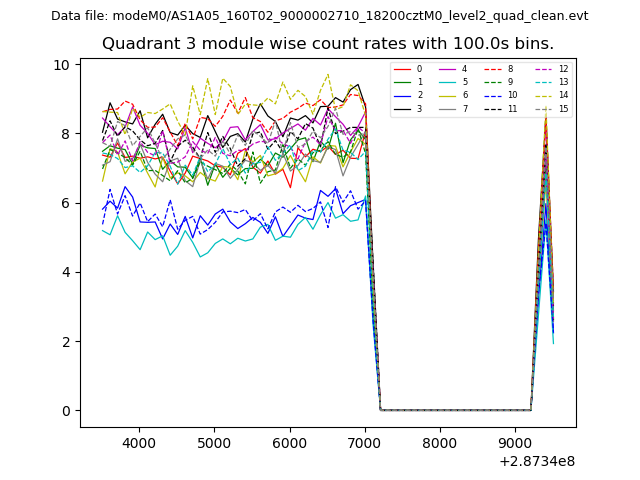
| Module-wise count rates for Quadrant C Data is divided into 100 sec bins |
 |
 |
| Module-wise count rates for Quadrant D Data is divided into 100 sec bins |
 |
 |
| Parameter | Plot |
|---|---|
| CZT HV Monitor | 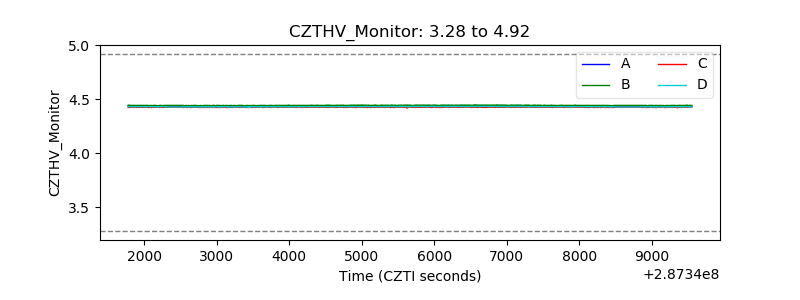 |
| D_VDD | 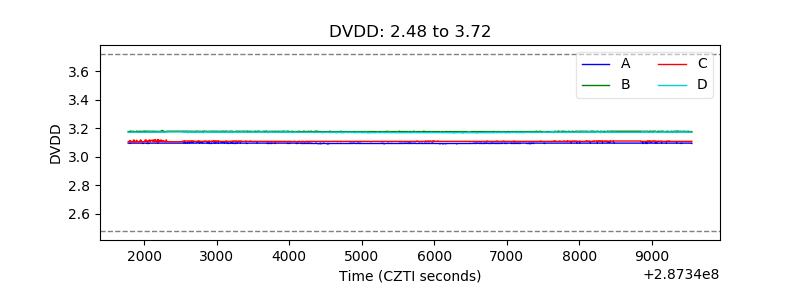 |
| Temperature 1 | 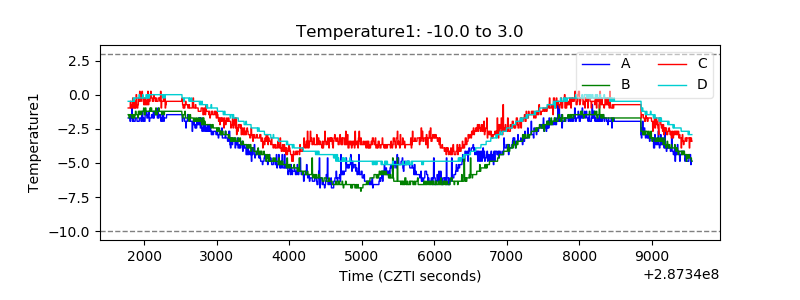 |
| Veto HV Monitor |  |
| Veto LLD | 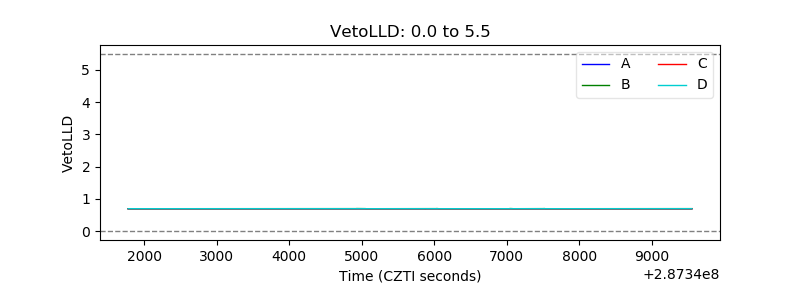 |
| Alpha Counter | 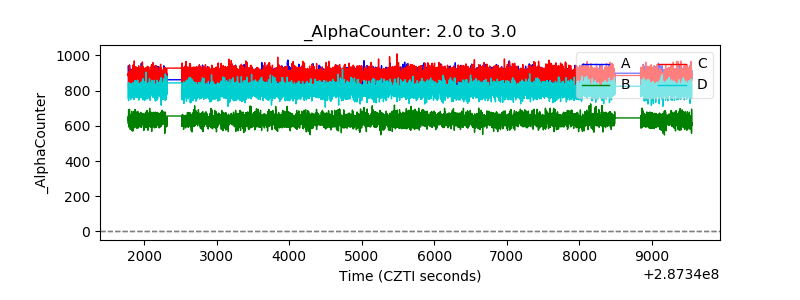 |
| _CPM_Rate | 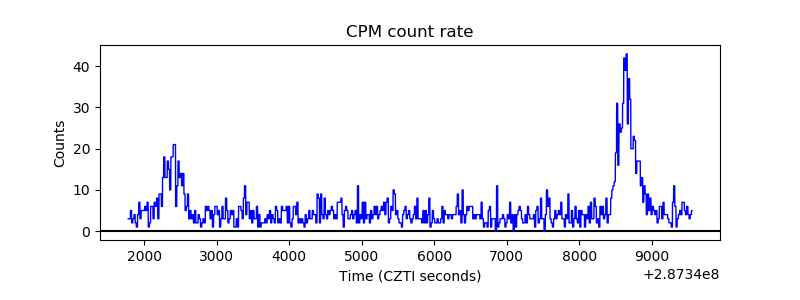 |
| CZT Counter |  |
| +2.5 Volts monitor |  |
| +5 Volts monitor | 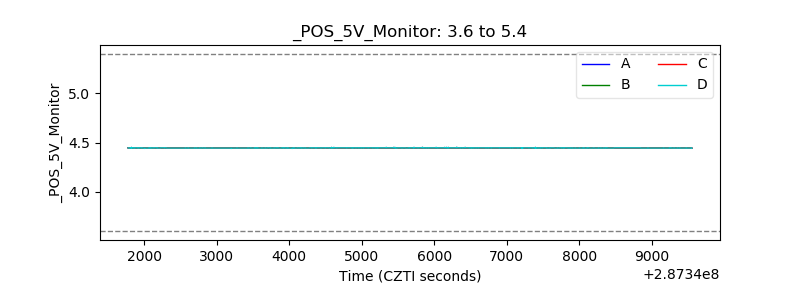 |
| _ROLL_ROT | 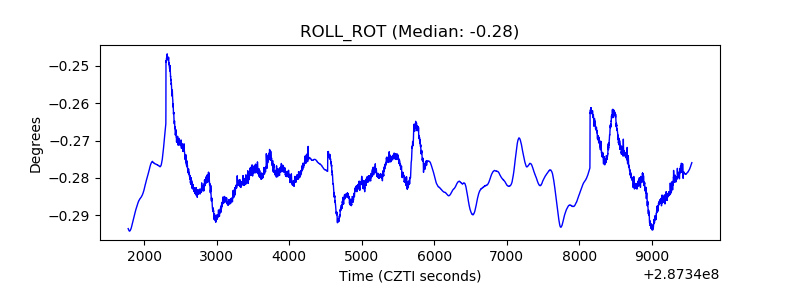 |
| _Roll_DEC | 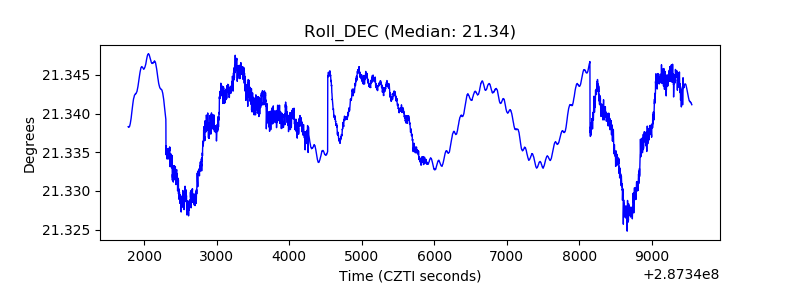 |
| _Roll_RA | 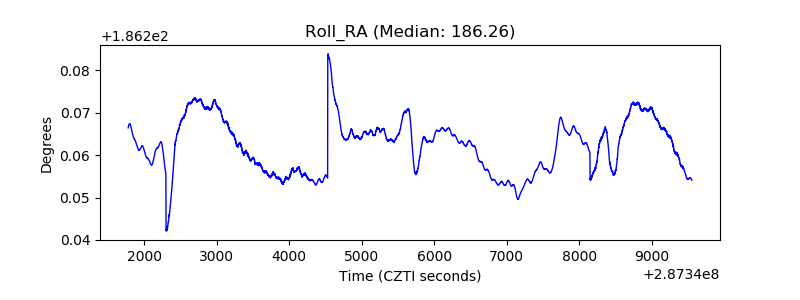 |
| Veto Counter | 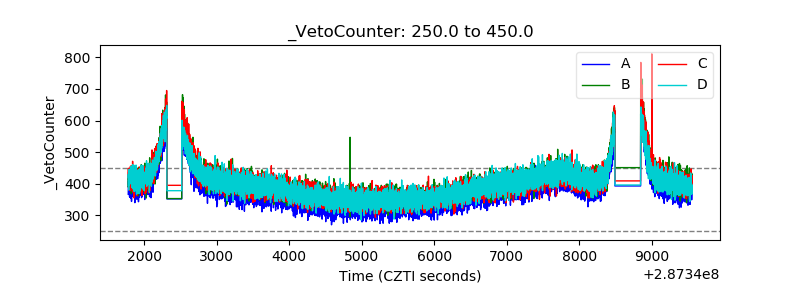 |