| Param | Original file | Final file |
|---|---|---|
| Filename | modeM0/AS1A05_160T02_9000002710_18202cztM0_level2.evt | modeM0/AS1A05_160T02_9000002710_18202cztM0_level2_quad_clean.evt |
| Size (bytes) | 102,193,920 | 5,607,360 |
| Size | 97.5 MB | 5.3 MB |
| Events in quadrant A | 564,332 | 24,465 |
| Events in quadrant B | 598,046 | 24,415 |
| Events in quadrant C | 858,919 | 18,634 |
| Events in quadrant D | 1,000,779 | 22,432 |
| Mode SS | |||
|---|---|---|---|
| Quadrant | BADHDUFLAG | Total packets | Discarded packets |
| A | 0 | 24 | 0 |
| B | 0 | 24 | 0 |
| C | 0 | 24 | 0 |
| D | 0 | 24 | 0 |
| Mode M9 | |||
|---|---|---|---|
| Quadrant | BADHDUFLAG | Total packets | Discarded packets |
| A | 0 | 3 | 0 |
| B | 0 | 3 | 0 |
| C | 0 | 3 | 0 |
| D | 0 | 3 | 0 |
| Mode M0 | |||
|---|---|---|---|
| Quadrant | BADHDUFLAG | Total packets | Discarded packets |
| A | 0 | 2300 | 3 |
| B | 0 | 2399 | 5 |
| C | 0 | 3213 | 12 |
| D | 0 | 3739 | 1 |
| Quadrant | Total seconds | Saturated seconds | Saturation percentage |
|---|---|---|---|
| A | 1024 | 24 | 2.343750% |
| B | 1024 | 55 | 5.371094% |
| C | 1024 | 194 | 18.945312% |
| D | 1026 | 62 | 6.042885% |
Noise dominated data is calculated using 1-second bins in cleaned event files. If a bin has >2000 counts, and if more than 50% of those come from <1% of pixels, then it is considered to be noise-dominated and hence unusable.
| Quadrant | # 1 sec bins | Bins with >0 counts | Bins with >2000 counts | High rate bins dominated by noise | Noise dominated (total time) | Noise dominated (detector-on time) | Marked lightcurve |
|---|---|---|---|---|---|---|---|
| A | 1380 | 1026 | 0 | 0 | 0.00% | 0.00% | 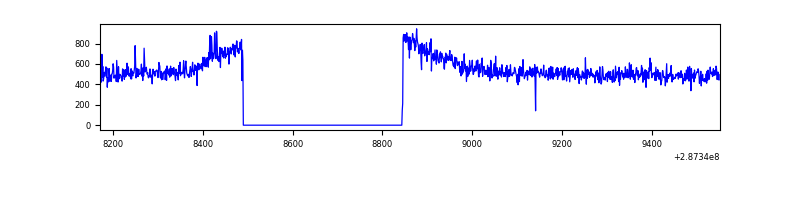 |
| B | 1381 | 1027 | 3 | 3 | 0.22% | 0.29% | 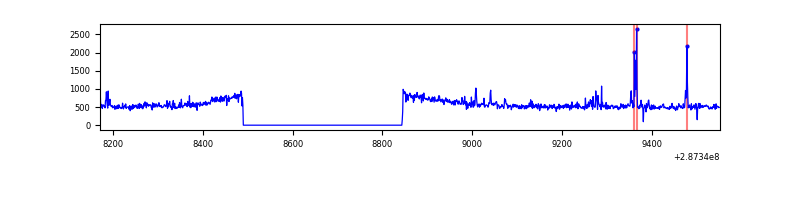 |
| C | 1381 | 1027 | 57 | 57 | 4.13% | 5.55% | 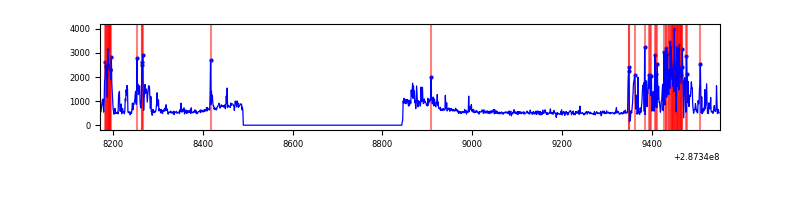 |
| D | 1381 | 1027 | 9 | 9 | 0.65% | 0.88% | 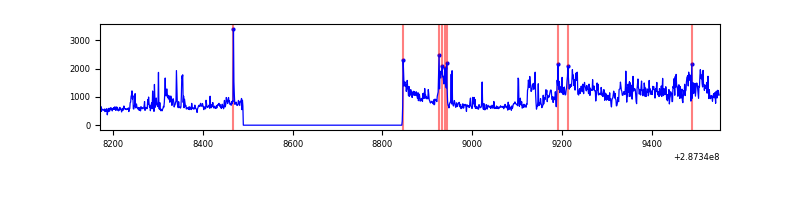 |
Top three noisy pixels from each quadrant. If the there are fewer than three noisy pixels in the level2.evt file, extra rows are filled as -1
| Pixel properties | Quadrant properties | ||||||
|---|---|---|---|---|---|---|---|
| Quadrant | DetID | PixID | Counts | Sigma | Mean | Median | Sigma |
| A | 15 | 174 | 5768 | 176.98 | 145 | 141 | 31.8 |
| A | 0 | 226 | 1310 | 36.77 | 145 | 141 | 31.8 |
| A | 12 | 194 | 1154 | 31.86 | 145 | 141 | 31.8 |
| B | 7 | 220 | 19083 | 621.35 | 144 | 140 | 30.5 |
| B | 5 | 172 | 4432 | 140.78 | 144 | 140 | 30.5 |
| B | 12 | 111 | 3265 | 102.5 | 144 | 140 | 30.5 |
| C | 4 | 254 | 313329 | 9528.86 | 130 | 130 | 32.9 |
| C | 14 | 238 | 19490 | 589.01 | 130 | 130 | 32.9 |
| C | 3 | 233 | 14122 | 425.7 | 130 | 130 | 32.9 |
| D | 5 | 222 | 262209 | 7168.66 | 138 | 133 | 36.6 |
| D | 7 | 238 | 174620 | 4772.81 | 138 | 133 | 36.6 |
| D | 1 | 52 | 12508 | 338.5 | 138 | 133 | 36.6 |
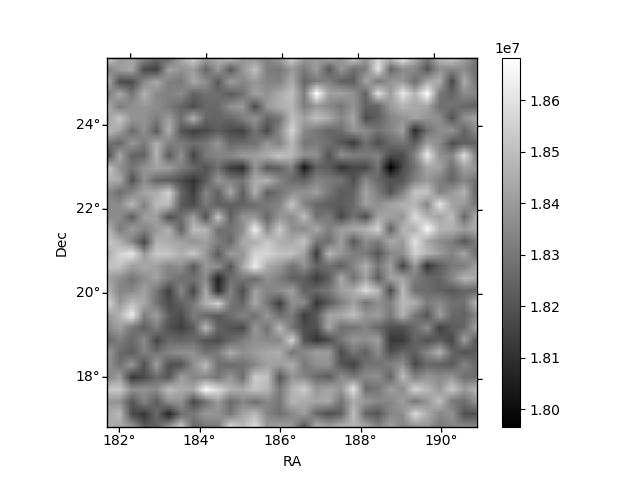
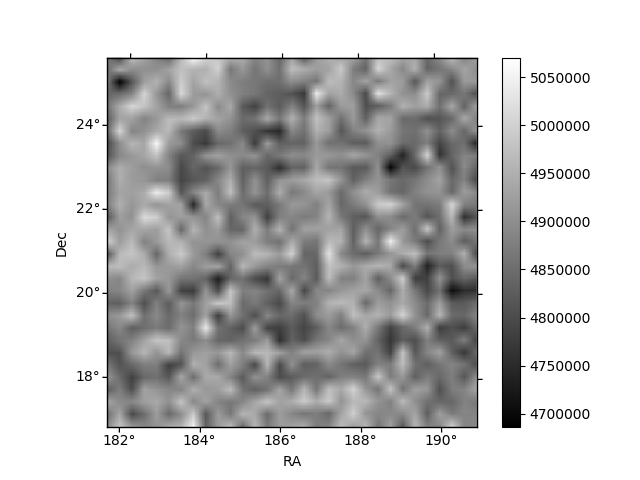
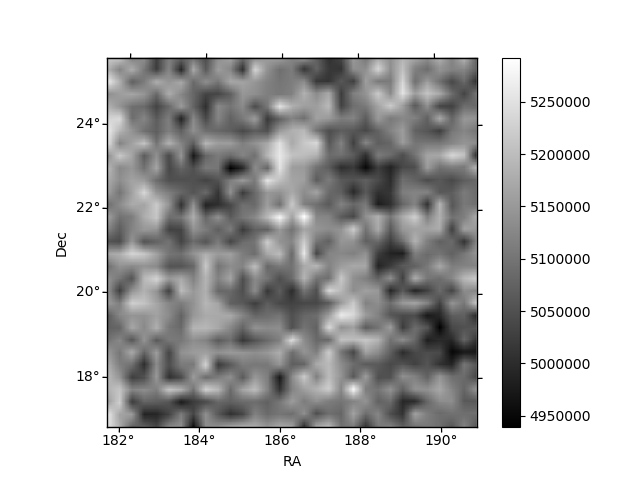
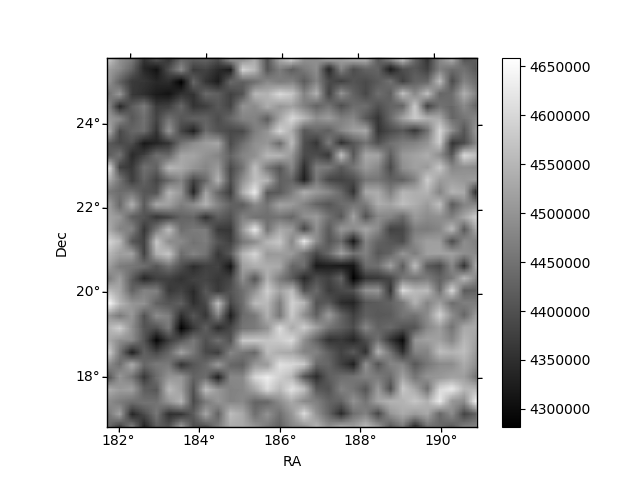
Histogram calculated using DETX and DETY for each event in the final _common_clean file
| Quadrant A | 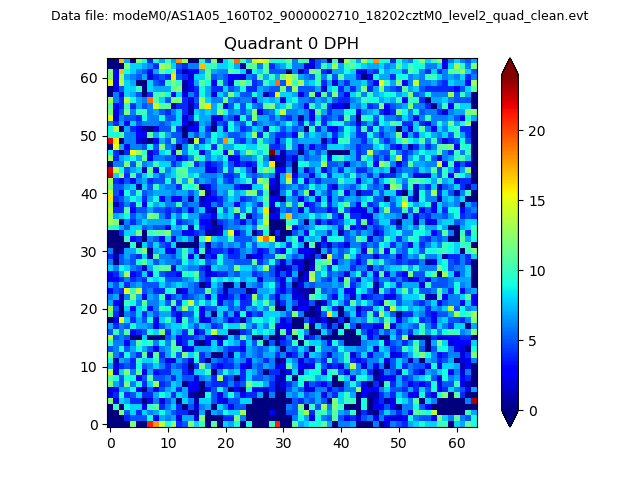 |
 |
Quadrant B |
|---|---|---|---|
| Quadrant D | 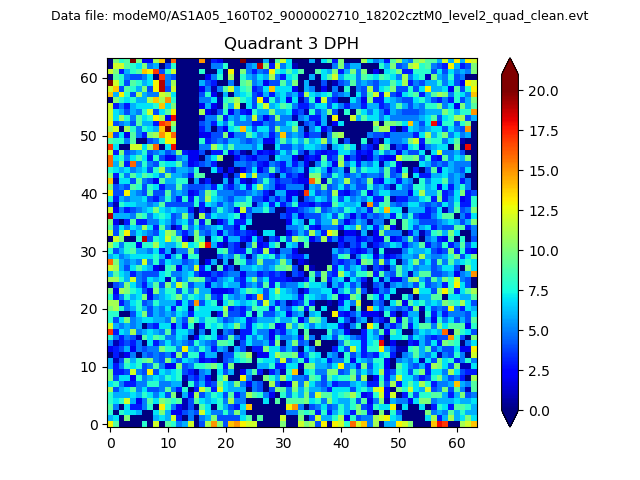 |
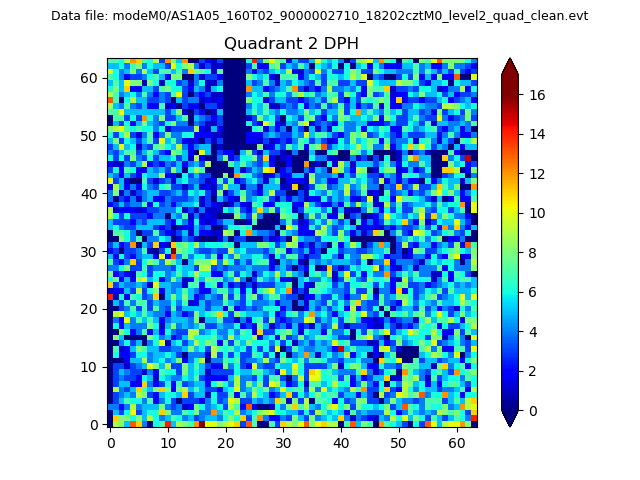 |
Quadrant C |
| Plot type | Count rate plots | Images |
|---|---|---|
| Comparison with Poisson distribution Blue bars denote a histogram of data divided into 1 sec bins. Red curve is a Poisson curve with rate = median count rate of data. |
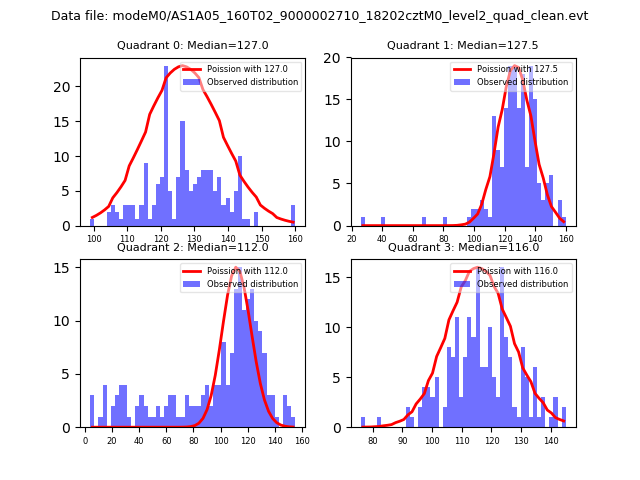 |
 |
| Quadrant-wise count rates Data is divided into 100 sec bins |
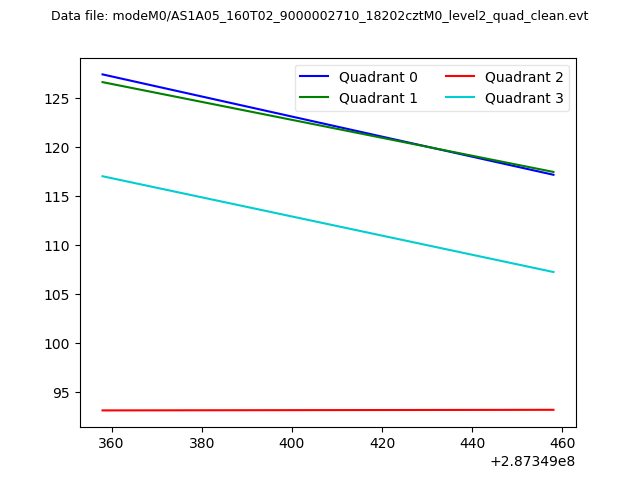 |
|
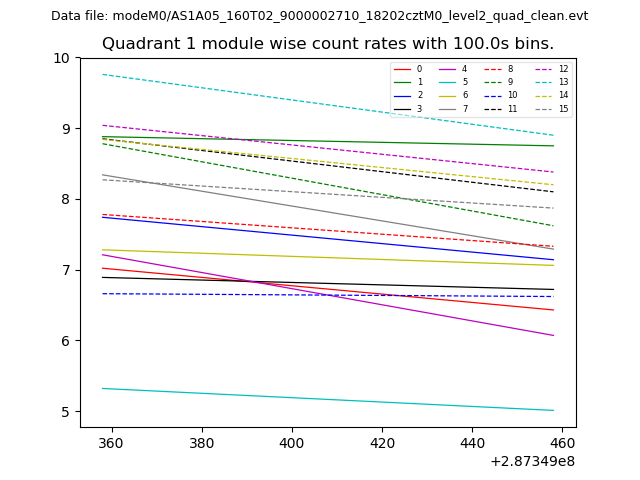
| Module-wise count rates for Quadrant A Data is divided into 100 sec bins |
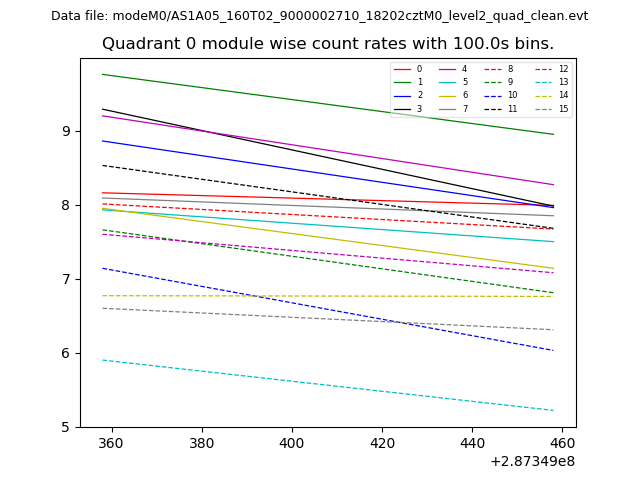 |
 |
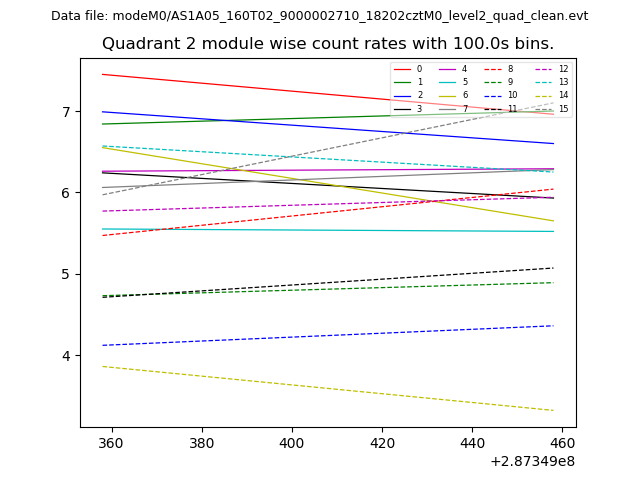
| Module-wise count rates for Quadrant B Data is divided into 100 sec bins |
 |
 |
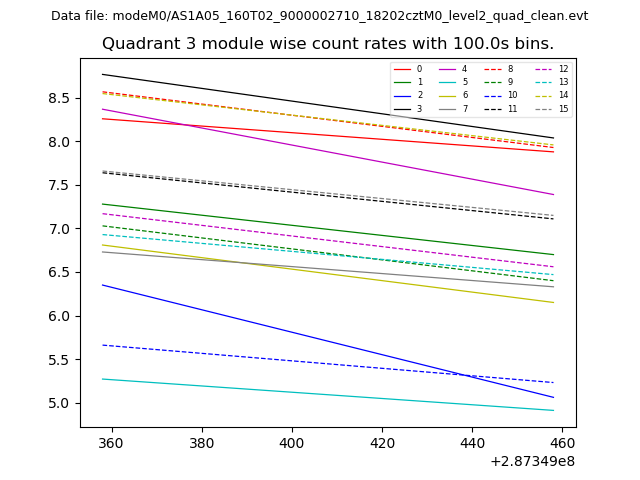
| Module-wise count rates for Quadrant C Data is divided into 100 sec bins |
 |
 |
| Module-wise count rates for Quadrant D Data is divided into 100 sec bins |
 |
 |
| Parameter | Plot |
|---|---|
| CZT HV Monitor | 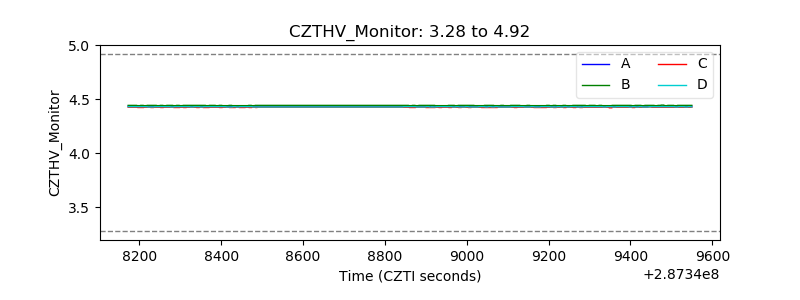 |
| D_VDD | 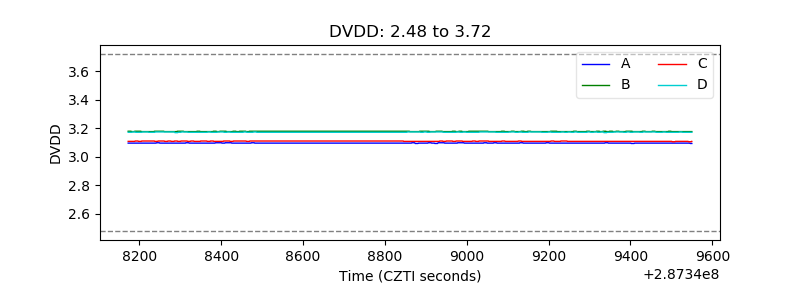 |
| Temperature 1 | 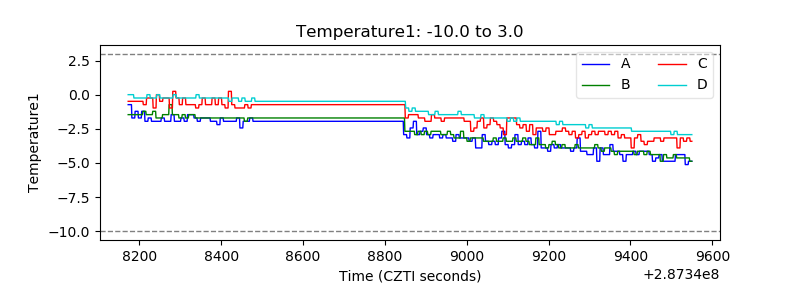 |
| Veto HV Monitor | 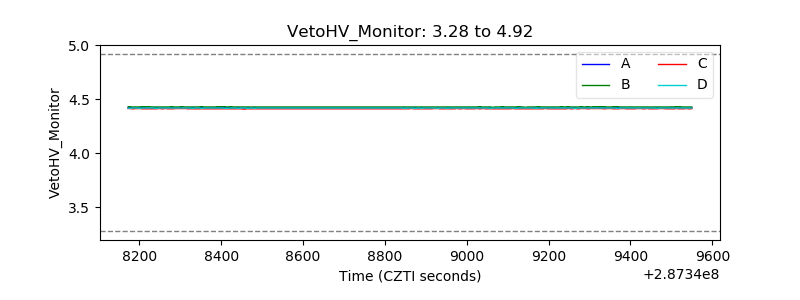 |
| Veto LLD | 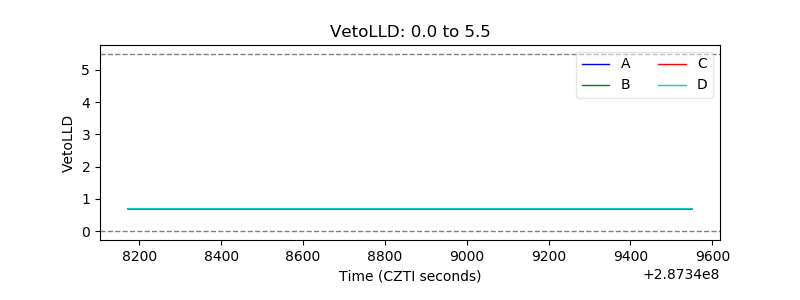 |
| Alpha Counter | 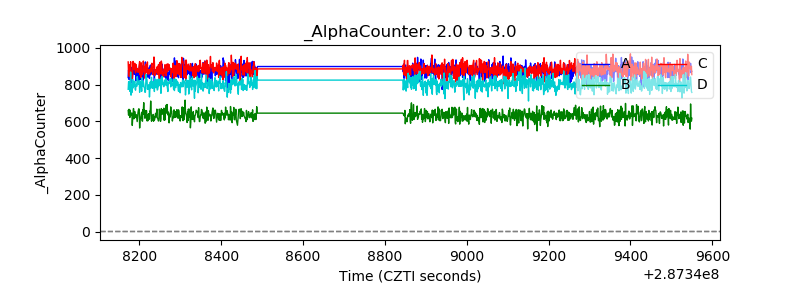 |
| _CPM_Rate | 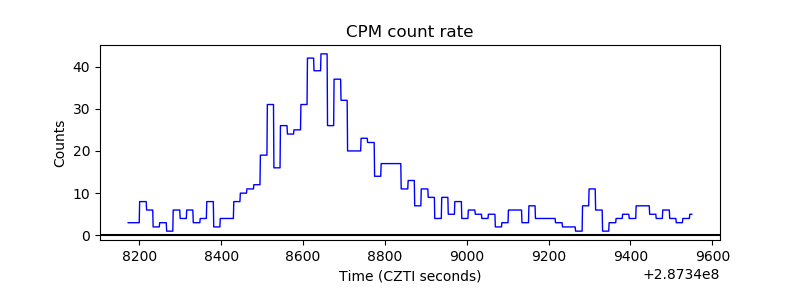 |
| CZT Counter | 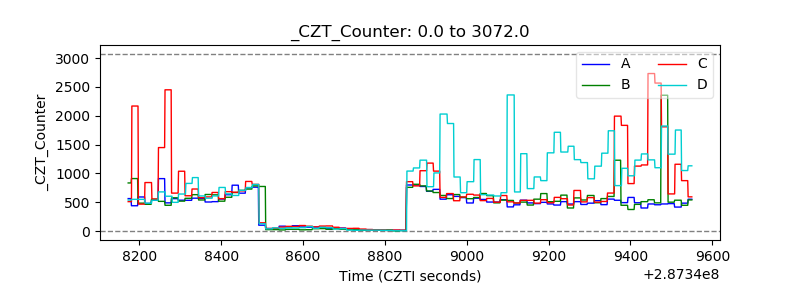 |
| +2.5 Volts monitor |  |
| +5 Volts monitor | 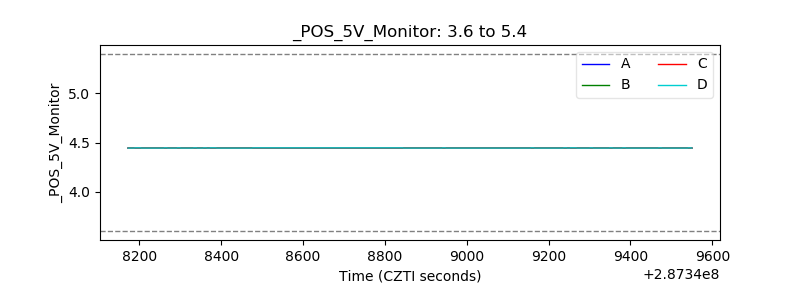 |
| _ROLL_ROT | 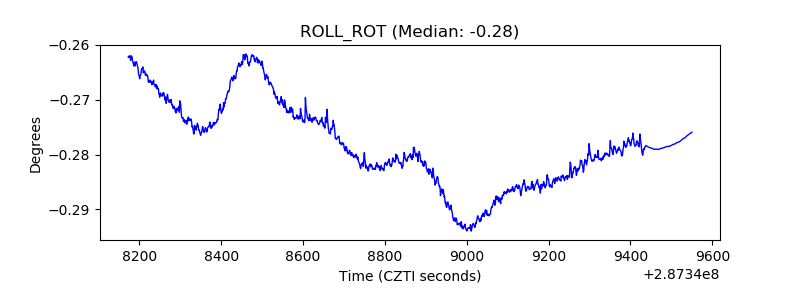 |
| _Roll_DEC | 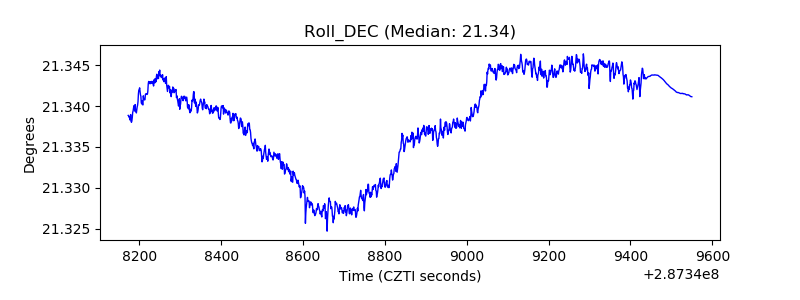 |
| _Roll_RA | 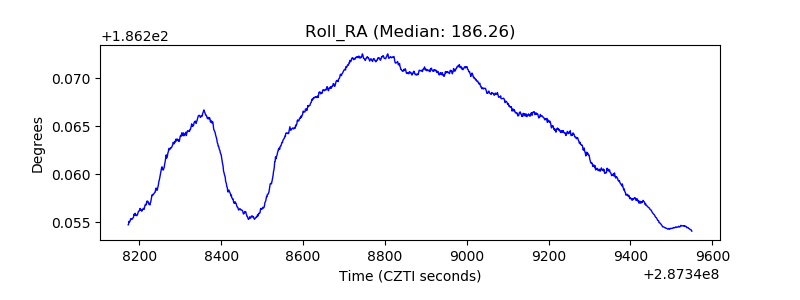 |
| Veto Counter | 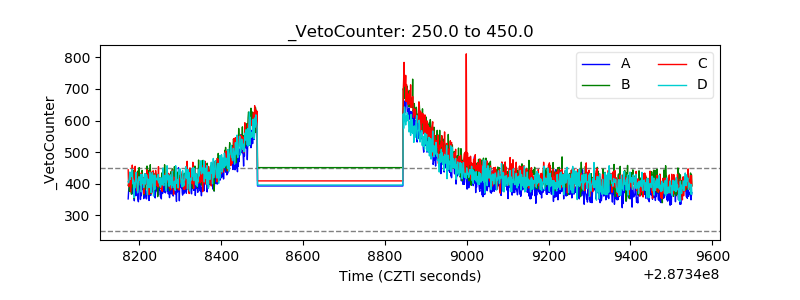 |