| Param | Original file | Final file |
|---|---|---|
| Filename | modeM0/AS1T03_003T01_9000002712cztM0_level2.fits | modeM0/AS1T03_003T01_9000002712cztM0_level2_quad_clean.evt |
| Size (bytes) | 797,880,960 | 675,852,480 |
| Size | 760.9 MB | 644.5 MB |
| Events in quadrant A | 4,937,492 | 3,881,279 |
| Events in quadrant B | 4,728,864 | 3,923,204 |
| Events in quadrant C | 4,780,676 | 3,713,163 |
| Events in quadrant D | 4,099,530 | 3,334,904 |
| Mode M9 | |||
|---|---|---|---|
| Quadrant | BADHDUFLAG | Total packets | Discarded packets |
| A | 0 | 125 | 0 |
| B | 0 | 125 | 0 |
| C | 0 | 125 | 0 |
| D | 0 | 125 | 0 |
| Mode M0 | |||
|---|---|---|---|
| Quadrant | BADHDUFLAG | Total packets | Discarded packets |
| A | 0 | 181497 | 0 |
| B | 0 | 173321 | 0 |
| C | 0 | 179816 | 0 |
| D | 0 | 243686 | 0 |
| Mode SS | |||
|---|---|---|---|
| Quadrant | BADHDUFLAG | Total packets | Discarded packets |
| A | 0 | 1670 | 0 |
| B | 0 | 1670 | 0 |
| C | 0 | 1670 | 0 |
| D | 0 | 1670 | 0 |
| Quadrant | Total seconds | Saturated seconds | Saturation percentage |
|---|---|---|---|
| A | 81915 | 1933 | 2.359763% |
| B | 81915 | 1147 | 1.400232% |
| C | 81853 | 2224 | 2.717066% |
| D | 81848 | 5681 | 6.940915% |
Noise dominated data is calculated using 1-second bins in cleaned event files. If a bin has >2000 counts, and if more than 50% of those come from <1% of pixels, then it is considered to be noise-dominated and hence unusable.
| Quadrant | # 1 sec bins | Bins with >0 counts | Bins with >2000 counts | High rate bins dominated by noise | Noise dominated (total time) | Noise dominated (detector-on time) | Marked lightcurve |
|---|---|---|---|---|---|---|---|
| A | 94528 | 81955 | 0 | 0 | 0.00% | 0.00% |  |
| B | 94528 | 81969 | 0 | 0 | 0.00% | 0.00% |  |
| C | 94528 | 81938 | 0 | 0 | 0.00% | 0.00% |  |
| D | 94528 | 81772 | 0 | 0 | 0.00% | 0.00% |  |
Top three noisy pixels from each quadrant. If the there are fewer than three noisy pixels in the level2.evt file, extra rows are filled as -1
| Pixel properties | Quadrant properties | ||||||
|---|---|---|---|---|---|---|---|
| Quadrant | DetID | PixID | Counts | Sigma | Mean | Median | Sigma |
| A | 0 | 29 | 4710 | 11.06 | 1285 | 1206 | 316.8 |
| A | 7 | 110 | 3939 | 8.63 | 1285 | 1206 | 316.8 |
| A | 0 | 30 | 3777 | 8.12 | 1285 | 1206 | 316.8 |
| B | 2 | 9 | 3908 | 11.02 | 1250 | 1191 | 246.5 |
| B | 2 | 8 | 3333 | 8.69 | 1250 | 1191 | 246.5 |
| B | 3 | 17 | 3186 | 8.09 | 1250 | 1191 | 246.5 |
| C | 12 | 241 | 3328 | 6.68 | 1263 | 1181 | 321.3 |
| C | 3 | 126 | 3279 | 6.53 | 1263 | 1181 | 321.3 |
| C | 2 | 191 | 3159 | 6.16 | 1263 | 1181 | 321.3 |
| D | 10 | 190 | 3075 | 6.43 | 1171 | 1067 | 312.4 |
| D | 3 | 14 | 3053 | 6.36 | 1171 | 1067 | 312.4 |
| D | 6 | 231 | 3044 | 6.33 | 1171 | 1067 | 312.4 |
Histogram calculated using DETX and DETY for each event in the final _common_clean file
| Quadrant A | 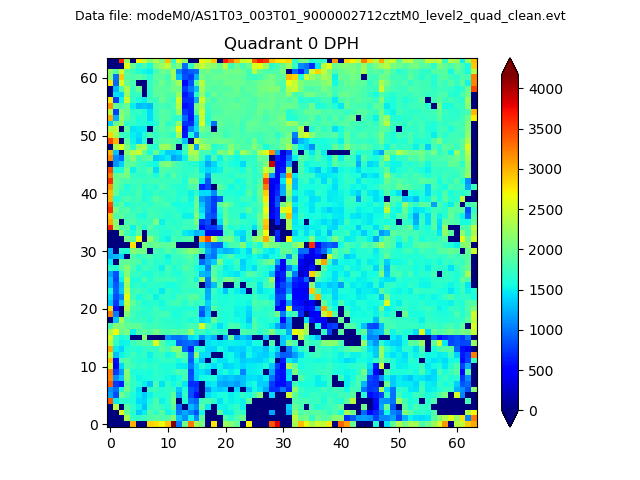 |
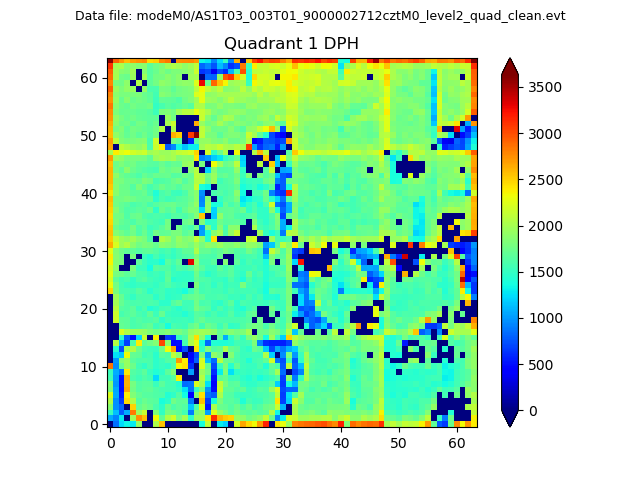 |
Quadrant B |
|---|---|---|---|
| Quadrant D |  |
 |
Quadrant C |
| Plot type | Count rate plots | Images |
|---|---|---|
| Comparison with Poisson distribution Blue bars denote a histogram of data divided into 1 sec bins. Red curve is a Poisson curve with rate = median count rate of data. |
 |
 |
| Quadrant-wise count rates Data is divided into 100 sec bins |
 |
|
| Module-wise count rates for Quadrant A Data is divided into 100 sec bins |
 |
 |
| Module-wise count rates for Quadrant B Data is divided into 100 sec bins |
 |
 |
| Module-wise count rates for Quadrant C Data is divided into 100 sec bins |
 |
 |
| Module-wise count rates for Quadrant D Data is divided into 100 sec bins |
 |
 |
| Parameter | Plot |
|---|---|
| CZT HV Monitor | 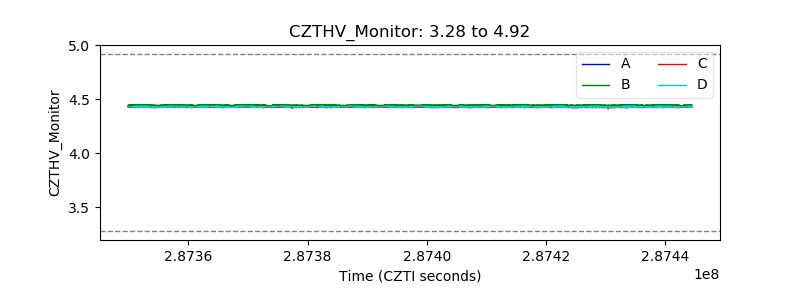 |
| D_VDD |  |
| Temperature 1 | 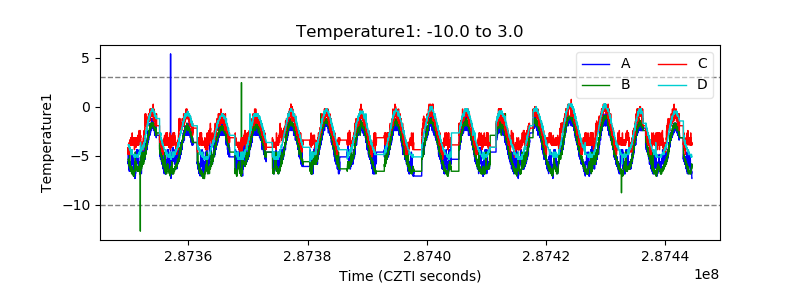 |
| Veto HV Monitor |  |
| Veto LLD |  |
| Alpha Counter | 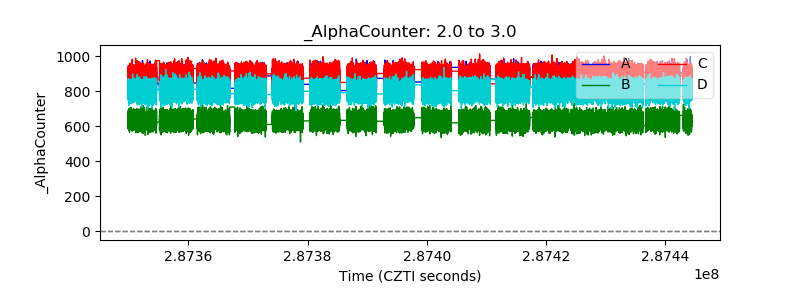 |
| _CPM_Rate |  |
| CZT Counter |  |
| +2.5 Volts monitor |  |
| +5 Volts monitor | 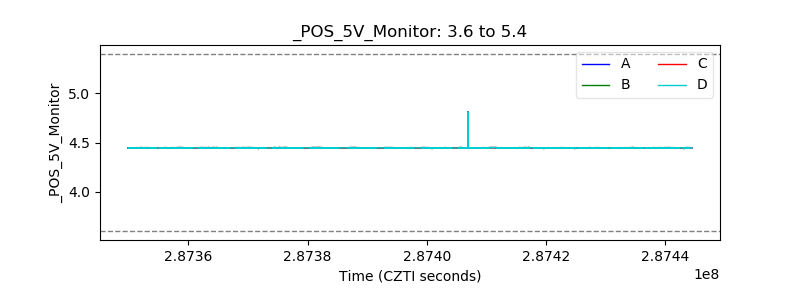 |
| _ROLL_ROT | 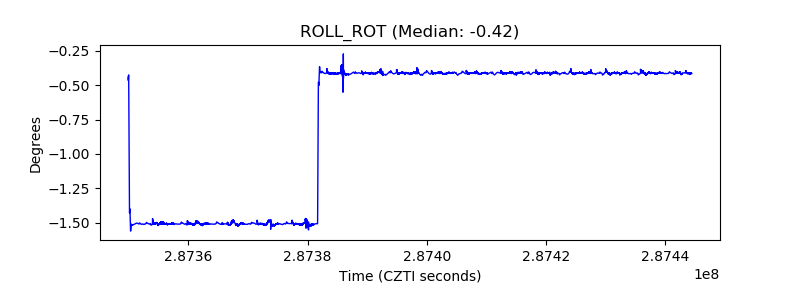 |
| _Roll_DEC |  |
| _Roll_RA |  |
| Veto Counter |  |