| Param | Original file | Final file |
|---|---|---|
| Filename | modeM0/AS1T03_003T01_9000002712_18200cztM0_level2.evt | modeM0/AS1T03_003T01_9000002712_18200cztM0_level2_quad_clean.evt |
| Size (bytes) | 32,074,560 | 8,625,600 |
| Size | 30.6 MB | 8.2 MB |
| Events in quadrant A | 206,411 | 55,670 |
| Events in quadrant B | 213,215 | 56,639 |
| Events in quadrant C | 247,019 | 55,087 |
| Events in quadrant D | 270,029 | 53,425 |
| Mode M0 | |||
|---|---|---|---|
| Quadrant | BADHDUFLAG | Total packets | Discarded packets |
| A | 0 | 934 | 0 |
| B | 0 | 926 | 0 |
| C | 0 | 1020 | 0 |
| D | 0 | 1073 | 0 |
| Mode SS | |||
|---|---|---|---|
| Quadrant | BADHDUFLAG | Total packets | Discarded packets |
| A | 0 | 8 | 0 |
| B | 0 | 8 | 0 |
| C | 0 | 8 | 0 |
| D | 0 | 8 | 0 |
| Quadrant | Total seconds | Saturated seconds | Saturation percentage |
|---|---|---|---|
| A | 460 | 0 | 0.000000% |
| B | 460 | 0 | 0.000000% |
| C | 459 | 4 | 0.871460% |
| D | 459 | 7 | 1.525054% |
Noise dominated data is calculated using 1-second bins in cleaned event files. If a bin has >2000 counts, and if more than 50% of those come from <1% of pixels, then it is considered to be noise-dominated and hence unusable.
| Quadrant | # 1 sec bins | Bins with >0 counts | Bins with >2000 counts | High rate bins dominated by noise | Noise dominated (total time) | Noise dominated (detector-on time) | Marked lightcurve |
|---|---|---|---|---|---|---|---|
| A | 460 | 460 | 0 | 0 | 0.00% | 0.00% | 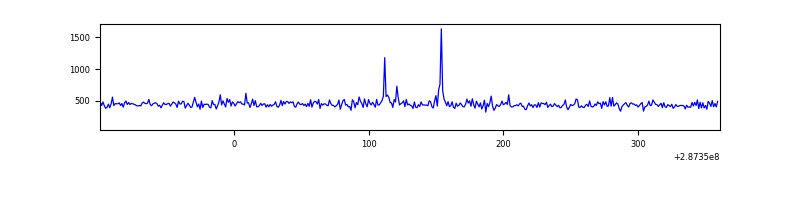 |
| B | 460 | 460 | 0 | 0 | 0.00% | 0.00% | 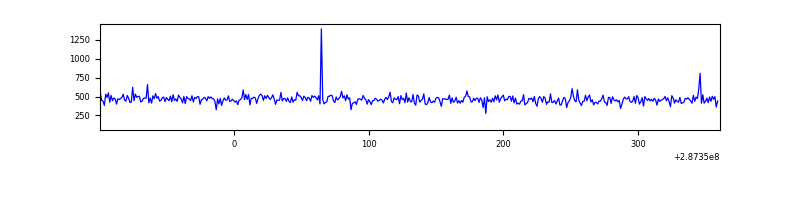 |
| C | 459 | 459 | 4 | 4 | 0.87% | 0.87% | 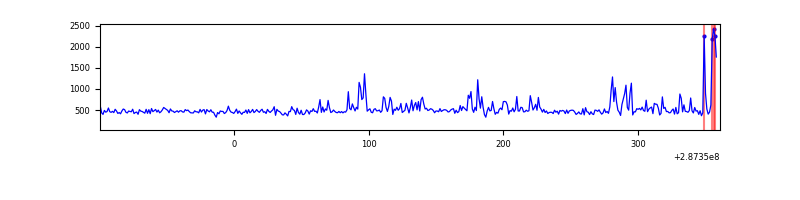 |
| D | 459 | 459 | 4 | 4 | 0.87% | 0.87% | 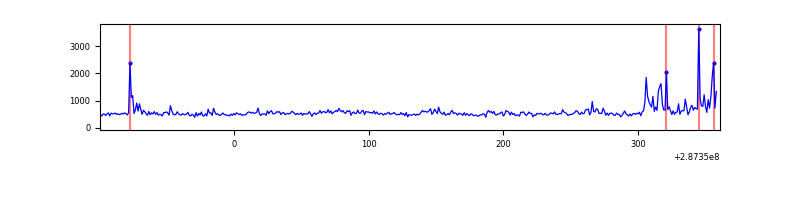 |
Top three noisy pixels from each quadrant. If the there are fewer than three noisy pixels in the level2.evt file, extra rows are filled as -1
| Pixel properties | Quadrant properties | ||||||
|---|---|---|---|---|---|---|---|
| Quadrant | DetID | PixID | Counts | Sigma | Mean | Median | Sigma |
| A | 15 | 174 | 4572 | 352.5 | 52 | 51 | 12.8 |
| A | 0 | 226 | 387 | 26.2 | 52 | 51 | 12.8 |
| A | 12 | 194 | 378 | 25.5 | 52 | 51 | 12.8 |
| B | 12 | 111 | 1233 | 93.68 | 53 | 52 | 12.6 |
| B | 11 | 111 | 1101 | 83.21 | 53 | 52 | 12.6 |
| B | 0 | 182 | 1022 | 76.94 | 53 | 52 | 12.6 |
| C | 4 | 254 | 37762 | 2619.7 | 51 | 51 | 14.4 |
| C | 14 | 238 | 8169 | 563.94 | 51 | 51 | 14.4 |
| C | 13 | 61 | 392 | 23.69 | 51 | 51 | 14.4 |
| D | 5 | 222 | 29196 | 1999.41 | 50 | 48 | 14.6 |
| D | 10 | 70 | 24472 | 1675.36 | 50 | 48 | 14.6 |
| D | 7 | 238 | 14024 | 958.67 | 50 | 48 | 14.6 |
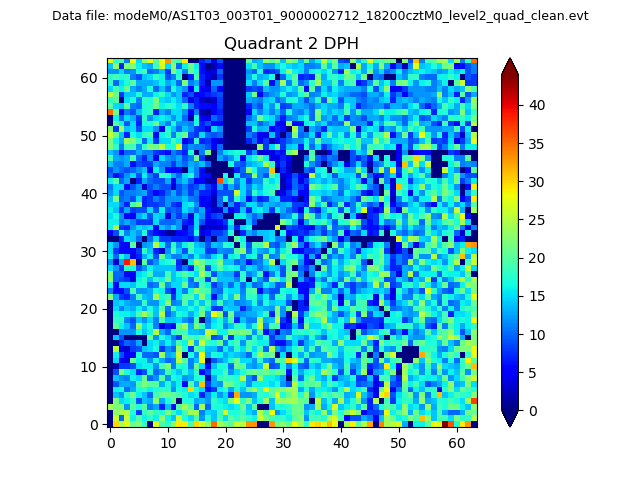
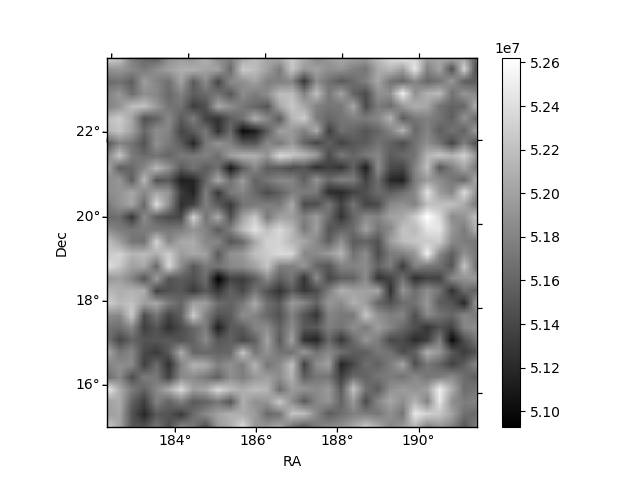
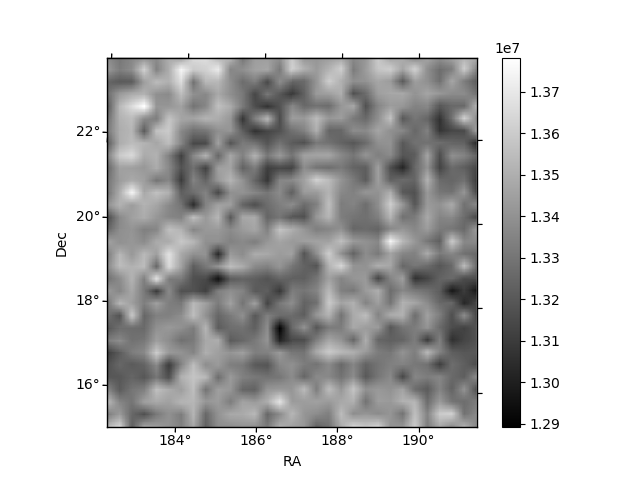
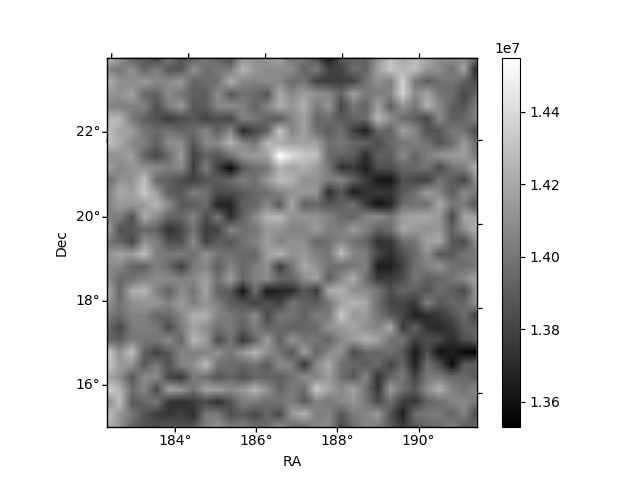
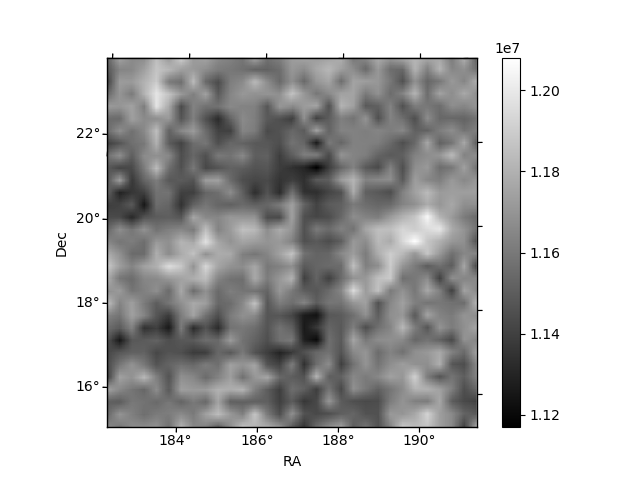
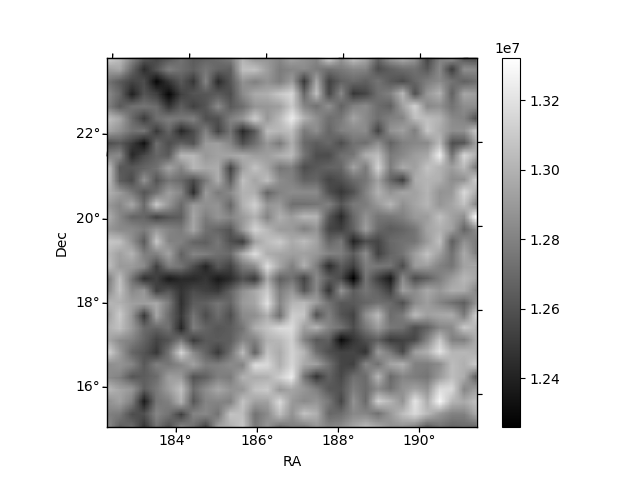
Histogram calculated using DETX and DETY for each event in the final _common_clean file
| Quadrant A | 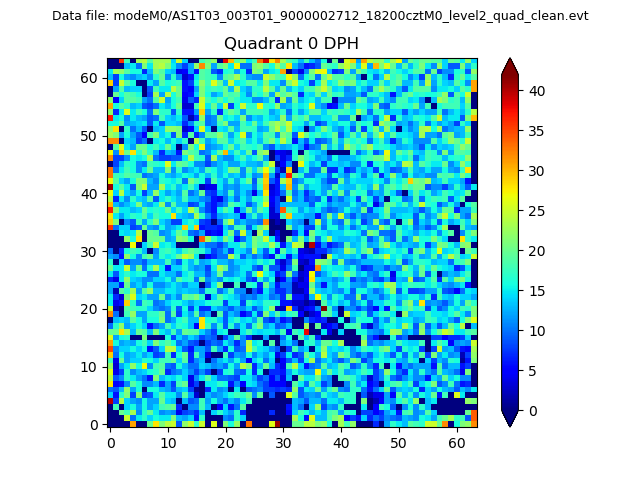 |
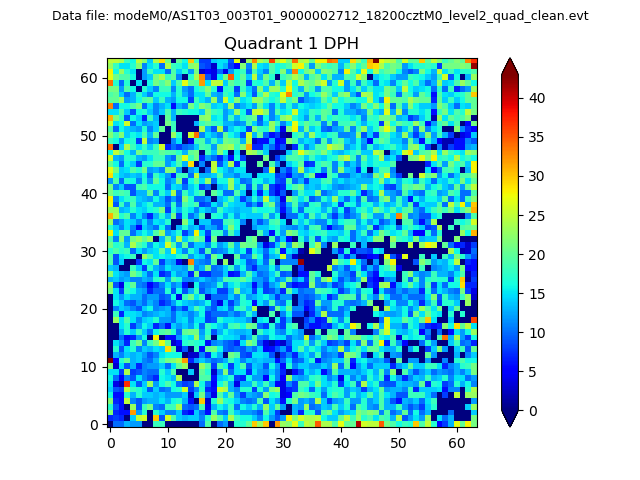 |
Quadrant B |
|---|---|---|---|
| Quadrant D | 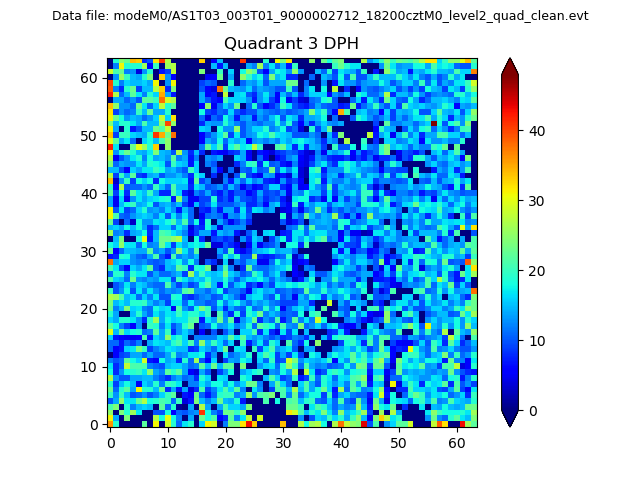 |
 |
Quadrant C |
| Plot type | Count rate plots | Images |
|---|---|---|
| Comparison with Poisson distribution Blue bars denote a histogram of data divided into 1 sec bins. Red curve is a Poisson curve with rate = median count rate of data. |
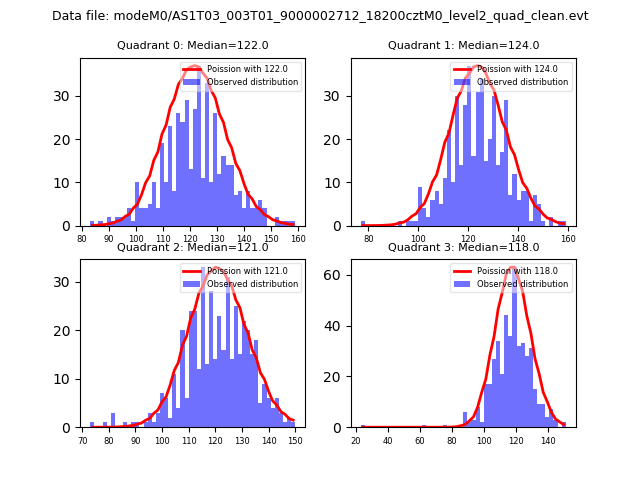 |
 |
| Quadrant-wise count rates Data is divided into 100 sec bins |
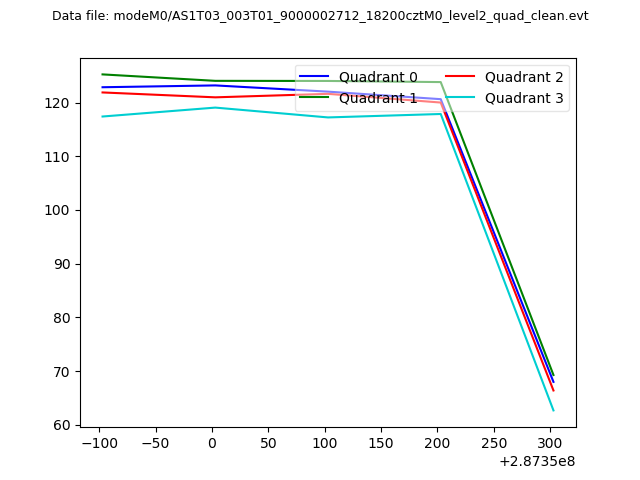 |
|
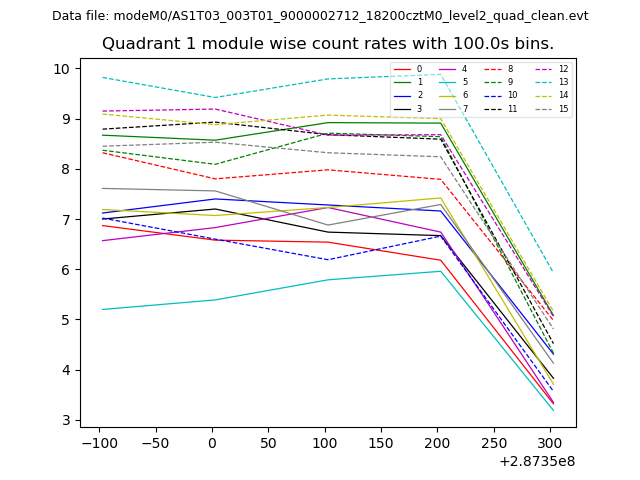
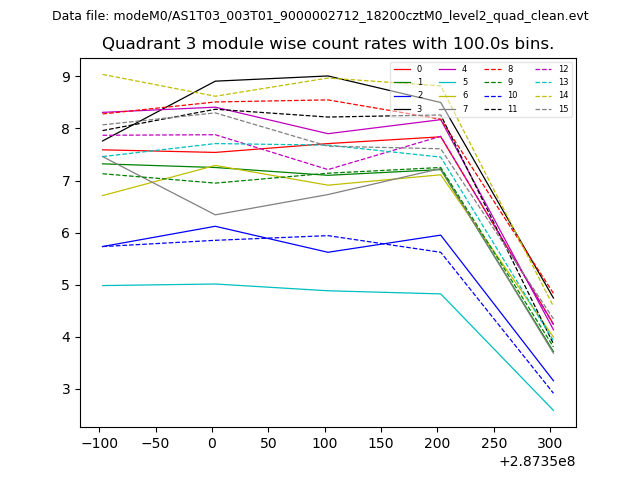
| Module-wise count rates for Quadrant A Data is divided into 100 sec bins |
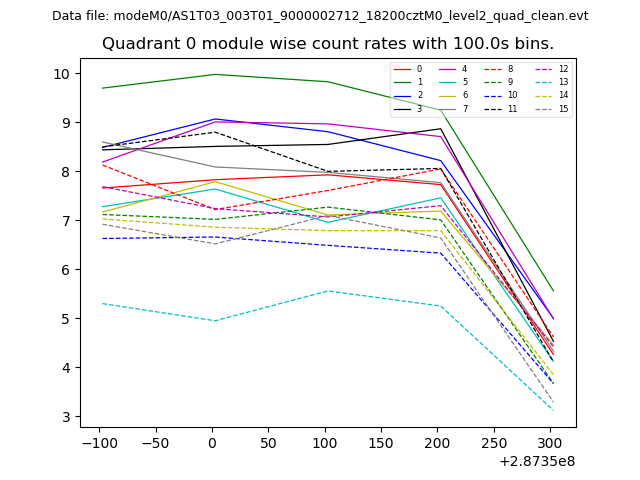 |
 |
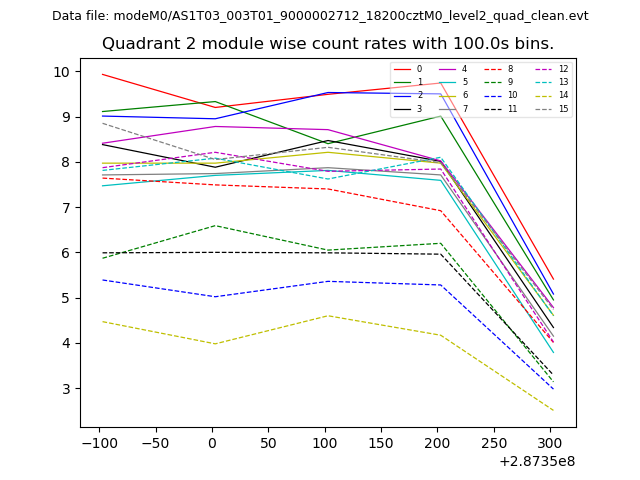
| Module-wise count rates for Quadrant B Data is divided into 100 sec bins |
 |
 |
| Module-wise count rates for Quadrant C Data is divided into 100 sec bins |
 |
 |
| Module-wise count rates for Quadrant D Data is divided into 100 sec bins |
 |
 |
| Parameter | Plot |
|---|---|
| CZT HV Monitor | 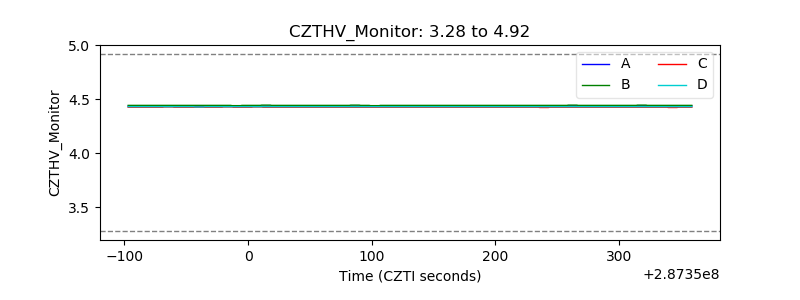 |
| D_VDD | 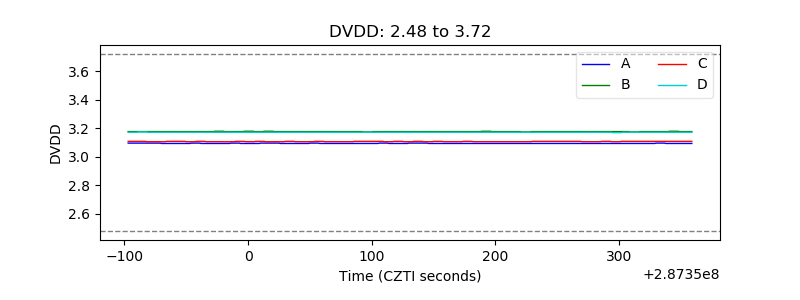 |
| Temperature 1 | 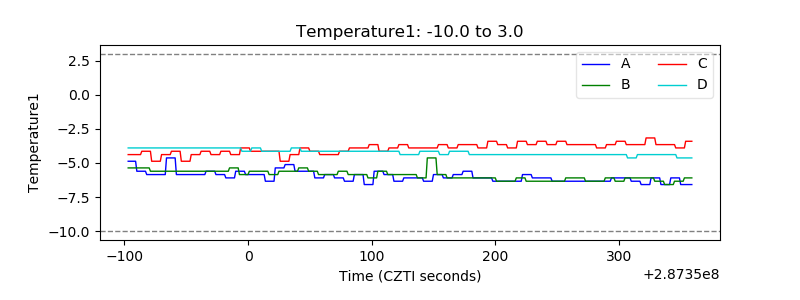 |
| Veto HV Monitor | 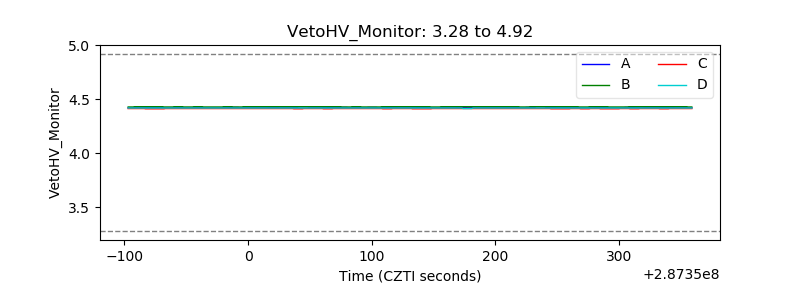 |
| Veto LLD | 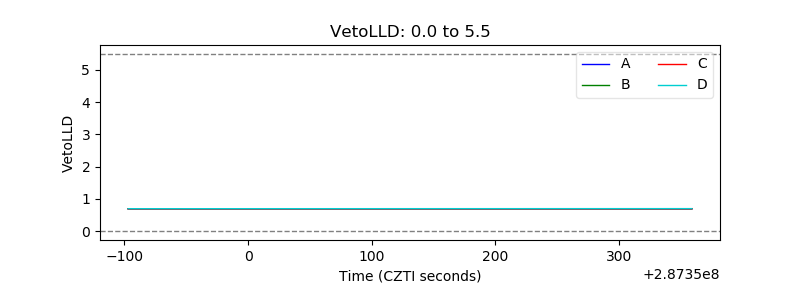 |
| Alpha Counter | 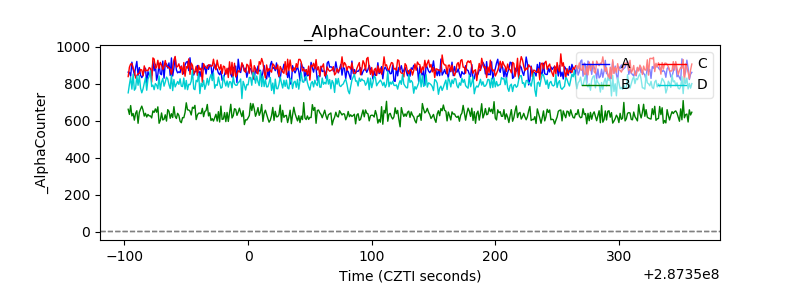 |
| _CPM_Rate | 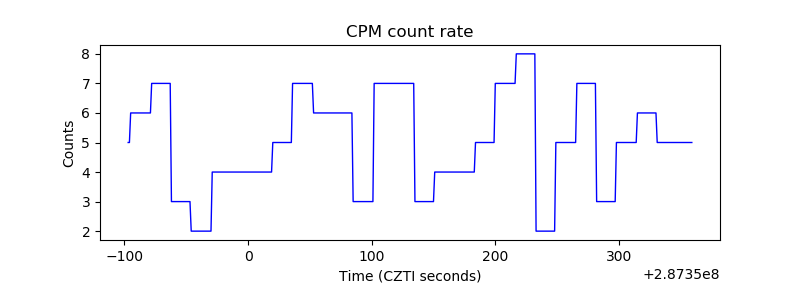 |
| CZT Counter | 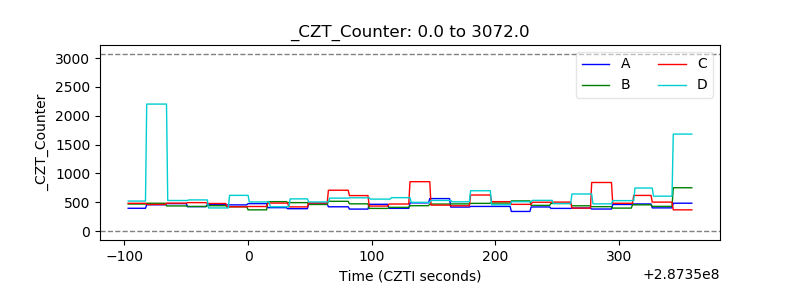 |
| +2.5 Volts monitor | 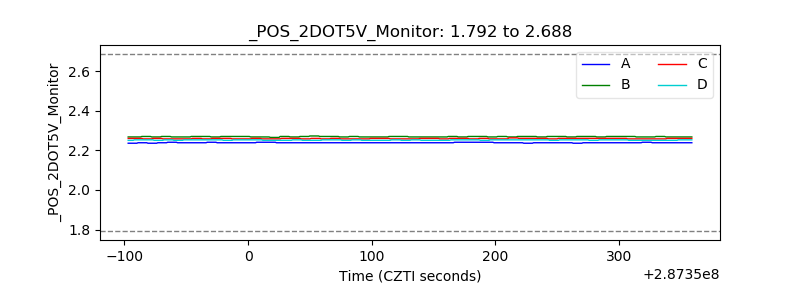 |
| +5 Volts monitor |  |
| _ROLL_ROT | 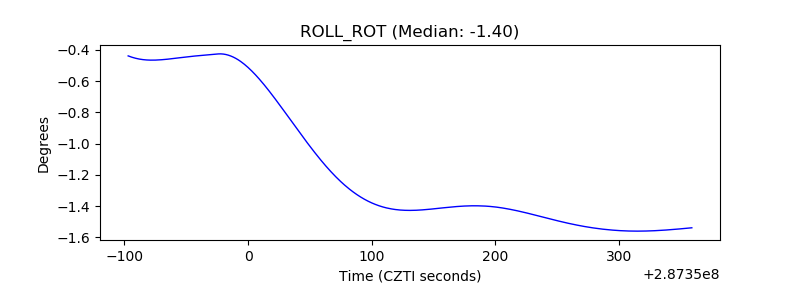 |
| _Roll_DEC |  |
| _Roll_RA | 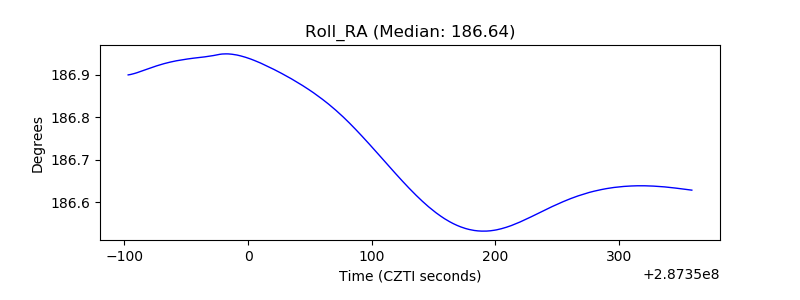 |
| Veto Counter | 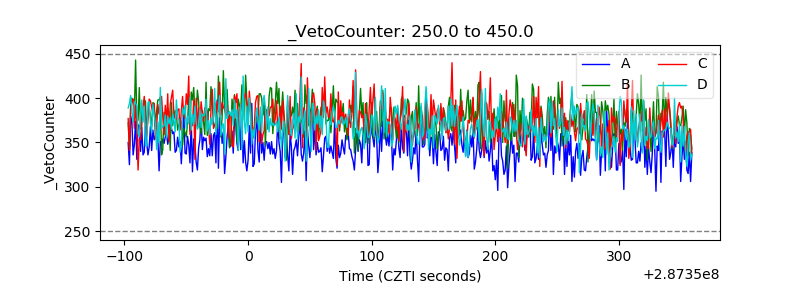 |