| Param | Original file | Final file |
|---|---|---|
| Filename | modeM0/AS1T03_003T01_9000002712_18202cztM0_level2.evt | modeM0/AS1T03_003T01_9000002712_18202cztM0_level2_quad_clean.evt |
| Size (bytes) | 643,127,040 | 113,852,160 |
| Size | 613.3 MB | 108.6 MB |
| Events in quadrant A | 3,637,704 | 741,111 |
| Events in quadrant B | 3,589,861 | 752,013 |
| Events in quadrant C | 6,312,216 | 699,671 |
| Events in quadrant D | 5,405,869 | 709,857 |
| Mode M9 | |||
|---|---|---|---|
| Quadrant | BADHDUFLAG | Total packets | Discarded packets |
| A | 0 | 5 | 0 |
| B | 0 | 5 | 0 |
| C | 0 | 5 | 0 |
| D | 0 | 5 | 0 |
| Mode M0 | |||
|---|---|---|---|
| Quadrant | BADHDUFLAG | Total packets | Discarded packets |
| A | 0 | 16617 | 144 |
| B | 0 | 16341 | 150 |
| C | 0 | 24745 | 638 |
| D | 0 | 22292 | 618 |
| Mode SS | |||
|---|---|---|---|
| Quadrant | BADHDUFLAG | Total packets | Discarded packets |
| A | 0 | 160 | 0 |
| B | 0 | 160 | 0 |
| C | 0 | 160 | 0 |
| D | 0 | 160 | 2 |
| Quadrant | Total seconds | Saturated seconds | Saturation percentage |
|---|---|---|---|
| A | 7874 | 71 | 0.901702% |
| B | 7872 | 54 | 0.685976% |
| C | 7809 | 850 | 10.884876% |
| D | 7809 | 251 | 3.214240% |
Noise dominated data is calculated using 1-second bins in cleaned event files. If a bin has >2000 counts, and if more than 50% of those come from <1% of pixels, then it is considered to be noise-dominated and hence unusable.
| Quadrant | # 1 sec bins | Bins with >0 counts | Bins with >2000 counts | High rate bins dominated by noise | Noise dominated (total time) | Noise dominated (detector-on time) | Marked lightcurve |
|---|---|---|---|---|---|---|---|
| A | 8450 | 7942 | 20 | 20 | 0.24% | 0.25% | 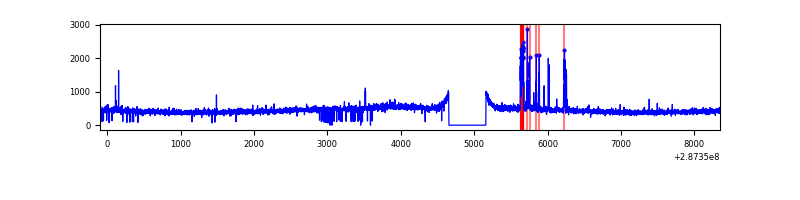 |
| B | 8450 | 7942 | 1 | 1 | 0.01% | 0.01% | 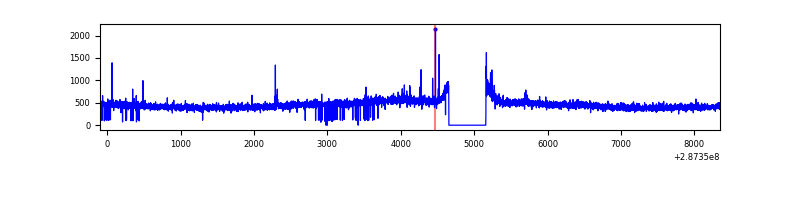 |
| C | 8450 | 7917 | 473 | 473 | 5.60% | 5.97% | 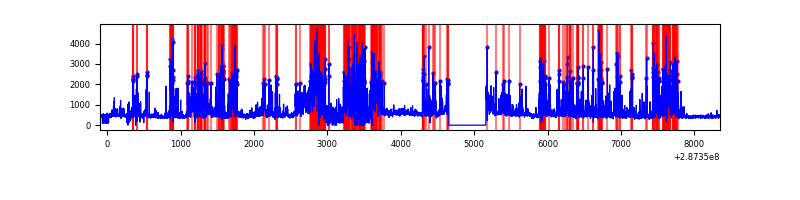 |
| D | 8449 | 7911 | 128 | 128 | 1.51% | 1.62% | 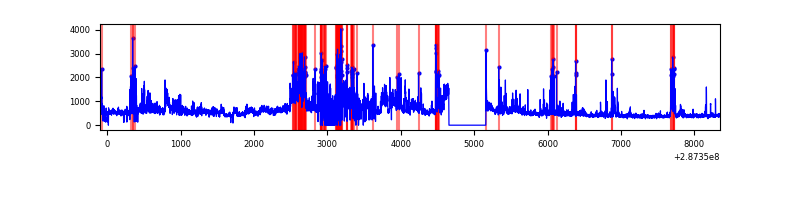 |
Top three noisy pixels from each quadrant. If the there are fewer than three noisy pixels in the level2.evt file, extra rows are filled as -1
| Pixel properties | Quadrant properties | ||||||
|---|---|---|---|---|---|---|---|
| Quadrant | DetID | PixID | Counts | Sigma | Mean | Median | Sigma |
| A | 15 | 174 | 152973 | 827.24 | 904 | 885 | 183.8 |
| A | 0 | 226 | 7722 | 37.19 | 904 | 885 | 183.8 |
| A | 3 | 137 | 6881 | 32.61 | 904 | 885 | 183.8 |
| B | 12 | 111 | 21234 | 116.7 | 905 | 881 | 174.4 |
| B | 11 | 111 | 18030 | 98.33 | 905 | 881 | 174.4 |
| B | 14 | 111 | 15140 | 81.76 | 905 | 881 | 174.4 |
| C | 4 | 254 | 2924289 | 14882.77 | 829 | 836 | 196.4 |
| C | 14 | 238 | 126787 | 641.19 | 829 | 836 | 196.4 |
| C | 3 | 233 | 18047 | 87.62 | 829 | 836 | 196.4 |
| D | 5 | 222 | 1669817 | 7903.9 | 862 | 835 | 211.2 |
| D | 7 | 238 | 271848 | 1283.45 | 862 | 835 | 211.2 |
| D | 10 | 70 | 147950 | 696.7 | 862 | 835 | 211.2 |
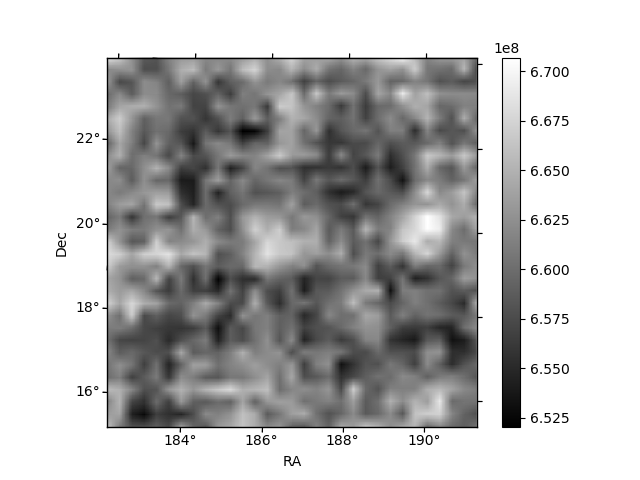
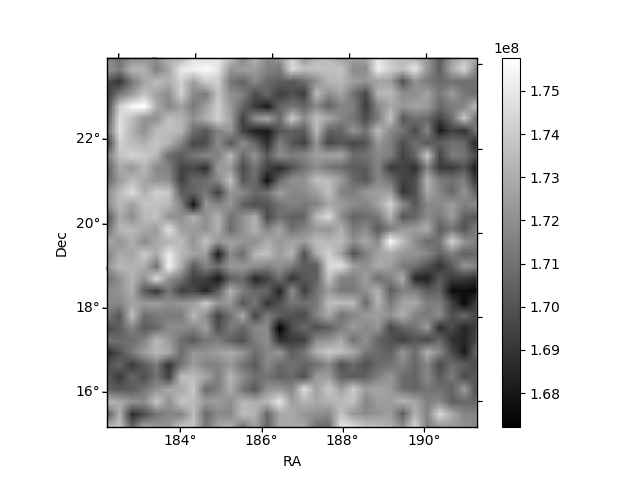
Histogram calculated using DETX and DETY for each event in the final _common_clean file
| Quadrant A | 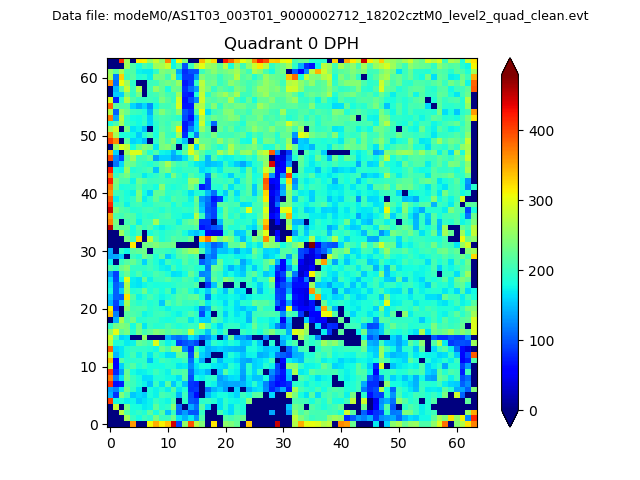 |
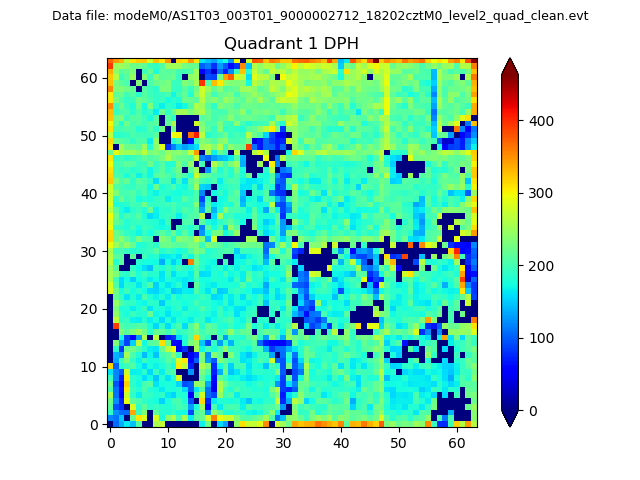 |
Quadrant B |
|---|---|---|---|
| Quadrant D |  |
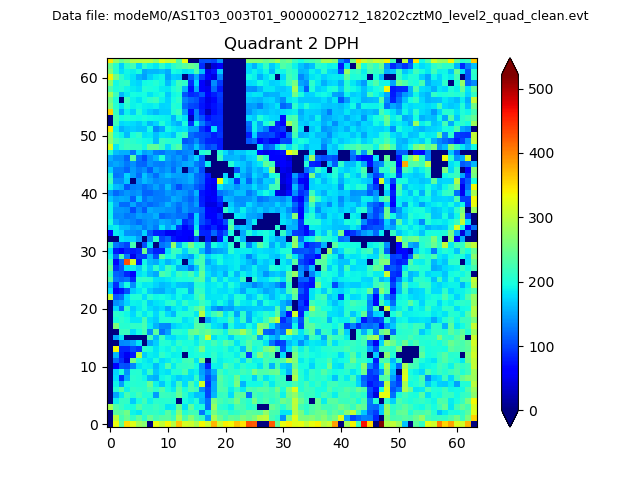 |
Quadrant C |
| Plot type | Count rate plots | Images |
|---|---|---|
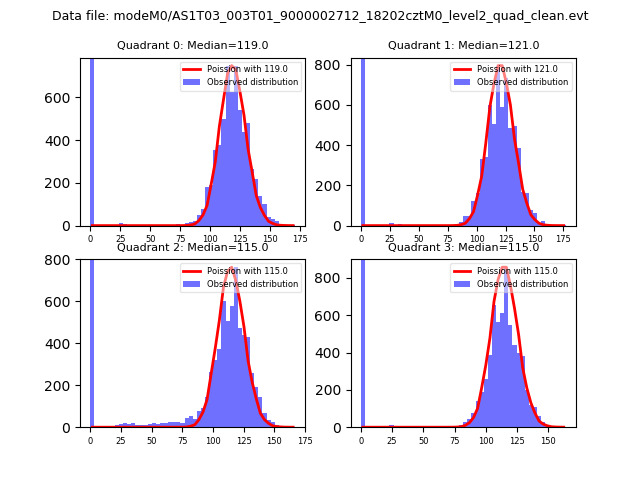
| Comparison with Poisson distribution Blue bars denote a histogram of data divided into 1 sec bins. Red curve is a Poisson curve with rate = median count rate of data. |
 |
 |
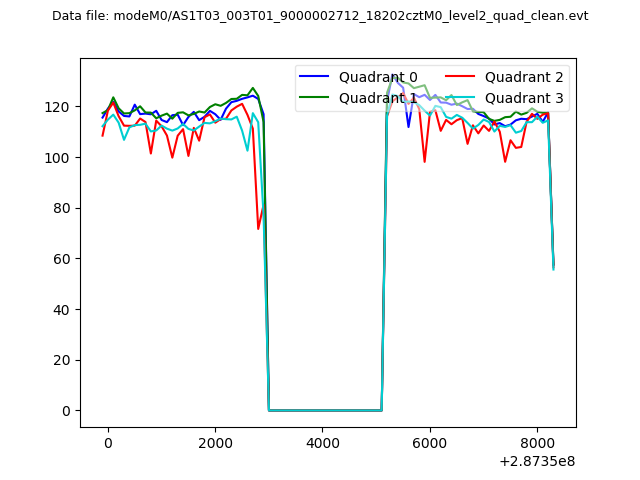
| Quadrant-wise count rates Data is divided into 100 sec bins |
 |
|
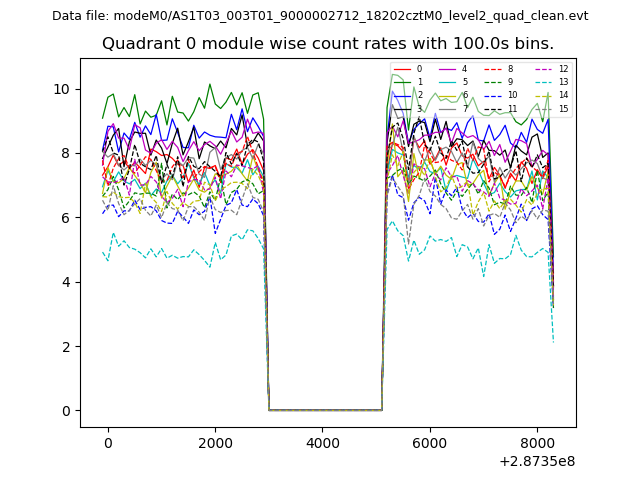
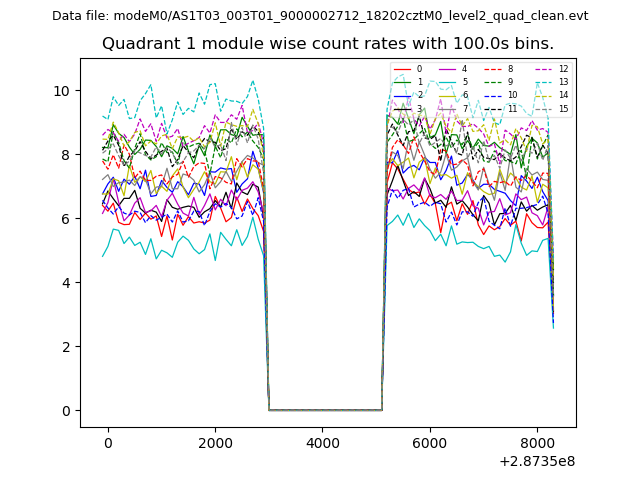
| Module-wise count rates for Quadrant A Data is divided into 100 sec bins |
 |
 |
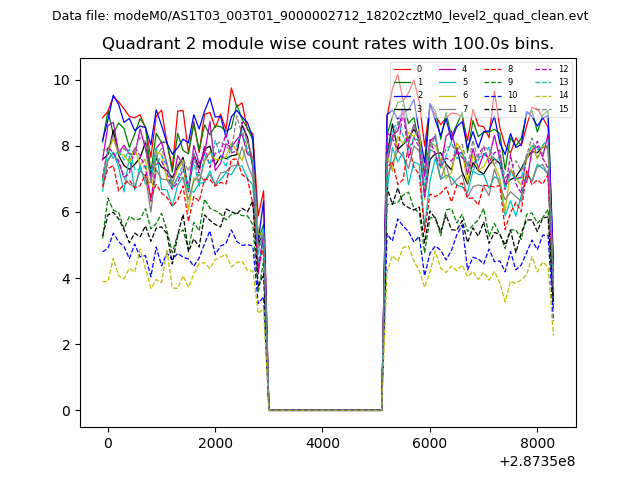
| Module-wise count rates for Quadrant B Data is divided into 100 sec bins |
 |
 |
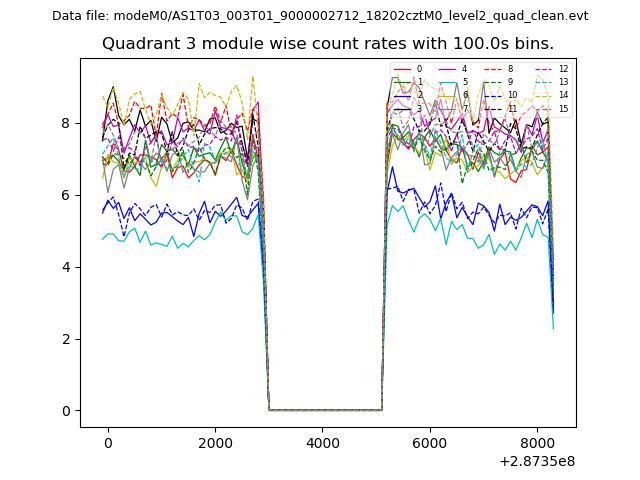
| Module-wise count rates for Quadrant C Data is divided into 100 sec bins |
 |
 |
| Module-wise count rates for Quadrant D Data is divided into 100 sec bins |
 |
 |
| Parameter | Plot |
|---|---|
| CZT HV Monitor | 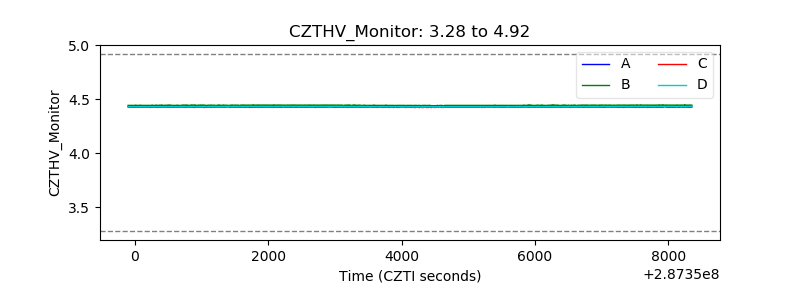 |
| D_VDD | 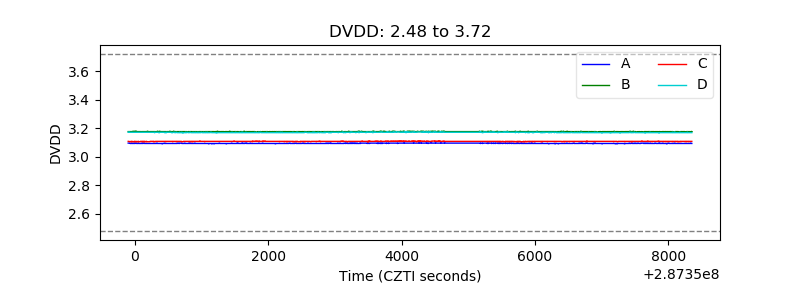 |
| Temperature 1 | 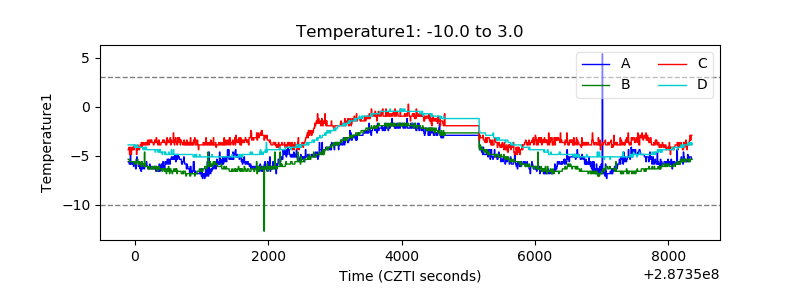 |
| Veto HV Monitor | 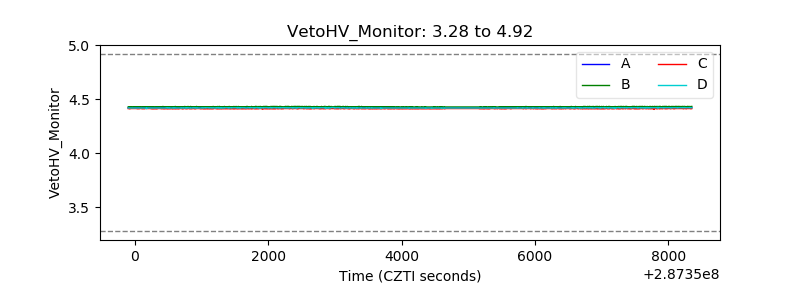 |
| Veto LLD | 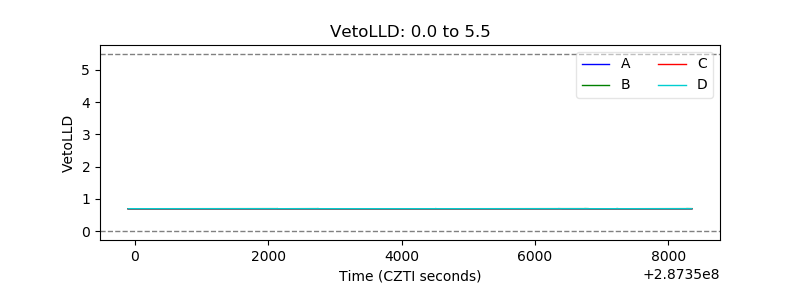 |
| Alpha Counter | 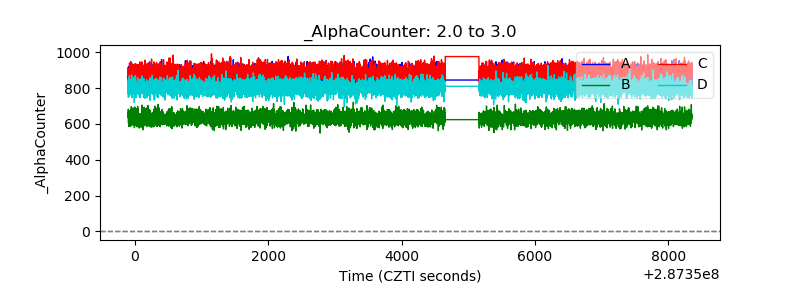 |
| _CPM_Rate | 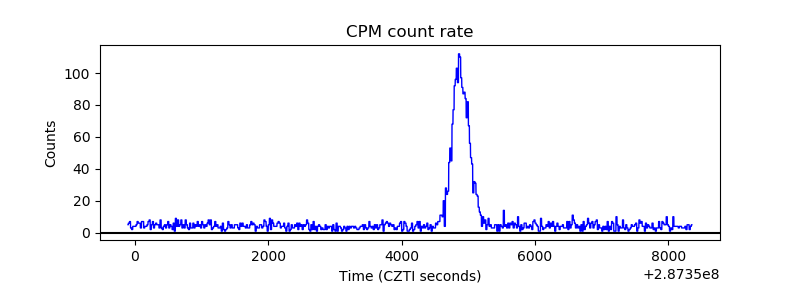 |
| CZT Counter | 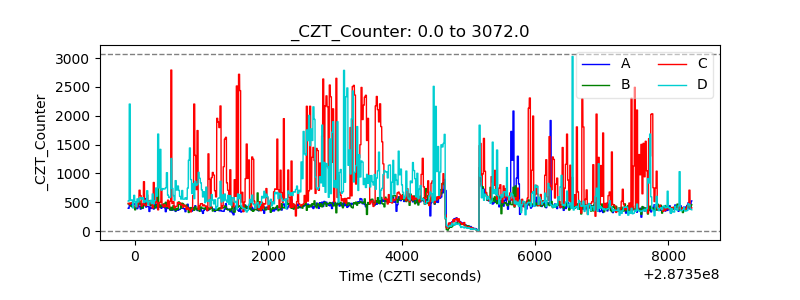 |
| +2.5 Volts monitor |  |
| +5 Volts monitor |  |
| _ROLL_ROT | 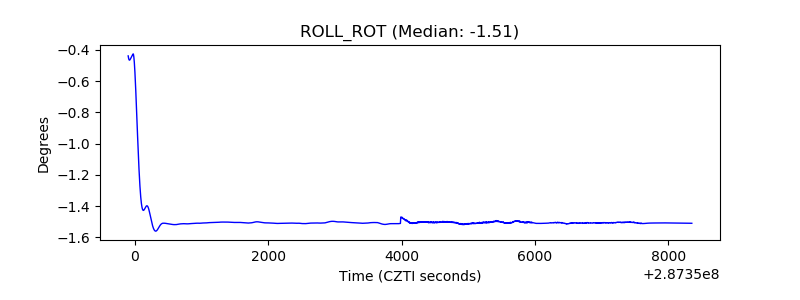 |
| _Roll_DEC | 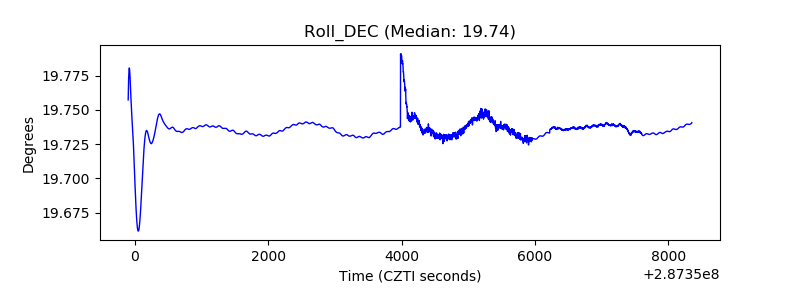 |
| _Roll_RA | 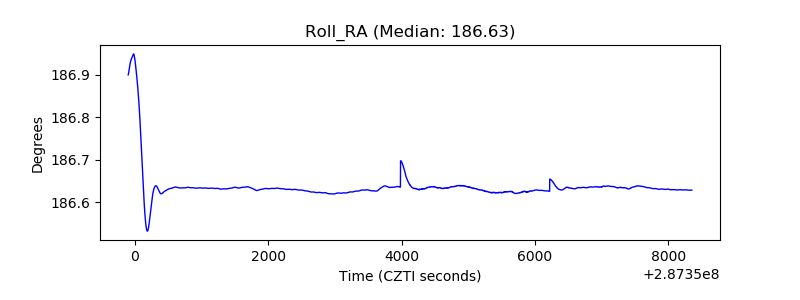 |
| Veto Counter | 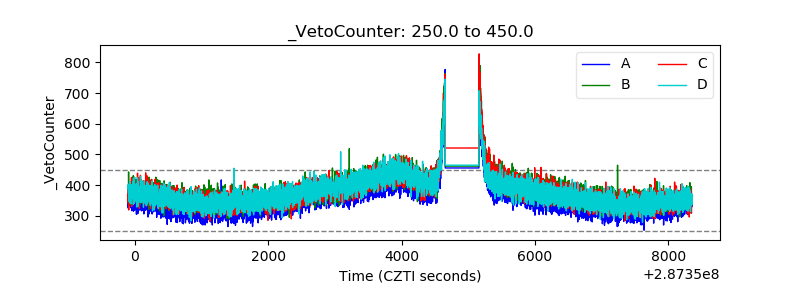 |