| Param | Original file | Final file |
|---|---|---|
| Filename | modeM0/AS1T03_003T01_9000002712_18204cztM0_level2.evt | modeM0/AS1T03_003T01_9000002712_18204cztM0_level2_quad_clean.evt |
| Size (bytes) | 563,610,240 | 97,168,320 |
| Size | 537.5 MB | 92.7 MB |
| Events in quadrant A | 3,784,619 | 607,260 |
| Events in quadrant B | 3,799,370 | 618,062 |
| Events in quadrant C | 3,747,798 | 594,285 |
| Events in quadrant D | 5,209,226 | 581,929 |
| Mode M9 | |||
|---|---|---|---|
| Quadrant | BADHDUFLAG | Total packets | Discarded packets |
| A | 0 | 19 | 0 |
| B | 0 | 19 | 0 |
| C | 0 | 19 | 0 |
| D | 0 | 19 | 0 |
| Mode M0 | |||
|---|---|---|---|
| Quadrant | BADHDUFLAG | Total packets | Discarded packets |
| A | 0 | 16250 | 2 |
| B | 0 | 16230 | 2 |
| C | 0 | 16114 | 2 |
| D | 0 | 20821 | 2 |
| Mode SS | |||
|---|---|---|---|
| Quadrant | BADHDUFLAG | Total packets | Discarded packets |
| A | 0 | 160 | 0 |
| B | 0 | 160 | 0 |
| C | 0 | 160 | 0 |
| D | 0 | 160 | 0 |
| Quadrant | Total seconds | Saturated seconds | Saturation percentage |
|---|---|---|---|
| A | 7780 | 75 | 0.964010% |
| B | 7780 | 88 | 1.131105% |
| C | 7780 | 110 | 1.413882% |
| D | 7780 | 335 | 4.305913% |
Noise dominated data is calculated using 1-second bins in cleaned event files. If a bin has >2000 counts, and if more than 50% of those come from <1% of pixels, then it is considered to be noise-dominated and hence unusable.
| Quadrant | # 1 sec bins | Bins with >0 counts | Bins with >2000 counts | High rate bins dominated by noise | Noise dominated (total time) | Noise dominated (detector-on time) | Marked lightcurve |
|---|---|---|---|---|---|---|---|
| A | 9670 | 7782 | 13 | 13 | 0.13% | 0.17% | 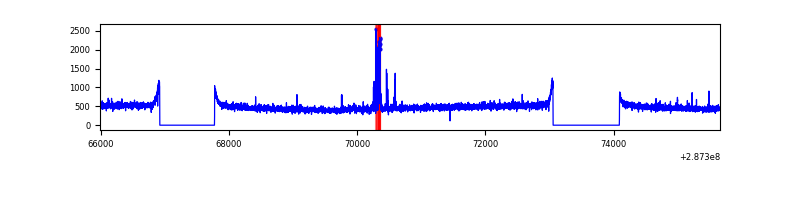 |
| B | 9670 | 7782 | 2 | 2 | 0.02% | 0.03% | 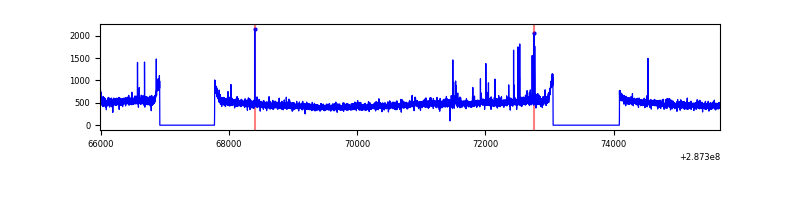 |
| C | 9671 | 7783 | 0 | 0 | 0.00% | 0.00% | 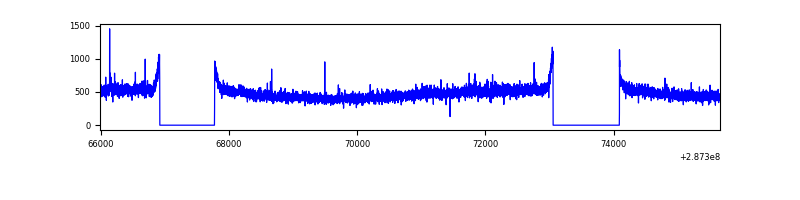 |
| D | 9671 | 7783 | 205 | 205 | 2.12% | 2.63% | 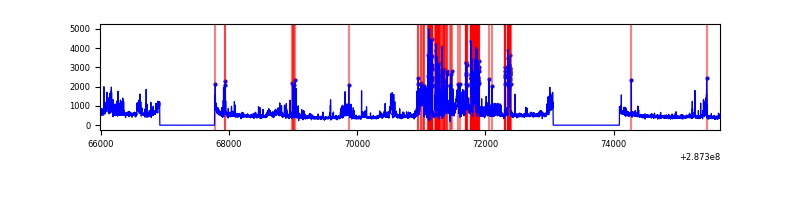 |
Top three noisy pixels from each quadrant. If the there are fewer than three noisy pixels in the level2.evt file, extra rows are filled as -1
| Pixel properties | Quadrant properties | ||||||
|---|---|---|---|---|---|---|---|
| Quadrant | DetID | PixID | Counts | Sigma | Mean | Median | Sigma |
| A | 15 | 174 | 96272 | 490.17 | 957 | 935 | 194.5 |
| A | 13 | 210 | 9775 | 45.45 | 957 | 935 | 194.5 |
| A | 0 | 226 | 8373 | 38.24 | 957 | 935 | 194.5 |
| B | 7 | 220 | 24650 | 129.61 | 955 | 932 | 183.0 |
| B | 12 | 111 | 21882 | 114.49 | 955 | 932 | 183.0 |
| B | 11 | 111 | 19022 | 98.86 | 955 | 932 | 183.0 |
| C | 14 | 238 | 143187 | 666.66 | 914 | 918 | 213.4 |
| C | 3 | 233 | 40512 | 185.53 | 914 | 918 | 213.4 |
| C | 13 | 61 | 6351 | 25.46 | 914 | 918 | 213.4 |
| D | 5 | 222 | 1025039 | 4562.48 | 911 | 882 | 224.5 |
| D | 7 | 238 | 644279 | 2866.25 | 911 | 882 | 224.5 |
| D | 10 | 70 | 51584 | 225.87 | 911 | 882 | 224.5 |
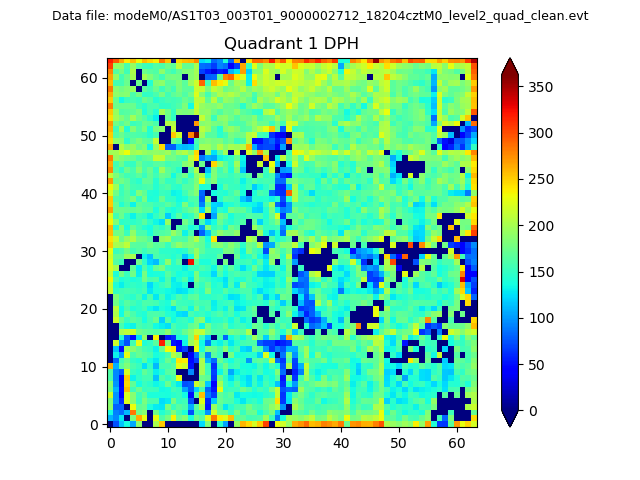
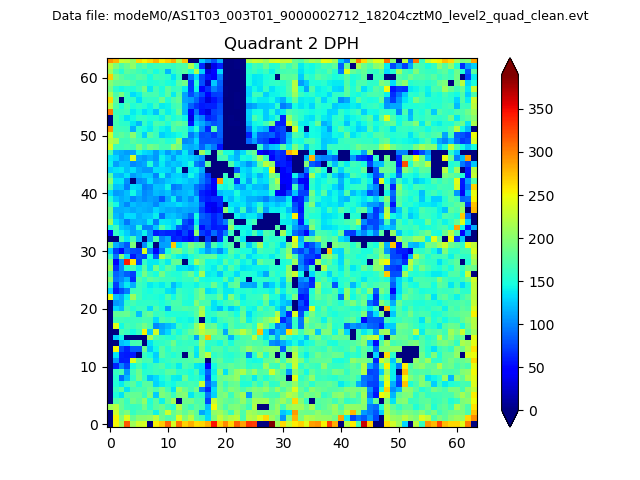
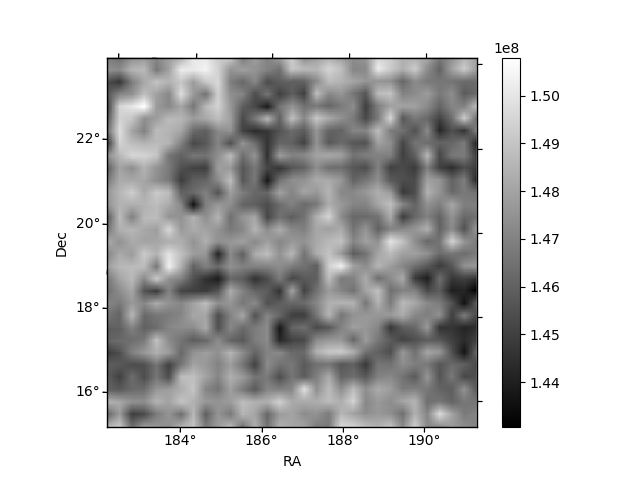
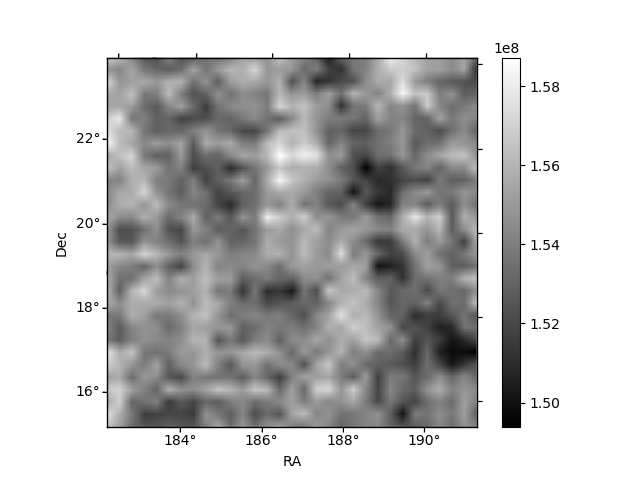
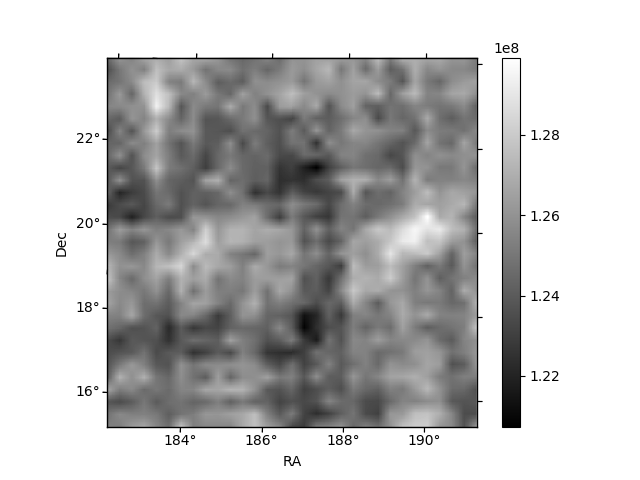
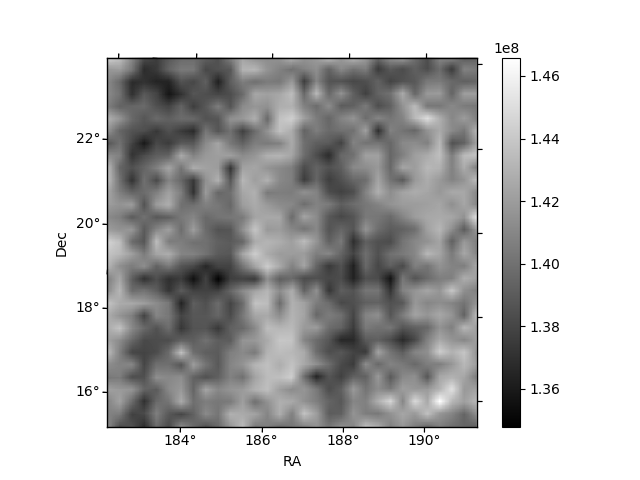
Histogram calculated using DETX and DETY for each event in the final _common_clean file
| Quadrant A |  |
 |
Quadrant B |
|---|---|---|---|
| Quadrant D | 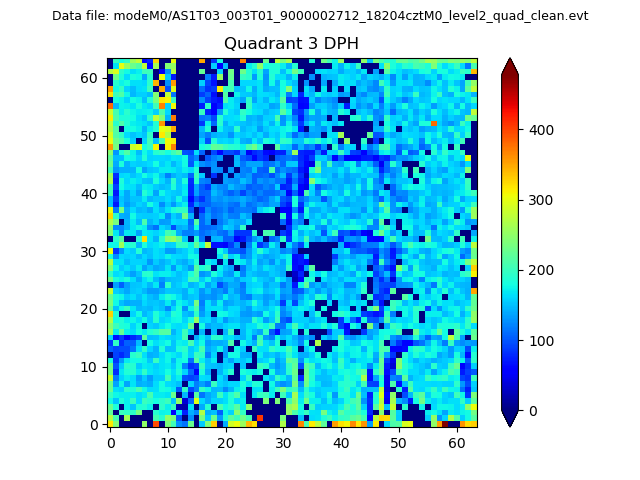 |
 |
Quadrant C |
| Plot type | Count rate plots | Images |
|---|---|---|
| Comparison with Poisson distribution Blue bars denote a histogram of data divided into 1 sec bins. Red curve is a Poisson curve with rate = median count rate of data. |
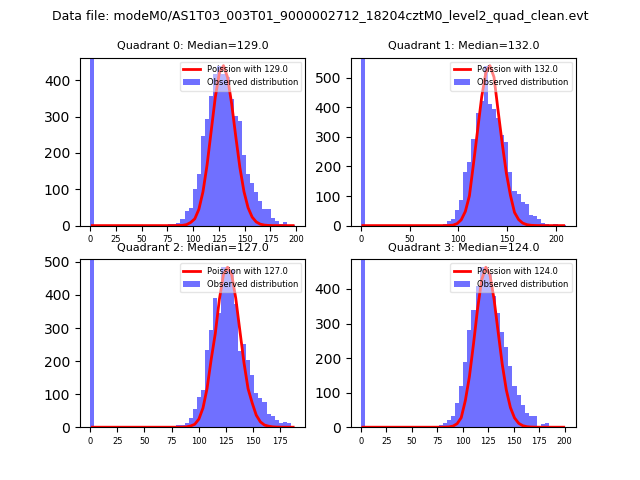 |
 |
| Quadrant-wise count rates Data is divided into 100 sec bins |
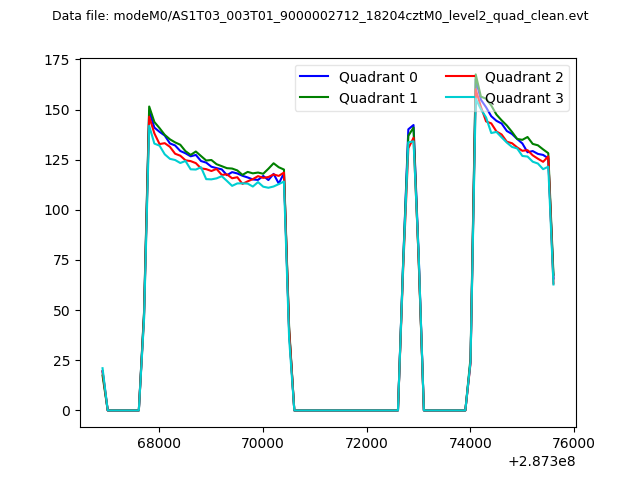 |
|
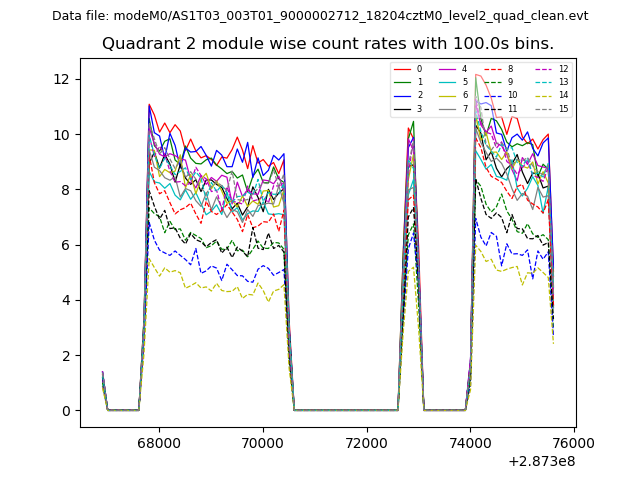
| Module-wise count rates for Quadrant A Data is divided into 100 sec bins |
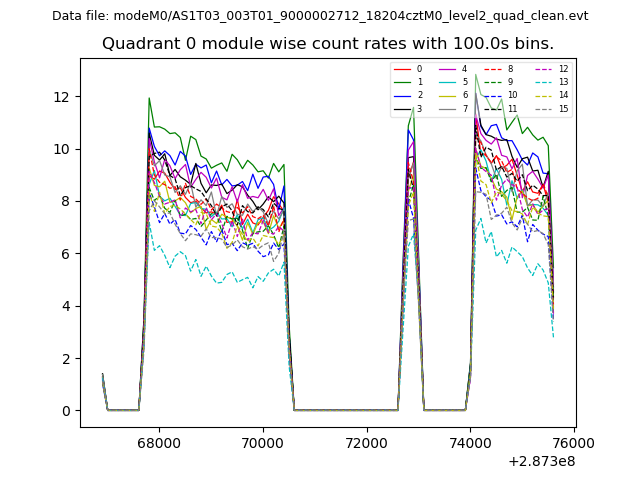 |
 |
| Module-wise count rates for Quadrant B Data is divided into 100 sec bins |
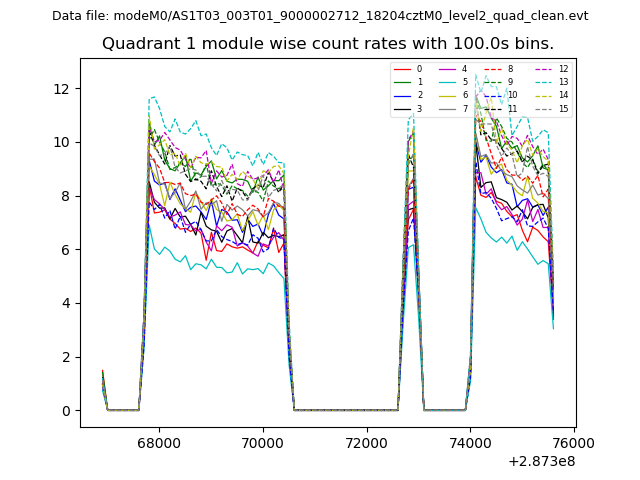 |
 |
| Module-wise count rates for Quadrant C Data is divided into 100 sec bins |
 |
 |
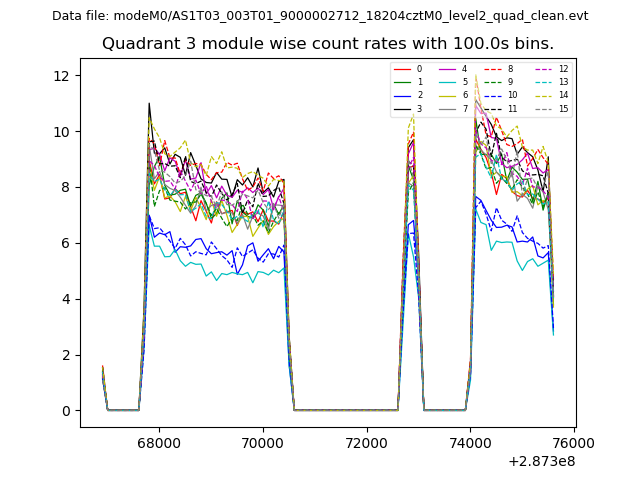
| Module-wise count rates for Quadrant D Data is divided into 100 sec bins |
 |
 |
| Parameter | Plot |
|---|---|
| CZT HV Monitor | 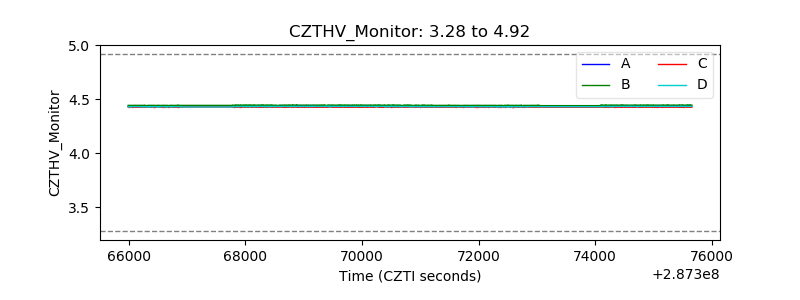 |
| D_VDD | 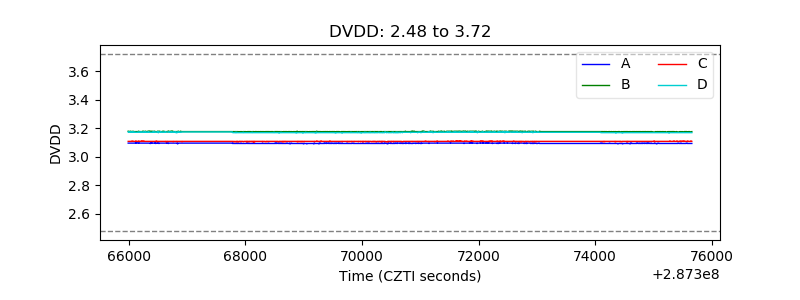 |
| Temperature 1 | 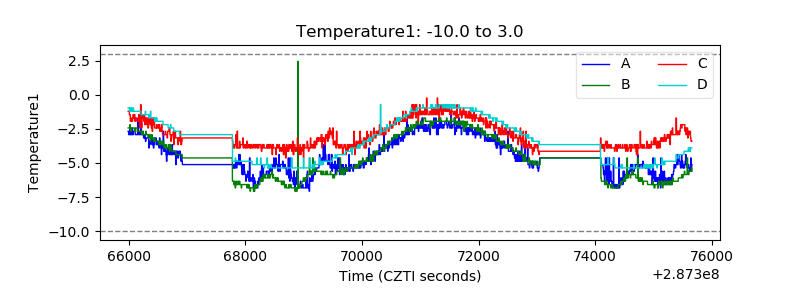 |
| Veto HV Monitor | 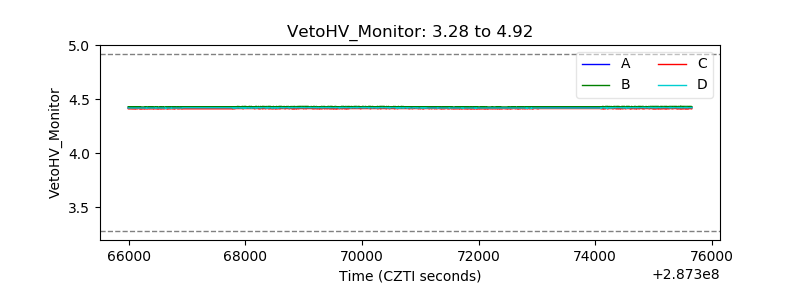 |
| Veto LLD | 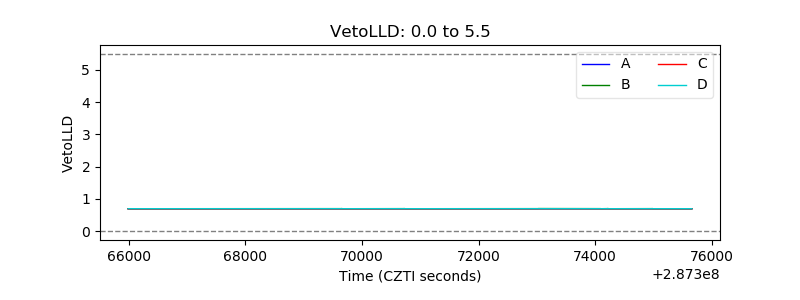 |
| Alpha Counter | 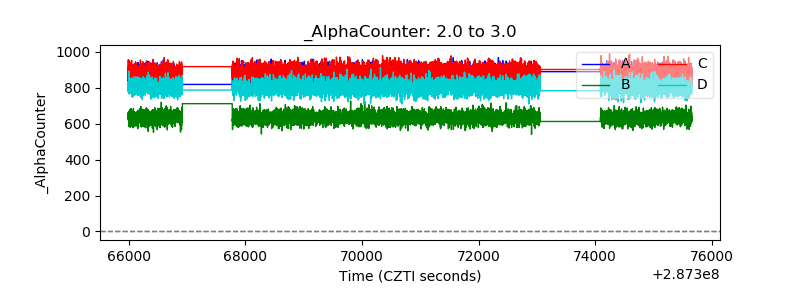 |
| _CPM_Rate | 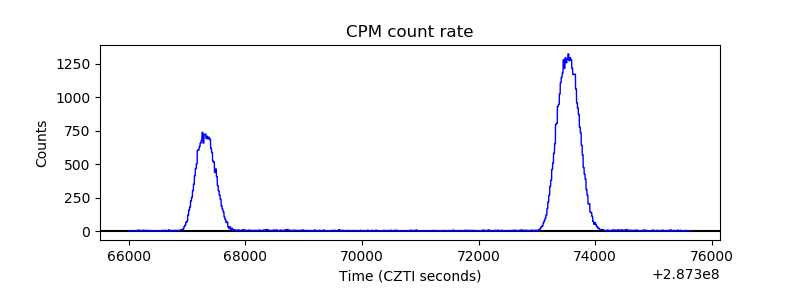 |
| CZT Counter |  |
| +2.5 Volts monitor | 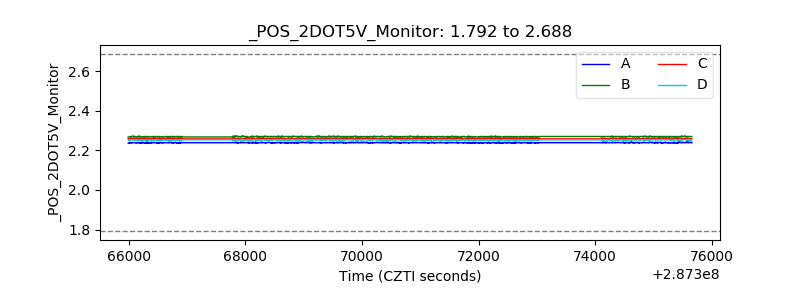 |
| +5 Volts monitor |  |
| _ROLL_ROT | 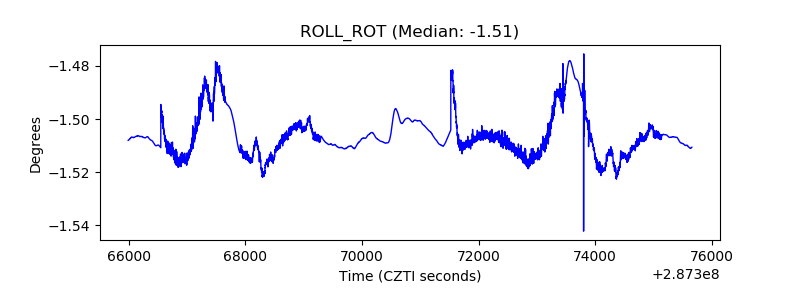 |
| _Roll_DEC | 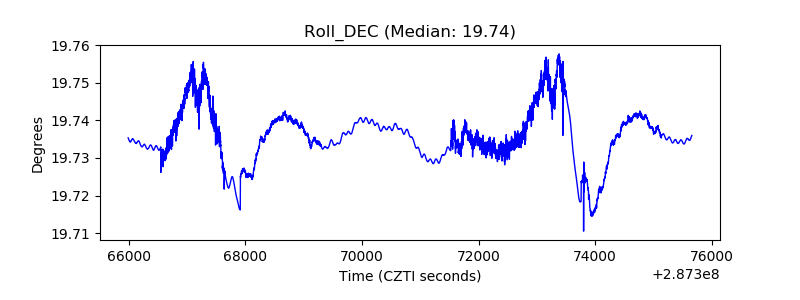 |
| _Roll_RA |  |
| Veto Counter | 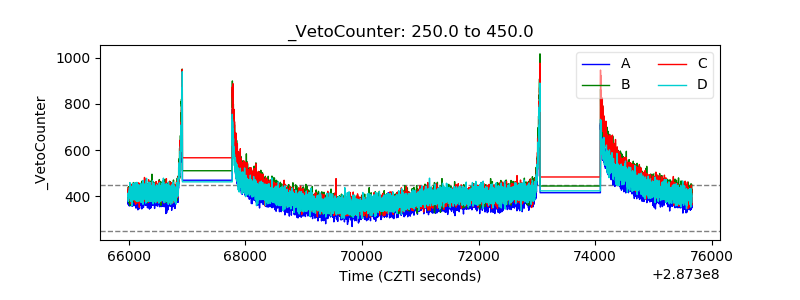 |